Article Text

Abstract
Objectives Unplanned readmissions to the intensive care unit (ICU) are highly undesirable, increasing variance in care, making resource planning difficult and potentially increasing length of stay and mortality in some settings. Identifying patients who are likely to suffer unplanned ICU readmission could reduce the frequency of this adverse event.
Setting A single academic, tertiary care hospital in the UK.
Participants A set of 3326 ICU episodes collected between October 2014 and August 2016. All records were of patients who visited an ICU at some point during their stay. We excluded patients who were ≤16 years of age; visited ICUs other than the general and neurosciences ICU; were missing crucial electronic patient record measurements; or had indeterminate ICU discharge outcomes or very early or extremely late discharge times. After exclusion, 2018 outcome-labelled episodes remained.
Primary and secondary outcome measures Area under the receiver operating characteristic curve (AUROC) for prediction of unplanned ICU readmission or in-hospital death within 48 hours of first ICU discharge.
Results In 10-fold cross-validation, an ensemble predictor was trained on data from both the target hospital and the Medical Information Mart for Intensive Care (MIMIC-III) database and tested on the target hospital’s data. This predictor discriminated between patients with the unplanned ICU readmission or death outcome and those without this outcome, attaining mean AUROC of 0.7095 (SE 0.0260), superior to the purpose-built Stability and Workload Index for Transfer (SWIFT) score (AUROC=0.6082, SE 0.0249; p=0.014, pairwise t-test).
Conclusions Despite the inherent difficulties, we demonstrate that a novel machine learning algorithm based on transfer learning could achieve good discrimination, over and above that of the treating clinicians or the value added by the SWIFT score. Accurate prediction of unplanned readmission could be used to target resources more efficiently.
- unplanned readmission
- prediction
- machine learning
This is an Open Access article distributed in accordance with the Creative Commons Attribution Non Commercial (CC BY-NC 4.0) license, which permits others to distribute, remix, adapt, build upon this work non-commercially, and license their derivative works on different terms, provided the original work is properly cited and the use is non-commercial. See: http://creativecommons.org/licenses/by-nc/4.0/
Statistics from Altmetric.com
Strengths and limitations of this study
Machine learning is applied to the prediction of unplanned intensive care unit (ICU) readmissions.
Transfer learning successfully exploits large data set information for the target data set and avoids over-fitting.
To the authors’ knowledge, this is the first application of transfer learning to the prediction of unplanned ICU readmissions.
The single-centre setting may limit generalisability of the results.
Introduction
Intensive care is expensive and, consequently, decisions regarding the timing of step-down to ward-level care must be made to ensure efficient allocation of this finite resource. However, premature intensive care unit (ICU) discharge may potentially expose a patient to the risk of inadequate levels of monitoring, and to limitations on the timeliness of interventions. Both possibilities are associated with preventable clinical deterioration, as well as increased mortality, morbidity and healthcare costs.1–4
Although unplanned readmission to ICU is uncommon,5 6 the perceived high mortality in this group has led to readmission rates being widely adopted as local and national performance metrics and quality improvement targets for transfers of care. Outreach and liaison services have been proposed to safeguard high-risk ICU step-down patients. However, recent studies examining the impact of outreach services on readmission rates have had mixed results,7–11 highlighting that local organisational factors and the configuration of outreach services may be particularly important. Overall, it seems plausible that unplanned ICU readmission remains harmful in some circumstances.
Even without an association with harm, unplanned ICU readmission is highly undesirable as it is resource intensive, disconcerting for patients and contributes to unexpected variance in care delivery, making cost-efficient resource planning difficult. An accurate predictor of readmission likelihood would be helpful for planning step-down care and/or for focusing outreach and monitoring resources on those patients who have the highest chances of deterioration.
The timing of readmission may also be clinically significant. Readmission correlates strongly with severity of illness. Whether a readmission is determined by ICU management, or represents an event more closely related to chronic disease, is time dependent, with an inflection point around 48 hours.2 A number of authors have attempted to develop tools for predicting readmission, and this literature has been the subject of a systematic review.5 Given that later readmissions are more likely to be associated with chronic diseases,2 and less predicted by ICU factors, it follows paradoxically that prediction of early (say before 48 hours) readmission is a more challenging problem than late readmission.
It is important to appreciate that predicting readmission is a far more complex problem than, say, length of stay prognostication,12 or the early identification of the deteriorating patient on the ward. Discharge from the ICU is not a random event, but instead represents a clinical assessment of whether the underlying condition has resolved sufficiently13 to make the likelihood of subsequent deterioration on the wards low. Arguably, this decision is made in light of more investigatory results and monitoring observations than at any other point in the patient journey. To improve over the physician, a more sophisticated system or algorithm is needed that is able to appreciate subtle and multidimensional time trends.
‘Machine learning’ (ML) refers to a collection of algorithmic techniques for data representation and analysis that have been successfully applied to prediction problems in many domains. Although these techniques may lack the transparency of simple regression modelling, they are typically better able to deal with the non-linearity, high dimensionality and heterogeneity of complex data. We have previously applied such techniques to several problems, including sepsis detection14–16 and mortality or stability prediction.17 Due to the prevalence of electronic patient record (EPR) systems, structured patient data are widely available and enable sophisticated computer algorithms to be implemented at the bedside. In this paper, we studied a cross-sectional group of ICU patients, and built and trained an ML algorithm. We hypothesised that this algorithmic predictor would deliver statistically significantly superior performance over the purpose-built Stability and Workload Index for Transfer (SWIFT)18 score, as measured by area under the receiver operating characteristic curve (AUROC) in 10-fold cross-validation.
Methods
We adopted a cross-sectional design, in which we used the set of all ICU patients admitted to a tertiary care centre during a 2-year period. After excluding some patients on the basis of care units visited, incomplete data, indeterminate or out-of-limits onset time, or indeterminate outcome, we used the remaining patients to construct a data set. We then measured the ability of AutoTriage to learn the ICU readmission problem by training and testing on these data using a 10-fold cross-validation scheme.
Data
After local institutional review and approval (local approval number PRN5086), a set of 3326 ICU episodes was collected at Cambridge University Hospitals NHS Foundation Trust (CUH) between October 2014 and August 2016. This facility provides routine and tertiary services. All records were of patients who visited an ICU at some point during their stay, specifically, the hospital’s general and neurosciences ICUs. We excluded admissions to the paediatric ICU, and therefore all patients were adults (>16 years). We also excluded admissions to the transplant high dependency unit and coronary care units.
Both ICUs included were tertiary referral centre specialist units: the 20-bed general unit providing specialist liver and transplant services and the 23-bed neurosciences unit providing specialist neurosurgical, neurological and major trauma intensive care. Both units also provide general ICU services for the hospital. One important characteristic of both ICUs is that the caseload almost entirely comprised emergency admissions with very few routine (eg, elective postoperative) admissions. The cases are approximately equally divided between the two units.
Routinely recorded patient age, and clinical measurements of various types, namely vital signs (here represented as systolic blood pressure, pulse pressure, heart rate, temperature, respiration rate and SpO2), laboratory measurements (bilirubin, creatinine, international normalised ratio (INR), lactate, white cell count, platelet count and pH), FiO2 and total Glasgow Coma Score (GCS) were obtained from the hospital EPR system. These measurements were available throughout the patient’s stay, including in the emergency department, ICU and wards. Physiological data were typically sampled approximately hourly (although clinical monitoring is continuous, standard institutional practice is to store nurse-validated ‘end-of-hour’ values in the EPR and these EPR values were used in this study). For inclusion, all patients were required to have at least one measurement for each of the listed vital signs and GCS at some point during their stay. Diagnostic codes were deliberately excluded from the data set to minimise the risk of reidentification of patients with rare conditions.
Along with this record of patient clinical state and laboratory test results, the Electronic Medical Record contained information on the patient’s location by ward. From this information on transfer within the hospital, we determined whether the patient was receiving intensive care or not at each time point during their stay. We divided all units into ICU, non-ICU and specialist diagnostic and therapeutic units (eg, endoscopy, dialysis and surgery). If patients were in an ICU at a particular time, they were deemed to be receiving intensive care, non-intensive care if they were in a non-ICU unit, and a continuation of the most recent care type if they were visiting a specialist diagnostic or therapeutic unit (see figure 1).

Transfers undergone by an example class 1 patient. In this example, a patient is admitted to the hospital via the ED, which is classed as a non-ICU-type unit. From the ED, the patient is transferred to an ICU-type unit. After some time in the ICU, the patient is transferred down to a ward (a non-ICU-type unit), but within the next 48 hours, the patient is transferred back to the ICU. The patient survives, and is ultimately discharged. Since the patient’s first ICU stay was followed by another ICU stay, starting less than 48 hours later, this patient is given a class 1 (failed down-transfer) label under the gold standard definition. When training or providing test predictions, the patient’s condition at the time of the first down-transfer from the ICU is used to predict this label. ED, emergency department; ICU, intensive care unit.
Using this information, we determined the first time each patient was transferred out of the ICU, and attempted to predict, at this time, whether the patient would die or return to the ICU within 48 hours. If this time was earlier than 5 hours after ‘first vitals’ (the first time any of vitals or GCS were recorded) or after the 500 hours limit of data discretisation (see the Processing section) the patient was discarded. We consulted the remaining portion of the patient’s transfer and discharge history during the hospital stay to determine if this prediction was correct. Any patient who returned to the ICU or died in hospital within 48 hours was labelled as ‘Class 1’ (having an adverse outcome); this assumes that a patient who died in another ward should have been transferred back to the ICU. Patients who were down-transferred and discharged are ‘Class 0’ (no adverse outcome) if this discharge occurred at least 4 hours after down-transfer. Any patient who did not fall into either of these categories was excluded as indeterminate, such as those discharged less than 4 hours after down-transfer or not down-transferred from the ICU at any point in their record (eg, by dying in their first ICU visit). In the absence of follow-up after the end of the hospital stay, it is also possible that patients departed the hospital and subsequently died within the 48 hours period following ICU discharge, while still receiving a class 0 label.
The final number of examples (hospital admissions) was 2018. The process by which the raw data from the EPR were condensed down to this data set is shown in figure 2 (Exclusion flow chart), and characteristics of the final study population are presented in table 1.

Exclusion diagram. Individual hospital admissions are screened to produce a final data set (n=2018; 88 class 1; 1930 class 0; 4.36% prevalence). HDU, high dependency unit; ICU, intensive care unit.
Demographic information for the final study population, all of whom were ICU patients at CUH. The final study population was somewhat more heavily male than female. Among those who were readmitted to the ICU, the distribution of this second ICU stay’s length skewed strongly to the right (towards longer, second ICU stays)
Processing
We used data automatically and routinely collected from laboratory instruments and monitoring equipment and stored in the EPR at CUH (Epic Systems, Verona, WI, USA). The data fields were extracted from the EPR using custom structured query language queries written in-house. The data were fully anonymised for analysis. To this end, patient ages were subjected to a random jitter, and all variable dates and times were subjected to patient-specific random offsets to further ensure anonymity. The patient identifiers were then stripped, and the set entity/attribute/value data were converted into flat files. Only fully anonymised data were passed to the analysis team.
These flat files were then loaded into a custom data structure in MATLAB (The MathWorks, Natick, MA, USA). All subsequent computational procedures described in this work were also carried out in MATLAB. Each patient record was associated with an onset (ICU down-transfer) time and a class label (1 or 0) as described above.
Several steps were involved in measurement preprocessing. Data from each channel (eg, heart rate) were screened for non-physiologic outliers. Each channel was then binned, using at most 500 one-hour bins, starting from the first available measurement (of any channel). Values in each bin were averaged, yielding a single value. Empty bins were imputed (filled) with the value of the measurement in the most recent, non-empty bin of that type, if any was available. In particular, some measurements could be missing at time of ICU discharge.
The basic measurements of GCS and vitals were used for classification. As described above (see the Data section), every patient was required to have one value recorded for each for study inclusion. As available, we also used bilirubin, platelet count, creatinine, INR, lactate, FiO2, white cell count and pH. For each measurement, we extracted five values, the four binned values before prediction time and the one binned value at prediction time, and concatenated these values into a feature vector x with 76 elements (15 measurement channels, plus age). Because this representation is only the recent past relative to prediction time, the classifier is using roughly the same amount of information to make its predictions, regardless of the time of prediction, up to effects from the imputation scheme. Critically, because those patients with first ICU discharge before 5 hours postfirst vitals or after 500 hours from hospital admission were eliminated from the study population, all predictions were based on a 5-hour data window falling within the discretisation.
Prediction and training
Non-transfer learning methods
We divided the final data set into 10 cross-validation folds. For each fold, we normalised the data and trained our predictor (a boosted ensemble of 1000 decision trees) on the other folds. We calibrated this output using a logistic regression on the training data and then predicted on the left-out fold.
All classifiers were constructed using AdaBoost,19 20 an ensemble technique which combines the results from multiple weak decision trees in an iterative fashion. This algorithm also handles splitting or thresholding of quantitative predictor variables. We limited each tree to split no more than eight times, and no more than 1000 trees were then aggregated in the iteration through gradient boosting to generate a robust risk score. When the predictions of individual trees are evaluated, missing data are handled by returning the tree evaluation at the node where the requisite data are missing. Because many trees are involved, the ensemble’s overall dependence on each predictor variable can be computed, but it is difficult to causally attribute any particular prediction to particular inputs.
The results were combined across all 10 folds to assess system performance. We compared this method with our implementation of SWIFT,18 which is designed for this clinical task, on the basis of AUROC curve values (see eg, ref 21 for definitions and discussion). Our data set lacks PaCO2 measurements; these provide one of the summed terms in the SWIFT score. In their absence, we compared with the sum of the remaining terms.
Transfer learning methods
In transfer learning, some information from one collection of data (the ‘source’ collection, typically large) is ‘transferred’ to help prediction on another (the ‘target,’ on which the system is to be deployed; typically small) (see ref 22 for a review). We employed the Medical Information Mart for Intensive Care (MIMIC-III) database (V.1.3)23 as our source collection, and treated the CUH down-transfer problem as our target. MIMIC-III is a collection of over 50 000 ICU stays from Beth Israel Deaconess Medical Center, in Boston, Massachusetts, USA, between 2001 and 2012. The data set contains vital signs and laboratory data, along with information on procedures, and patient demographics, along with transfer and outcome information.
We defined a similar, longer term failed down-transfer prediction problem on the source MIMIC-III set. A class 1 label was given to those patients who either returned to the ICU within the same hospital stay, or those who died within 2–30 days from ICU discharge. Class 0 patients were those who were discharged from the ICU without returning during the same hospital stay, and who did not die within the next 30 days. The definitions were consistent with MIMIC-III’s different handling of non-ICU information and its inclusion of postdischarge death information from Social Security death records. We defined prediction time as the time of the last measurement (usually at the end of the ICU stay) and we extracted feature vectors as in the CUH data set. After applying a similar exclusion scheme, the resulting source set had 44 741 ICU visit records and associated outcomes with class 1 prevalence of 12.56%. We used the entire source MIMIC-III collection for our transfer training procedure.
Identical to the non-transfer ensemble trained above, we applied 10-fold cross-validation and predicted on each of the 10 test sets, with a predictor trained on the MIMIC-III source collection, plus the non-testing 9/10ths of the target CUH set. The predictor used was trained using the same structure and the same training algorithm as the non-transfer learning experiments.
We chose a simple method to combine the source and target data sets (similar to ref 24), in which the sets were concatenated to form a single training data set. While using a fixed set of examples from the target and source sets (the latter containing many more encounters), we changed the relative degree to which the training process ‘paid attention’ to the target over the source. This was controlled by adjusting the relative weight of the training loss on the target and source examples. For w in the interval (0, 1), target data were weighted by a factor w, source data by (1 w), and the total training loss was then normalised. Since the classifier is constructed to minimise the loss, w close to 1 emphasises learning the target data. However, this may fit to spurious ‘noise’ features of this small set, known as ‘over-fitting.’ Conversely, for w close to 0, the classifier avoids overfitting by supplementing its training data, but accepts bias due to mismatch between the sets. For w=0, the target data are ignored entirely, equivalent to applying an ‘off the shelf’ source-trained classifier. If target and source are the same, the ‘source’ and ‘target’ designation becomes meaningless and each example should be weighted equally; the correct value of w is the ratio of the target data set’s size over the total number of examples, here 0.043. Any larger w indicates that target examples are more informative than source examples. By testing selected w values in the interval (0, 1), we empirically determined an effective w.
Results
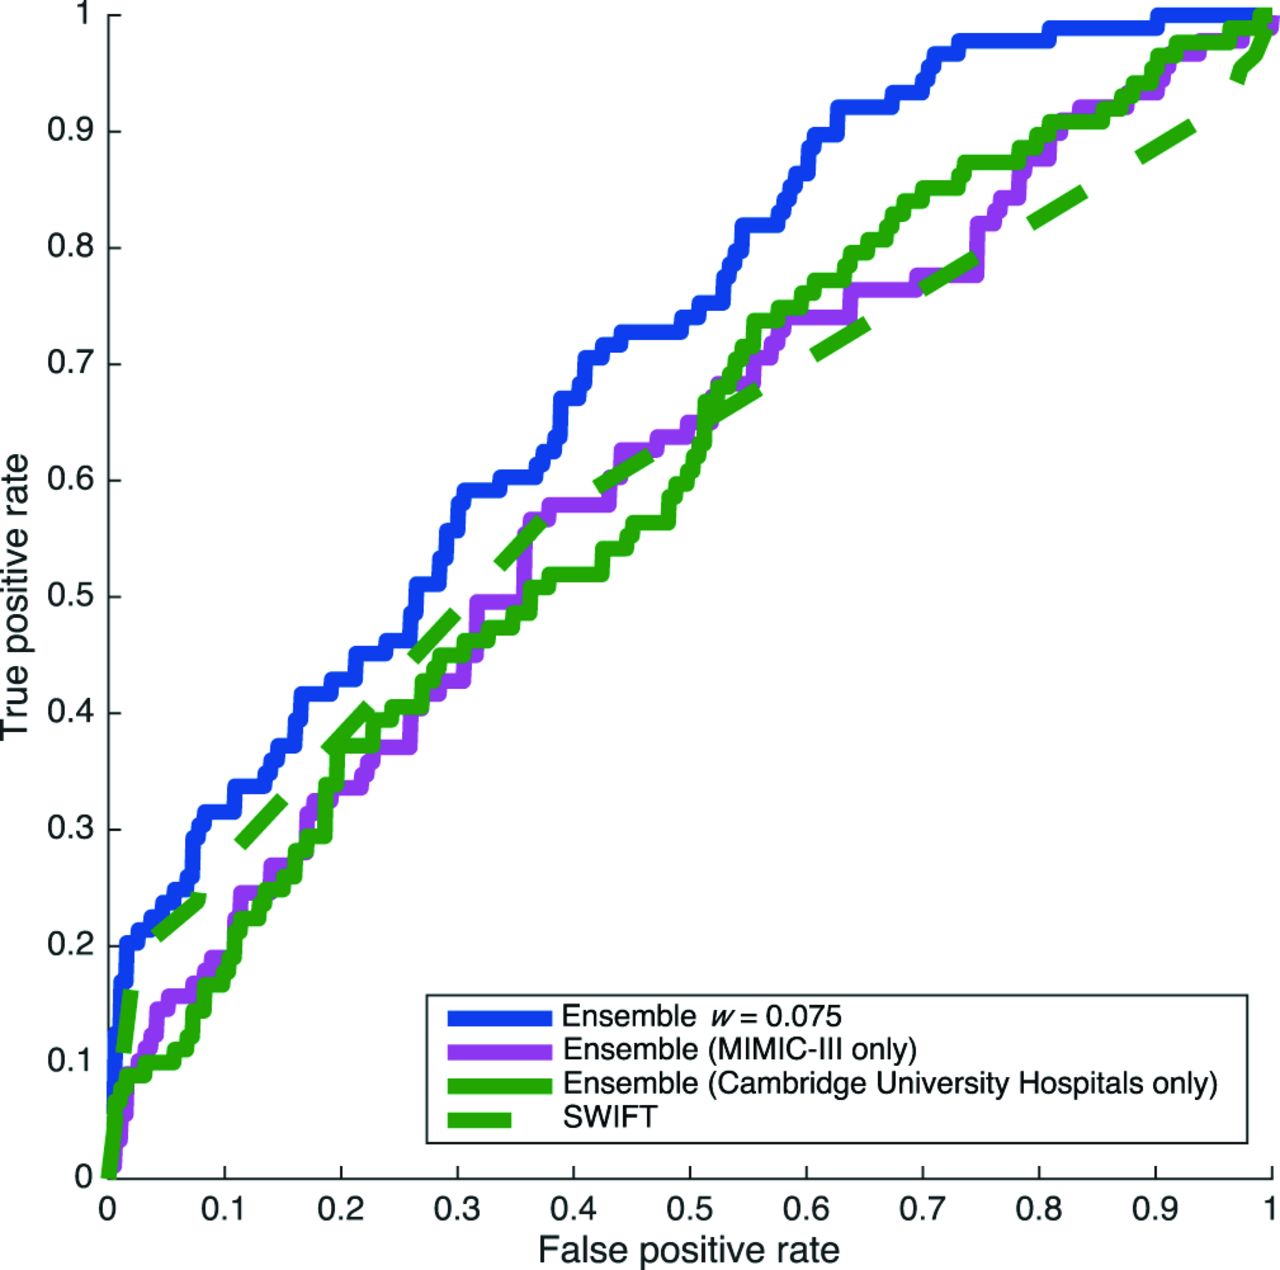
Performance characteristics for our prediction algorithm and the SWIFT score are summarised in table 2. We computed receiver operating characteristic (ROC) curves for the thresholded scores given by each classifier, and averaged the area under these curves (AUROC) across each of the 10 test folds. Average ROC curves are presented in figure 3. ROC curves show sensitivity (the fraction of positive cases which receive a positive label) as a function of 1−specificity (the fraction of negative cases receiving a positive label). The CUH-trained ensemble without benefit of transfer learning (green, solid, AUROC 0.6092, SE 0.0320; w=1) and a naive, MIMIC-III-trained classifier (pink, solid, AUROC 0.6079, SE 0.0252; w=0) applied to the CUH down-transfer problem fail to do substantially better than SWIFT (green, dash-dot, AUROC=0.6082, SE 0.0249). The transfer classifier trained using a combination of MIMIC-III and CUH data, where individual CUH examples are weighted two times as heavily as MIMIC-III examples (blue, solid), yields AUROC 0.7095 (SE 0.0260), superior performance to SWIFT (p=0.014 in per-cross-validation-fold, one-tailed pairwise t-test). This best weight is equivalent to w=0.075. The AUROC of each ensemble is plotted with respect to mixture weight w in figure 4. For every tested mixture weight other than 0 or 1 (MIMIC-III only and CUH only, respectively), the AUROC obtained is approximately 0.07 better than these extremes.

ROC curves for prediction performance on CUH test data. The choice of detection threshold determines a trade-off between sensitivity (true positive rate) and 1−specificity (false positive rate). The superiority of the transfer-learning-trained ensemble (solid) over SWIFT is clear throughout the operating regime, except at the very low-sensitivity, high-specificity portion of the curve (far left), where they perform similarly. CUH, Cambridge University Hospitals NHS Foundation Trust; ROC, receiver operating characteristic curve; MIMIC III, Medical Information Mart for Intensive Care; SWIFT, Stability and Workload Index for Transfer.

Target test set AUROC changes with mixture weight w (the proportion of total training example weight allocated to CUH examples). The results shown in figure 3 are at the left (MIMIC-III only) and right (CUH only) extremes of this interval, and at the peak of the curve (optimal transfer mixture weight). Equal per-example weighting corresponds to w=0.043; the maximal w value of 0.075 indicates that target examples are indeed more informative than source examples. AUROC, area under the receiver operating characteristic curve; CUH, Cambridge University Hospitals NHS Foundation Trust; MIMIC III, Medical Information Mart for Intensive Care.
Performance characteristics for the trained ensembles and SWIFT. CUH, Cambridge University Hospitals NHS Foundation Trust; MIMIC III, Medical Information Mart for Intensive Care; SWIFT, Stability and Workload Index for Transfer.
Discussion
The use of scoring systems and ML algorithms for predicting deterioration has attracted much interest. Such efforts represent an attempt at automating clinician evaluation when logistic constraints mean that important diagnoses may be otherwise missed. However, discharge from ICU is conceptually quite different; an expert clinician, often with a detailed knowledge of the patient’s condition and progress, is generally available to make the decision as to the safety of the down-transfer. Since the clinician would not intentionally discharge a patient from the ICU knowing that this would result in readmission, any prediction that an algorithm makes must be over and above the prediction of the clinician. Our experiment shows that it is possible to construct an algorithm that solves this problem, achieving an AUROC of ~0.7. While this has modest predictive power, it should be remembered that this result is achieved in a group of patients that the ICU clinician had already assessed as being fit for down-transfer, making this a particularly hard prediction problem. The fact that even such predictive power is possible suggests that there are factors that clinicians do not systematically appreciate. From our work, it is not possible to know whether our set of predictors is optimal and further studies are warranted to exhaustively examine this question.
The data set studied in this work, while modest in size by ML standards, was relatively large and complete by clinical standards, and represented nearly 2 years of ICU patients in a large hospital. From a ML perspective, it may be that the small size of the data set limits the predictive power of models that can be learnt from this data set. In particular, for models that are too expressive and flexible to be supported by the existing collection of data, there exists a danger of overfitting, that is, training to recognise spurious elements of the training data set that do not actually aid prediction performance. With more training data, more powerful and expressive classifiers could be used, which would be expected to improve predictive performance. In this study, we addressed training data scarcity by using transfer learning with data from an analogous problem in another hospital.
As illustrated in figure 3, a simple transfer learning approach offers performance advantages over training with either source domain data only or target domain data only. In particular, transfer learning appears to offer a ‘regularizer,’ which helps prevent overfitting to the target domain data, and so results in much better prediction performance on the target test sets. Indeed, the best choice of mixture weight, w=0.075, represents a compromise whereby w was small enough to regularise the target domain classifier, but large enough that the resulting classifier benefited from access to target domain training data (figure 4). With this choice of w, the corresponding predictive performance is significantly better than that of SWIFT. The degree of performance enhancement is a function of w, which controls the strength of this regulariser. Fairly strong regularisation (w=0.075) yields superior performance in these experiments. Since this w is larger than 0.043=2018/(2018+44 741), the ratio of target examples to the sum of target and source examples, this result indicates that target data are indeed more informative, and that each should be weighted approximately twice as heavily as source examples.
Importantly, transfer learning techniques offer the opportunity to improve the performance of predictors trained on small to medium-sized data sets. This is precisely the setting that exists in many clinical institutions, which cannot themselves assemble a multiyear collection of tens of thousands of patient records, such as MIMIC-III. This transfer learning method is straightforward and produces AUROC margins of at least 0.07 versus training on only the target (CUH) data or the source (MIMIC-III) data for a wide range of mixture weights w. This is a direct, clear means by which publicly available data can be leveraged to add value by producing a substantial performance boost.
Some limitations apply to this study’s generalisation. First, the predictions were made in a selected, retrospective population of patients in a single tertiary care facility; while encouraging, the present work does not necessarily imply that the system would perform as well prospectively, or in another clinical setting. Second, a classifier of fixed architecture was used in this work, for both transfer and non-transfer training. It is likely that other methods could improve a target-facility-only classifier, without resorting to transfer learning; such techniques would strengthen the baseline used in comparison against the transfer method, but might be incorporated into the transfer method as well, improving its performance. Third, the post hoc optimisation of the transfer weight w is illustrative, rather than deployable. However, very similar results can be obtained by nesting another cross-validation inside the training to select the transfer weight.25
Our data were limited to approximately hourly recordings, as is common UK ICU practice. As a result, transient changes in patient state are often not captured and it is possible data of higher temporal resolution may improve prediction although such data also may contain a higher number of artefacts. The caseload in the ICUs considered is that of a specialist tertiary referral centre with very little routine elective care. Approximately half of the cases were specialist neurosciences and major trauma. This focus may limit the external generalisability of our work. However, it seems reasonable to believe that emergency work is more unpredictable and heterogeneous than elective intensive care and therefore similarly reasonable that the prediction task in our data set is a more difficult task. Further studies are required to evaluate the algorithms in differing case mixes. Our study comprised two units with diverse clinical caseloads (general/transplant and neuroscience/trauma)—it is possible that better classifiers could be built taking account of this, but our sample size was too small for us to attempt this extension in the present work.
It is likely that other institutional factors affect ICU readmission. Our ICU bed occupancy is consistently high (>95%) and so this pressure does not vary. However demand for ICU beds may vary (seasonally, for example) and other institutional factors, such as ward service intensity, are also likely to be important. Our data set was of modest size and so further work is merited to examine the incremental predictive impact of such institutional effects.
Conclusions
This work demonstrates a method that provides improved prognostic performance for the difficult and important problem of failed patient down-transfer. Such a tool may find application either in helping with ICU discharge decisions, or in better targeting ward resources towards patients with a high chance of unplanned readmission, so that this can take place in an ordered and timely manner before harm can occur. The performance of the predictive framework we have developed for this problem is quantitatively superior to that of the purpose-built SWIFT score. Our work also demonstrates the potential of transfer learning to improve the performance of our predictive tools for comparable problems.
References
Footnotes
Contributors TD, RD, JC and AE conceived the described experiments. AE acquired the Cambridge University Hospitals data, with assistance from Dr Afzal Chaudhry and Shaun Hyett. TD executed the experiments. TD, RD, JC and AE interpreted the results. TD and AE wrote the manuscript. TD, RD, JC, MT, CS, DJW and AE revised the manuscript, with assistance from Dr Jana Hoffman, as well as Emily Huynh and Siddharth Gampa. All authors approved the version to be published and agree to be accountable for all aspects of the work in ensuring that questions related to the accuracy or integrity of any part of the work are appropriately investigated and resolved.
Funding Research reported in this publication was supported by the National Institute of Nursing Research, of the National Institutes of Health, under award number R43NR015945. The content is solely the responsibility of the authors and does not necessarily represent the official views of the National Institutes of Health.
Competing interests TD, JC and RD are employees or contractors of Dascena Inc, developers of the AutoTriage system.
Provenance and peer review Not commissioned; externally peer reviewed.
Data sharing statement No data obtained from Cambridge University Hospitals in this study can be shared or made available for open access. MIMIC-III is a publicly available database.