Article Text

Abstract
Objective Financial incentives associated with private insurance may encourage healthcare providers to perform more caesarean sections. We therefore sought to determine the association of private insurance and odds of caesarean section.
Design Systematic review and meta-analysis.
Data sources MEDLINE, Embase and The Cochrane Library from the first year of records through August 2016.
Eligibility criteria We included studies that reported data to allow the calculation of OR of caesarean section of privately insured as compared with publicly insured women.
Outcomes The prespecified primary outcome was the adjusted OR of births delivered by caesarean section of women covered with private insurance as compared with women covered with public insurance. The prespecified secondary outcome was the crude OR of births delivered by caesarean section of women covered with private insurance as compared with women covered with public insurance.
Results Eighteen articles describing 21 separate studies in 12.9 million women were included in this study. In a meta-analysis of 13 studies, the adjusted odds of delivery by caesarean section was 1.13 higher among privately insured women as compared with women with public insurance coverage (95% CI 1.07 to 1.18) with no relevant heterogeneity between studies (τ2=0.006). The meta-analysis of crude estimates from 12 studies revealed a somewhat more pronounced association (pooled OR 1.35, 95% CI 1.27 to 1.44) with no relevant heterogeneity between studies (τ2=0.011).
Conclusions Caesarean sections are more likely to be performed in privately insured women as compared with women using public health insurance coverage. Although this effect is small on average and variable in its magnitude, it is present in all analyses we performed.
- caesarean section
- health insurance
- private insurance
- financial incentives
- medical practice variation
- health services
This is an Open Access article distributed in accordance with the Creative Commons Attribution Non Commercial (CC BY-NC 4.0) license, which permits others to distribute, remix, adapt, build upon this work non-commercially, and license their derivative works on different terms, provided the original work is properly cited and the use is non-commercial. See: http://creativecommons.org/licenses/by-nc/4.0/
Statistics from Altmetric.com
- caesarean section
- health insurance
- private insurance
- financial incentives
- medical practice variation
- health services
Strengths and limitations of this study
Our meta-analysis includes a broad literature search, screening and data extraction performed in duplicate, an exploration of study characteristics as a potential source of variation between studies and firm quality assessment and represents major strength of our study.
Sensitivity analyses was performed involving studies that required exclusion in main analysis due to overlapping populations.
The differences in the characteristics of the study populations, type of data used, types of CS analysed and variables used for adjustment in statistical analyses across studies represent a major limitation of our study.
Unadjusted estimates of associations were larger, which suggests the presence of confounding, and we cannot completely rule out residual confounding in adjusted estimates.
Introduction
The global raise of caesarean section (CS) rates during the past decades has raised concerns over appropriateness of usage of the procedure.1 2 The increase and immense variation among countries’ regions and hospitals has been persistent over the years.3–14 Brazil has the highest rate of CS followed by China, Turkey and Mexico.15 USA and other developed countries are not far behind. Even countries that traditionally have had low CS rates, like Norway or Sweden, have seen substantial increase in CS rates.15 This increase has been accompanied with considerable variation within countries.15 In the USA, there was a fourfold difference in CS rates in low and high use areas.15 In England, the rates have varied threefold among National Health Service trusts.15 In British Columbia, Canada, the CS rates varied from 14.7% to 27.6% across health service delivery areas.15 The understanding of escalation of CS rates is important as it may prevent negative outcomes on health of mothers and newborns as well as reduce unnecessary costs related to delivery.
Such increase and variation cannot be explained by clinical factors alone.15 Evidence points to many additional, health system related factors, in particular supplier-related factors.15 Financial incentives such as higher payment for CS and specifics of reimbursement arrangements linked with private insurance seem to influence supplier behaviour, be that physician or hospital, affecting this way clinical decision as to whether perform CS or not.14–22 We therefore performed a systematic review and meta-analysis to determine the association of insurance status of women with the odds of delivery by CS.
Materials and methods
Search strategy and data sources
We combined search terms indicating CS, such as ‘caesarean section’, ‘caesarean delivery’ and ‘caesarean’, with search terms associated with the study design such as ‘small area analysis’, ‘medical practice variation’ and search terms associated with determinants of variation and increase of CS rates. We did not restrict search by type of language or publication date. We searched MEDLINE, Embase and The Cochrane Library from inception to 4 August 2016, when the search was last updated. In addition, we manually searched the reference lists of all included studies and earlier systematic reviews that we identified.
Study selection and outcomes
To be eligible for inclusion, studies had to report data to allow the calculation of OR of CS comparing women covered by private insurance with women covered by public insurance in a specific healthcare system. The prespecified primary outcome was the adjusted OR of births delivered by CS of women covered with private insurance as compared with women with public insurance coverage. The prespecified secondary outcome was the crude OR of CS of women covered with private insurance as compared with women with public insurance.
Data extraction
Two researchers (IH and MB) screened the papers and extracted data independently. Data from full-text articles were extracted onto a data extraction sheet designed to capture data on study population, study design, data sources, setting, type of CS analysed and statistical analysis. We extracted adjusted and/or unadjusted ORs of CS of women with private insurance as compared with CS of women with public insurance. Differences among researchers with regards to study inclusion and data extraction procedure were resolved by consensus and consultation with other authors.
Quality assessment
Quality assessment was performed using the Quality In Prognostic Studies (QUIPS) tool.23 The QUIPS is used to assess risk of bias in prognostic studies across six domains including: selection bias, attrition bias, measurement bias of prognostic factor, measurement bias of outcome, confounding and bias related to the statistical analysis and presentation of results.23 We decided to use QUIPS tool as it seemed the most appropriate to perform quality assessment of the studies under investigation. Only minor adjustment of the original tool was performed; that is, we added the option ‘not applicable’ in rating of items assessed for judging domains of bias. Each study was read in full and evaluated independently by two researchers (IH and MB). We used three levels of rating, that is, ‘high’, ‘moderate’ or ‘low’ to assess the risk of bias for all domains.23 Any assessment differences were discussed, and a single rating was assigned to each study. A study was judged with a high or a moderate risk of bias in case only one of the domains was assessed with a high or a moderate risk of bias. A study was judged with a low risk of bias in case all the six domains were rated with a low risk of bias.
Main analysis
We used standard inverse-variance random effects meta-analysis to estimate the pooled OR. An OR above 1 indicates that CS are more frequently performed in women with private insurance than in women with public insurance. We calculated the variance estimate τ2 as a measure of heterogeneity between studies.24 We prespecified a τ2 of 0.04 to represent low heterogeneity, 0.16 to represent moderate and 0.36 to represent high heterogeneity between studies.25 We conducted analyses stratified by study design, period of data collection, country, type of CS analysed, parity, inclusion of women with previous CS, pregnancy risk of included women and QUIPS risk of bias to investigate potential reasons for between-study heterogeneity and used χ2 tests to calculate p values for interaction, or tests for linear trends in cases of more than two ordered strata. All p values are two sided.
Sensitivity analyses
Five studies26–30 were excluded from the main analysis, as they had an overlapping population with a larger study31 that was included. For this reason, we repeated all analyses including these five studies26–30 while excluding the larger one.31 Finally, we visually inspected a funnel plot of adjusted ORs against their SEs to address potential small study effects.32 We used STATA, V.13, for all analyses.
Patient involvement
No patients were involved in this study. We used data from published papers only.
Results
We identified a total of 1490 records with our search strategy (figure 1): 935 from MEDLINE; 494 from Embase; 38 from the Cochrane Library; and 23 from manual search. After removing duplicates, we screened 1264 records for eligibility, and we retained 166 for full-text examination. We excluded another 124 that did not report insurance status of women, 23 that were otherwise irrelevant and 1 study that had an overlapping population. Finally, 18 articles describing 21 separate studies in 12.9 million women were included in review and meta-analysis.

The flow diagram of review.
Characteristics of studies are presented in table 1 and online supplementary appendices 1–3. Sixteen studies were cross-sectional; five were retrospective cohort studies. Only one study used surveys, 18 hospital records, seven birth registries and one census data. All studies were published in English. Most studies were from the USA. Nineteen studies included the entire population of eligible cases, while only two studies selected cases randomly. Case exclusion criteria varied considerably: one study excluded women aged 14 years and younger; three excluded multiparas; eight excluded women with previous CS; eight excluded stillbirths and nine multiple births; six excluded cases with specific presentations of the fetus; six studies excluded preterm births; and 13 studies excluded cases due to provider characteristics. Two studies reported ORs of CS for which indication was established before labour (including CS on maternal request) only, 3 studies reported CS for which indication was established during labour and 16 studies reported ORs of any CS irrespective of indication. Seventeen studies adjusted for different characteristics as presented in online supplementary appendix 3. Quality assessment is presented in supplementary appendices 4 and 5. No studies were excluded due to quality assessment result. Five studies were rated with high risk of bias, 10 studies with moderate risk of bias and 6 studies with low risk of bias.
Supplementary file 1
Characteristics of included studies
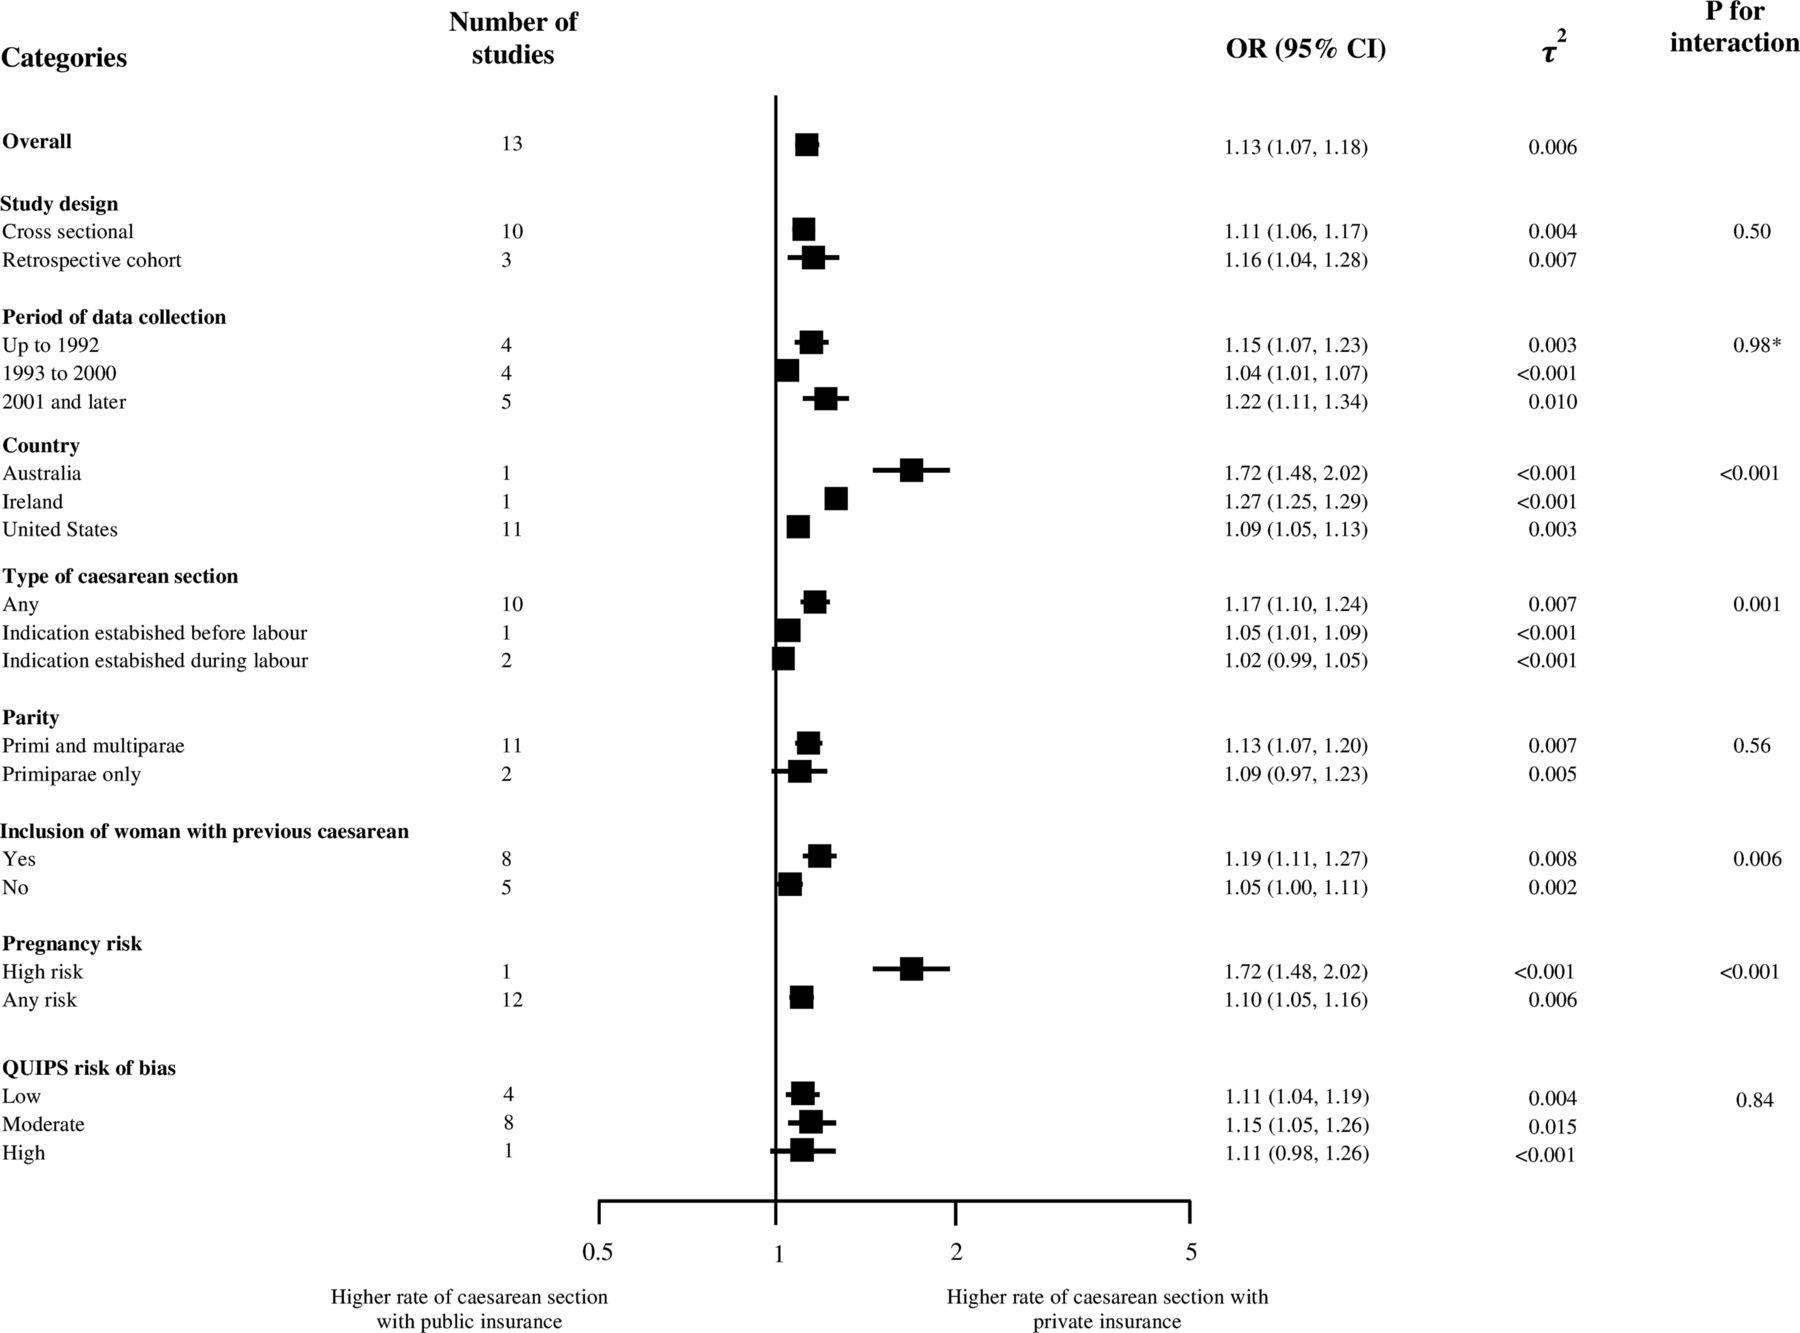
Figure 2 presents the meta-analysis of the 13 studies that reported adjusted ORs31 33–42; all of them using public insurance as the reference group. Overall, the odds of receiving CS were 1.13 higher for women with private insurance coverage as compared women with public health insurance coverage (95% CI 1.07 to 1.18), with no relevant heterogeneity between studies (τ2=0.006). Figure 3 presents results of stratified analyses of adjusted ORs. Estimates varied between strata, in particular for country (p for interaction <0.001), type of CS (p for interaction=0.001), inclusion of women with previous CS (p for interaction=0.006) and pregnancy risk (p for interaction <0.001). Online supplementary appendix 6 shows a funnel plot of adjusted ORs against their SEs on a log scale; there was no evidence for small study effects. Figure 4 presents the meta-analysis of crude ORs with a slightly stronger average association (pooled OR 1.35, 95% CI 1.27 to 1.44) and no relevant heterogeneity between studies (τ2=0.011). Online supplementary appendix 7 presents adjusted associations for different states in the USA. Adjusted estimates ranged from 0.96 in Maryland to 1.54 in New Jersey.
Supplementary file 6
Supplementary file 1

Adjusted OR of caesarean section.

Stratified analyses/legend: *p for trend. QUIPS, Quality In Prognostic Studies.

Crude OR of caesarean section.
Online supplementary appendices 8–10 report results from sensitivity analyses after inclusion of five smaller studies26–30 and exclusion of a larger study31 that had overlapping populations with the five smaller ones. Online supplementary appendix 8 shows the meta-analysis of the 16 studies26–29 33–42 with a pooled adjusted OR of 1.14 (95% CI 1.07 to 1.22) and no evidence for relevant heterogeneity between studies (τ2=0.015). Online supplementary appendix 9 presents results of stratified analyses, with estimates varying between countries (p for interaction <0.001), type of CS (p for interaction=0.007) and pregnancy risks (p for interaction <0.001). Finally, online supplementary appendix 10 presents the meta-analysis of crude ORs, again with a stronger association on average (pooled OR 1.33, 95% CI 1.25 to 1.41) and no relevant heterogeneity between studies (τ2=0.014).
Supplementary file 9
Supplementary file 10
Discussion
Our systematic review and meta-analysis estimated that the overall odds of receiving a CS are on average 1.13 times higher for privately insured women compared with women covered with public insurance. The increased risk was observed across all subgroups of studies in stratified analyses as well as in sensitivity analysis.
Context
To our knowledge, this is the first meta-analysis to examine the association of CS rates with types of insurance. A recently published meta-analysis found that the odds of delivery by CS was 1.41 higher in for-profit hospitals as compared with non-profit hospitals (95% CI 1.24 to 1.60).22 These findings were confirmed across subgroups (ie, such as country, year or study design) of studies in stratified analyses, indicating financial incentives may play an important role in such outcome.22 We found three other recent meta-analyses that summarised CS studies and found a strong association with obesity,43 sub-Saharan Africa ethnic origin44 and labour induction.45 Our estimates of a 13% increase are on the lower end of the strength of associations found in earlier studies.
Strengths and limitations
The major strengths of our meta-analysis include a broad literature search (online supplementary appendix 10), screening and data extraction performed in duplicate, an exploration of study characteristics as a potential source of variation between studies, sensitivity analyses involving studies that required exclusion due to overlapping populations and firm quality assessment using QUIPS tool. Major limitations are differences in the characteristics of the study populations, type of data used, types of CS analysed and variables used for adjustment in statistical analyses across studies. Unadjusted estimates of associations were larger, which suggests the presence of confounding, and we cannot completely rule out residual confounding in adjusted estimates.
Supplementary file 11
Mechanisms
Existing evidence suggests that possible causes for higher odds of CS in women insured privately lie in the differences in payment for CS and reimbursement arrangements among insurers as well as providers’ responses to these arrangements. In the countries included in our analysis, private health insurers generally reimburse hospitals at higher fees for providing a CS compared with the public insurers.36 This incentive is heightened when public insurance funds hospital care through a budget (eg, Australia and Ireland) rather than fee-for-service, which is common in private insurance.46 47 Similar incentives are present in physician payment.
Multiple studies have shown that hospitals are motivated by and responsive to financial incentives,22 34 48 49 although Grant36 argues that their impact is small. One example is the financial benefit associated with longer hospital stays associated with CS.48 50 Hospitals may incentivise physicians48 49 to align their clinical decision with institutional strategies, such as patient-scheduling policies that steer patients with private insurance to more profit-prone physicians.48 49 Physicians are known to be motivated by higher fees paid for CS as compared with vaginal delivery.48 They often act as self-interested economic agents according to economic models of physician behaviour, by maximising income and convenience.34 Physicians are also in a position to exploit asymmetry of information between them and patients,51 52 which leads to recommendations that are not always aligned with patient needs or preferences.15 There is also evidence that physicians with higher numbers of privately insured patients will tend to perform more CS34 36; explanations include perceptions that patients with private insurance have a higher social class, or more prevalent concerns about malpractice liability in patients with private insurance.53
Comparing ‘public insurance’ and ‘private insurance’ across countries is not a straightforward exercise as the meaning of such distinction can vary substantially across countries. In the USA, ‘public insurance’ is insurance assigned to specific categories of population (by age, disability, poverty or military service) and ‘private insurance’ is insurance mainly organised through employment. In general, private insurance offers higher reimbursement rates for surgical procedures, and this may incentivise CS. The heterogeneity of adjusted estimates across states in the USA (online supplementary appendix 7) points to setting specific factors that will influence the effect of insurance on the odds of CS and are worth of further investigation. According to Burns et al, the lacking association in Arizona (OR=1.02) may be due to equal magnitudes of reimbursements of hospitals for vaginal birth and CS.34 In Maryland (OR=0.96), the state administration introduced HealthChoice Program in 1997, which was intended to provide prevention-oriented healthcare services, enact better accountability measures for managed care organisations and ensure efficient use of financial resources.38 This programme introduced a mandatory managed care system for Medicaid beneficiaries, which replaced a fee-for-service model. This resulted in more patients receiving managed care irrespective of their insurance status and, in turn, use of similar policies in patients with public and private insurance.38 We are unaware of plausible explanations for the lack of associations observed in Michigan (OR 1.01) and Ohio (OR 1.00). This analysis shows that variation in CS rates among insurers within the USA can be explained by differences in reimbursement arrangements nested within public and private insurance.
For the other two countries, Ireland and Australia, included in the adjusted analysis, ‘private health insurance’ status differs in character from the USA but offers similarly higher payment levels for procedures. In Australia, women of childbearing age with private insurance would have increased the use of private obstetricians, leading to higher rates of CS.54 In Ireland, the financial incentives in private insurance are similar and are associated with striking inequities in care.55
Policy and research implications
Increases in the cost of care and hospital charges have become central issues in policy discussion in the USA and elsewhere.15 56 While the public healthcare costs are reaching unsustainable levels, hospital charges can have alarming effects on patients.56 In addition, the potential negative clinical effects of CS on mothers and newborns have raised concerns among clinicians, academics and policymakers alike.15
Recent studies and their media coverage and associated increase in public awareness of high CS rates and changes in reimbursement policy have led to recent decreases of CS rates.18 Our study provides additional evidence to support policy and advocacy efforts that address escalating CS rates, in particular their association with financial incentives. Effective policy measures often require context-specific, country-specific or state-specific policy analyses investigating particular insurance schemes. These setting-specific analyses are essential as incentives and reimbursement arrangements within health insurance schemes may differ across healthcare systems. We recognise that while categories ‘public insurance’ and ‘private insurance’ are useful markers of higher reimbursement rates, other aspects of insurance reimbursement may also influence the odds of CS.
As we analyse CS rates relation with health insurance schemes, we need also to be aware of the complexity of interaction of different determinants and their influence in CS rates. The published literature has identified a number of determinants of CS rates that operate at different levels of healthcare systems (macro, meso and micro).15 At the macro level of national health systems, operate factors such as health financing system, social and political context, legal regulations, general cultural and social norms and similar. At the meso level are hospitals and healthcare facilities. Their ownership status, availability of resources and size are known to influence CS rates.15 22 Finally, at the micro level, we have clinical units that provide care, medical staff and patients, which are characterised with all sorts of features that can influence the decision for CS. For example, clinical unit staff composition, or physician education, gender and experience, or mother’s preference, age and race, are all known to determine the rates of CS.15
Conclusion
This systematic review and meta-analysis indicates that CS are more likely to be performed in privately insured women as compared with women with public health insurance coverage. Although this effect is small and variable across strata, it is present in all performed analysis. Review of setting-specific payment levels and reimbursement arrangements within health insurance schemes will enable a better understanding of influencing factors. Efforts to address payment levels for delivery procedures and reform of reimbursement arrangements may lead to a reduction of CS rates to more appropriate levels.18 22 38 57
Supplementary file 2
Supplementary file 3
Supplementary file 4
Supplementary file 5
Supplementary file 8
Acknowledgments
We thank Doris Kopp and Beatrice Minder for her valuable help during development andexecution of search strategy, Andre Busato and Xhyljeta Luta for support in study design anddata extraction and Dr. Karmit Zysman for editorial contribution.
References
Footnotes
Contributors IH, LS, DCG and PJ conceived and designed the study. IH, LS and MB performed the data extraction and preparation. IH, LS, BRdC and PJ analysed the data. IH, DCG and PJ wrote the paper, which was critically reviewed and approved by all authors. All authors had full access to all of the data (including statistical reports and tables) in the study and take responsibility for the integrity of the data and the accuracy of the data analysis.
Competing interests None declared.
Provenance and peer review Not commissioned; externally peer reviewed.
Data sharing statement No additional unpublished data are available from the study.