Article Text

Abstract
Objectives In the care of patients with type 2 diabetes, self-management is emphasised and studied while theory and observations suggest that patients also benefit from social support. We sought to assess the effect of social network interventions on social support, glycaemic control and quality of life in patients with type 2 diabetes.
Research design and methods We searched Ovid MEDLINE, Ovid EBM Reviews, Cochrane Central Register of Controlled Trials, EMBASE, PsycINFO and CINAHL through April 2017 for randomised clinical trials (RCTs) of social network interventions in patients with type 2 diabetes. Reviewers working independently and in duplicate assessed eligibility and risk of bias, and extracted data from eligible RCTs. We pooled estimates using inverse variance random effects meta-analysis.
Results We found 19 eligible RCTs enrolling 2319 participants. Social network interventions were commonly based on individual behaviour change rather than social or interpersonal theories of self-management, were educational, and sought to engage social network members for their knowledge and experience. Interventions improved social support (0.74 SD (95% CI 0.32 to 1.15), I2=89%, 8 RCTs) and haemoglobin A1c at 3 months (−0.25 percentage points (95% CI −0.40 to -0.11), I2=12%, 9 RCTs), but not quality of life.
Conclusions Despite a compelling theoretical base, researchers have only minimally studied the value of interventions targeting patients’ social networks on diabetes care. Although the body of evidence to date is limited, and based on individual behaviour change theories, the results are promising. This review challenges the scientific community to design and test theory-based interventions that go beyond self-management approaches to focus on the largely untapped potential of social networks to improve diabetes care.
PROSPERO registration CRD42016036117.
- General Diabetes
- Public Health
This is an Open Access article distributed in accordance with the Creative Commons Attribution Non Commercial (CC BY-NC 4.0) license, which permits others to distribute, remix, adapt, build upon this work non-commercially, and license their derivative works on different terms, provided the original work is properly cited and the use is non-commercial. See: http://creativecommons.org/licenses/by-nc/4.0/
Statistics from Altmetric.com
Strengths and limitations of this study
This systematic review and meta-analysis was strengthened by a thorough literature search, author contact, reproducible judgements about the inclusion and appraisal of the evidence and theory-based discussion of its results.
The review found and summarised few reports of randomised trials testing interventions with poor theoretical alignment and limited protection against bias, which produced imprecise and inconsistent estimates of effect on markers of social support and short-term diabetes control.
These limitations notwithstanding, this first meta-analysis of randomised trials of social network interventions identified an important knowledge (and practice) gap in the care of patients with type 2 diabetes, and produced a theoretical model connecting social network interventions with outcomes in these and other patients living with chronic conditions.
Introduction
Patients with type 2 diabetes implement self-management practices—self-testing, diet and activity regimens, medication administration—into their daily routines, along with frequent office visits for examination and laboratory testing to reduce the risk of complications of diabetes and its comorbidities. Patients must have sufficient capacity (resources, time and energy) to shoulder this workload.1 2 Without support or sufficient capacity, these delegations can overwhelm patients and contribute to burden of treatment which is associated with decreased adherence to medical recommendations and exhaustion with self-care.2
Patients do not enact the work of self-management in isolation. Rather, social relationships are often cited as essential to managing type 2 diabetes. Observational studies have repeatedly found that better social support is associated with effective diabetes self-management and better efficacy of self-management interventions.3 4 A recent metasynthesis identified the different mechanisms through which social networks can influence diabetes self-management by: (1) sharing knowledge and (2) facilitating access to resources, but only to the extent that patients can (3) engage and maintain productive relationships with network members (figure 1).5 Social networks may, therefore, mitigate (or exacerbate when dysfunctional) the workload patients must shoulder and impact diabetes care. Yet, social networks are not usually considered in the design and evaluation of chronic disease management interventions; self-management programmes have typically been based on theories individual behaviour change.6 7 The impact of interventions based on social theories and aimed at supporting social networks on the care and outcomes of patients with type 2 diabetes remains unknown.

Logic model of social self-management.
In this review, we summarise the literature evaluating interventions in randomised clinical trials (RCTs) that targeted friends, families and peers (social networks) of patients with type 2 diabetes. We describe the interventions, their theoretical underpinnings, how existing social networks are enrolled, and the efficacy of the interventions in terms of social support, quality of life and glycaemic control relative to interventions that did not target patients’ social networks.
Methods
Protocol and registration
This review adhered to the Preferred Reporting Items for Systematic Reviews and Meta-Analysis (PRISMA) Statement8 and has a registered protocol (PROSPERO registration: CRD42016036117).9
Eligibility criteria
We included RCTs testing interventions for type 2 diabetes management that involved patients’ social networks (families, friends, peers and communities) in any capacity. RCTs had to evaluate interventions targeting dyadic (eg, a spouse or friend) or community (ie, network of networks like neighbourhoods, families and churches) networks10 based on enduring social relationships likely to be involved in the patients’ lives over the long periods of time required for self-management.11 Thus, we excluded RCTs involving social relationships created for the trial, for example, RCTs testing interventions enrolling and training patients with type 2 diabetes to provide peer support to other participants using online communities.
Data sources and searches
A comprehensive electronic search of Ovid MEDLINE, Ovid EBM Reviews, Cochrane Central Register of Controlled Trials, EMBASE, PsycINFO and EBSCO CINAHL was performed from inception of each database through the second week of April 2017 to identify published studies and conference abstracts. Working with an experienced medical librarian (PJE), GS-B developed a sensitive search strategy to identify eligible RCTs. Previous qualitative studies in the field5 7 10 were used to identify relevant search terms such as descriptors of the constitution or properties of social networks (eg, social, couples, spouse, family and church) and terms related to relationships (eg, stigma and support). The full search strategy is available as online supplementary tab le S1. There were no restrictions by date of publication or language. Reference lists of included articles, reviews and qualitative syntheses on the topic were hand-searched to identify any potentially eligible studies that may have been missed by our electronic search strategy. An expert in the field (AR) reviewed the list of included studies for missed articles.
Supplementary file 1
Study selection
Three reviewers (GSB, RR-G and OJP), working independently, in pairs and in duplicate, considered the eligibility of titles and abstracts that resulted from the search after calibrating with 20 abstracts. As part of calibration, eligibility criteria were iterated for clarity and consistency while considering examples of pre-existing and made-for-the-trial social networks.
Reviewers, working independently and in duplicate, considered all available full-text reports for eligibility, obtained if at least one reviewer considered the abstract potentially eligible. Before full-text screening, the reviewers calibrated their judgements using 10 eligible reports. Reasons for exclusion were not mutually exclusive, therefore reviewers agreed to prioritise reasons for exclusion as follows: (1) inappropriate population, (2) unsuitable study design, (3) inappropriate intervention and (4) no outcomes of interest reported. After completion of full-text screening, chance-adjusted agreement was quantified using the kappa statistic,12 and disagreements resolved by discussion and consensus among the three reviewers. We subsequently searched MEDLINE with the first and last authors’ last names for protocols for other relevant publications (eg, pilots and results at different follow-up lengths) to obtain additional details about the included RCTs.
Data extraction and quality assessment
The three reviewers, calibrated using two reports, performed data extraction independently and in duplicate using a standardised form. Extracted data included a full description of study characteristics: design, setting where recruitment took place, participant eligibility criteria, conceptual frameworks justifying the interventions and of baseline participant characteristics. For each intervention, we sought details about who delivered the intervention, to whom (which members of the social network were involved), dose (duration and frequency of sessions, total contact time) and fidelity (monitoring of fidelity to the protocol and extent of participant attendance and reasons for non-attendance). We planned to extract the following outcomes: quality of life, social support, treatment burden, metabolic control and diabetes-related morbidity and mortality; no trials, however, reported diabetes-related morbidity and mortality as outcomes measures. Eligible trials reporting on at least one of these outcomes were included.
Due to the heterogeneity of included interventions and comparators, we used modified versions of previously published frameworks5 13 to describe the strategies used (eg, information and education or cognitive strategies). We also classified how the social network was incorporated into the intervention (figure 1): for (1) sharing information, to (2) facilitate accessing and mediating resources, or to (3) support productive relationships. After piloting this procedure with two RCTs, two reviewers classified the interventions using line-by-line coding of trial methods. Conflicts were resolved by consensus.
The three reviewers, independently and in duplicate, assessed each RCT’s risk of bias using the Cochrane tool,14 recognising the impossibility of blinding participants and interventionists (persons delivering the intervention, for example, physician, nurse educators) to intervention allocation.15 These could not be disregarded, however, because subjective and patient-reported outcomes were assessed. Publication bias could not be assessed statistically or graphically given the small number and inconsistency of included RCTs.16 The overall confidence in the results was rated using the Grading of Recommendations Assessment, Development and Evaluation (GRADE) approach.17 This approach assesses the confidence merited by the body of evidence based on the risk of bias of the individual studies, inconsistency in the results, indirectness, imprecision and other considerations.
Author contact
For all included RCTs, we asked the corresponding author via email to complete a table of missing data and risk of bias information. Non-responders received a second communication 2-weeks later. Six of 18 authors responded with complete or partial data; one author reported no longer having access to necessary data.
Data synthesis and analysis
We used Review Manager V.5.3 to conduct meta-analyses.18 When possible, we generated meta-analytic estimates of treatment effects using the inverse variance random effects model. When trials had more than one comparator to the intervention of interest, we chose the arm whose procedures most resembled usual care or no intervention, as this was the most common comparator for two-arm trials. Meta-analyses generated either a weighted mean difference (MD) expressed in usual units (eg, haemoglobin A1c; HbA1c) or a MD expressed in SD units, a common approach that enables pooling across different scales assessing the same construct (eg, quality of life). A standardised mean difference (SMD) of 0.5 SD or greater was considered important.19
To determine the impact of interventions on HbA1c, we pooled results at 3 months (represented by studies reporting results from 2 to 4 months of follow-up), 6 months (5–7 months of follow-up) or greater (>7 months of follow-up). Otherwise, values at longest follow-up were used for all outcomes. Missing measures of variability were imputed either from data reported at another time-point in the same trial and in the same arm (when available) or as the average SD observed across all RCTs. Inconsistency for each outcome not attributable to chance was assessed visually using forest plots and estimated using the I2 statistic. I2<25% reflected low inconsistency; I2>75% reflected high inconsistency.20
Modifications to the registered protocol
The included trials were heterogeneous in terms of length of follow-up. In addition to performing pooled analyses for HbA1c at 3, 6 and >7 months of follow-up, to increase the power and applicability of our analyses, we also pooled all measures of HbA1c at the longest follow-up reported.
Subgroup analyses
To understand inconsistency in results, we planned a few subgroup analyses on social support, HbA1c results and quality of life, but sparse data prevented the latter. We tested treatment interactions with risk of bias (low versus moderate or high), level of glycaemic control at baseline (mean baseline HbA1c>8%) and intervention features. Network subgroups were drawn by whether the target of the intervention was (1) a patient-selected or an investigator-selected (by protocol, eg, the patient’s spouse) social network member; (2) a member of the patient’s household or not as reported in the trial inclusion criteria; (if the social network member involved was a spouse, they were assumed to be household members) and (3) a dyadic network or a group of more than two people. We also tested subgroups based on whether the intervention was based on a specific underlying framework or not, and on the duration in contact minutes with the interventionist using a median split. For each analysis, we estimated the subgroup effect and conducted a test of interaction. Because most subgroup analyses were underpowered and exploratory, we did not adjust alpha levels for multiple comparisons.
Results
Study selection
Figure 2 demonstrates the study selection process. We found 1208 records (7 of which were identified through hand-search); 137 were identified as potentially eligible for inclusion after title and abstract screening. We reproducibly (k=0.73) included 19 trials; 17 patient-RCTs21–42 and two cluster-RCTs43 44; overall these trials enrolled 2319 participants.

Preferred Reporting Items for Systematic Reviews and Meta-Analysis flow chart. *reasons not mutually exclusive.
Study characteristics
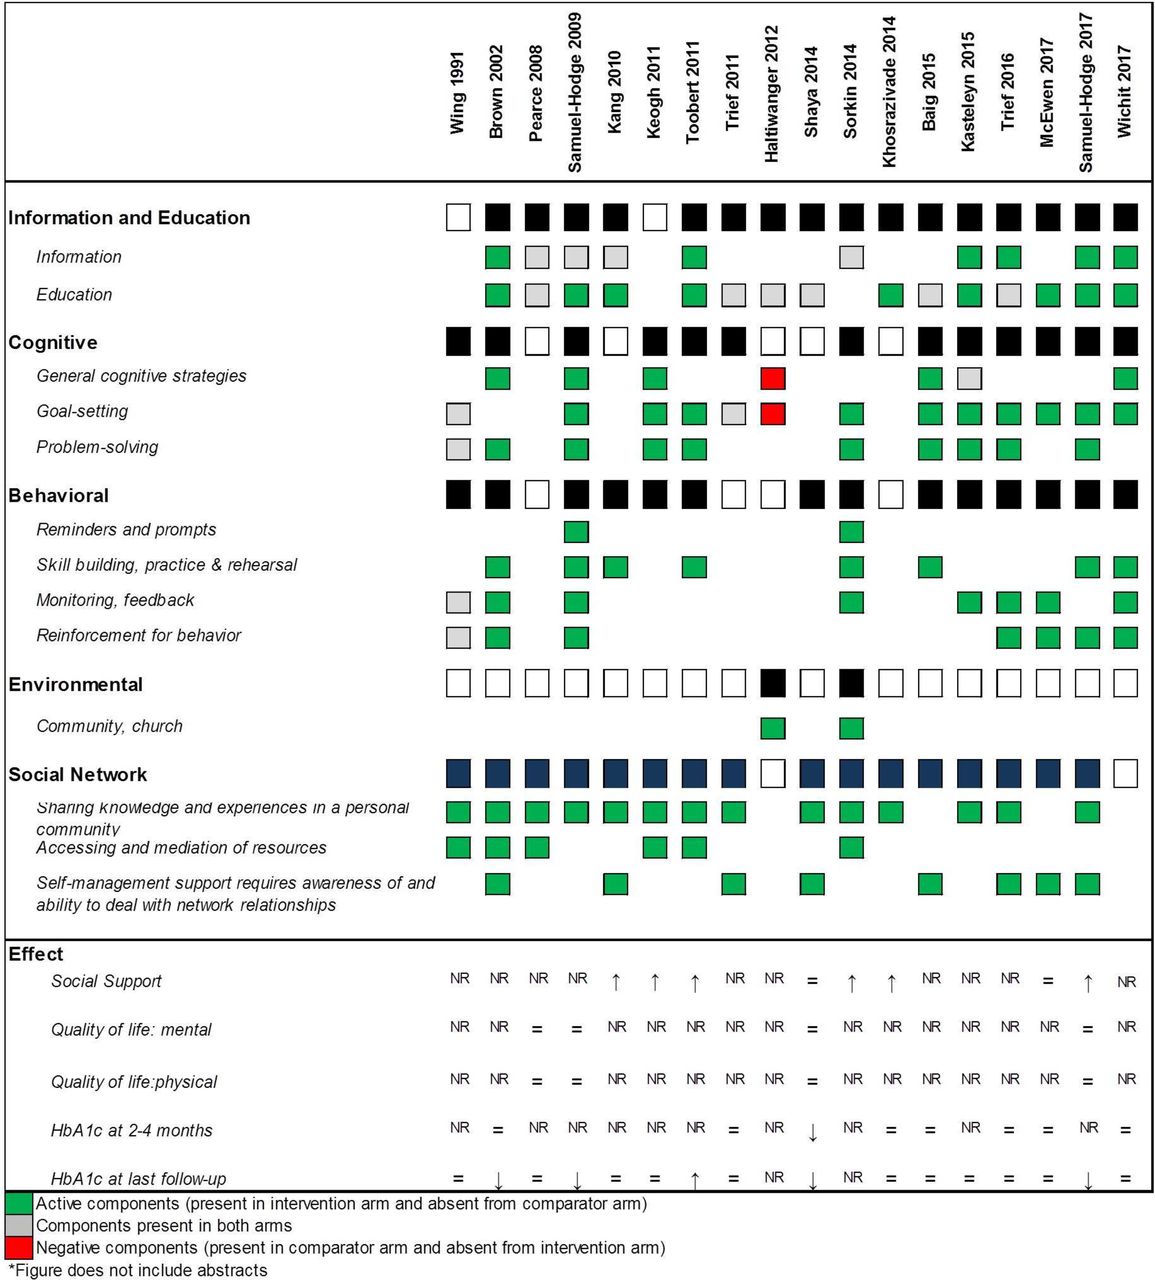
Table 1 describes these RCTs. Of the 19 RCTs, 13 reported an underlying framework for the intervention either in publication or after author contact.21 24 25 28 31 32 36 38–42 44 While variability in all study characteristics was the norm, most RCTs took place in the community, with the experimental intervention delivering education, information transfer, goal-setting and problem solving (figure 3, table 1). Social networks—family members, spouses or partners—were most commonly employed to share knowledge and experience (figure 3). Overall chance-adjusted agreement for classification of intervention and comparator procedures (figure 3) was good (kappa=0.79); comparators used in trials were heterogeneous. Online supplementary table S2 describes baseline characteristics of RCT participants. One RCT only enrolled patients with diabetes and a history of an acute coronary event;31 one required participants to also have uncontrolled hypertension,45 and another enrolled only patients that were overweight or obese.34 Two trials only enrolled women.26 29

Intervention and comparator components.
Trial and intervention characteristics
Risk of bias and confidence in the body of evidence
The overall risk of bias was judged to be moderate for all outcomes (online supplementary figure S1, table S3). Allocation concealment and blinding of outcome assessor were often unclear; some studies lost up to one-third of participants to follow-up. Outcome reporting was deemed complete for most trials. When considering the body of evidence, unexplained inconsistency in results across RCTs further reduced confidence in the overall results, particularly for the social support outcome.
Meta-analysis
Self-reported outcomes
After pooling the results from the eight RCTs reporting social support (986 total participants), we found a large increase in self-reported social support, SMD 0.74 (95% CI 0.32 to 1.15), with high inconsistency in results across trials (I2=89%) (figure 4). Inconsistency remained unexplained after subgroup analyses (online supplementary table S4).

Effect of social network interventions on social support, quality of life (QoL) and haemoglobin A1c (HbA1c).
Both well-being (measured with WHO546 and the 12-item well-being scale47) and self-rated health (measured with the SF-3648 and SF-1249 mental and physical score components) scales assessed quality of life. When pooled, neither well-being scales (two trials, 282 participants; SMD 0.62 (95% CI −0.13 to 1.37), I2=91%) nor the physical (four trials, 524 participants; SMD 0.06 (95% CI −0.11 to 0.23), I2=0%) and mental (four trials, 524 participants; SMD 0.01 (95% CI −0.18 to 0.20), I2=14%) self-rated health measures showed significant improvements (figure 4). One trial assessed the burden of treatment39 using the 17-item Diabetes Distress scale50 and found that the intervention group reported lower treatment burden than the comparator.
Biomedical outcomes
When pooled, the nine trials reporting HbA1c at 3 months, showed significant lowering (1081 participants; MD −0.25 (95% CI −0.40 to −0.11) with minimal inconsistency across trials (I2=12%). No significant differences in HbA1c were evident at 6 months (141 trials, 1504 participants; MD −0.24 (95% CI −0.52 to 0.03), I2=83%) (online supplementary figure S2), >7 months after baseline (three trials, 674 participants; MD −0.10 (95% CI −0.84 to 0.64), I2=99%) (online supplementary figure S3), or when considering the HbA1c available at the point of longest follow-up (17 trials, 2182 participants; MD −0.16 (95% CI, −0.32 to 0.00), I2=46%) with moderate to high inconsistency across trials at all time-points (figure 4).Subgroup analyses did not reveal important interactions (online supplementary table S4).
Discussion and conclusion
Discussion
Summary of findings
We uncovered a nascent body of evidence, small, sparse and heterogeneous, at moderate risk of bias, reporting favourable effects on social support and short-term HbA1c and no significant effect on quality of life of social network interventions in patients with type 2 diabetes. Only one trial evaluated treatment burden directly, and its findings are broadly consistent with our logic model (figure 1) suggesting benefit of interventions to promote social network support in patients with type 2 diabetes.
Comparisons with previous studies
To our knowledge, we provide the first meta-analysis of the effects of social network interventions in the management of type 2 diabetes. In concordance with the findings of a previous systematic review on social support in diabetes, studies were highly heterogeneous in their intervention components with limited details reported about these interventions.51 A recent metasynthesis of qualitative literature reports that some group-based initiatives use individual rather than social approaches.7 This is reflected in our findings; seven trials reported the underlying framework for their social network intervention to be based on single-person theories such as self-efficacy and self-regulation. Similarly, only one intervention employed all mechanisms of social network support identified in diabetes management (figure 3).
Strengths and limitations of this review
Our search strategy was designed to balance rigour with feasibility; thus, it may have missed reports which did not mention the social support component of the intervention in the title or abstract. We may have overestimated the risk of bias of these RCTs because of their unclear reporting of trial methods.52 This review reports on an evolving field and its limitations apply almost exclusively to the meta-analytical portion of the systematic review: trial methods and results are heterogeneous and therefore, may limit the usefulness of statistical pooling. We could not assess for publication bias; therefore our results could represent an overly sanguine view of the efficacy of social network interventions.
Conversely, our review has several strengths, including a thorough literature search and reproducible judgements about inclusion and intervention descriptions. Pooling was followed by a parsimonious set of exploratory prespecified subgroup analyses to explore inconsistency in results across RCTs. Overall, we are confident this report fairly represents the emerging body of evidence about interventions directed at social networks in support of patients with type 2 diabetes.
Implications for research and practice
Future research should clearly identify and report the explanatory frameworks, mechanisms and theories for the social network interventions being tested. Ideally, the theory should be social and explain the proposed impact of social network interventions on care and outcomes.
A recent meta-analysis reported decreased mortality in persons with higher social support.53 Studies in patients with diabetes54 and older adults55 have found social support to be predictive of morbidity and mortality, after adjusting for differences in health behaviours. Emerging literature also highlights network composition (type and number relationships rather than quality of relationships) as important for health and self-management.55 56
Proposed mechanisms for the protective effects include modulation of physiologic stress responses.57 58 Social networks can also affect diabetes self-management by impacting the workload patients must enact, by providing opportunities to share knowledge and by facilitating access to resources.5 In turn, access to these networks requires patients to work to be aware and to deal with network relationships.5 The effects on workload are likely to interact with the theory of physiological stress modulation, as access to healthcare and changes in self-efficacy affect psychosocial stress. This is especially pertinent for people with limited access to formal healthcare; they may be more likely to present to care with higher stress and to depend critically on personal social networks to respond.5 7 Therefore, the effects of involving social networks in diabetes management on intermediate outcomes such as allostatic load, treatment workload and treatment burden (assessed in only one included trial) should be tested in future RCTs along with health outcomes.
Although it may be premature to translate this evidence into practice, the preceding observational and qualitative research and the evolving experimental research summarised here suggest an important, but underexploited role for social networks in supporting the work patients do to manage type 2 diabetes. Care approaches enrolling social networks as mediators of knowledge and access to resources may prove more valuable than interventions supporting self-management alone. Such promise awaits further intervention development and evaluation.
Conclusion
Despite a compelling theoretical base, researchers have barely studied the value of interventions targeting patient social networks on diabetes care. The body of evidence to date is limited at moderate risk of bias, heterogeneous, with inconsistent results and based on individualistic theories. The results, however, are promising. This review challenges the scientific community to design and test theory-based interventions that go beyond self-management approaches to focus on the largely untapped potential of social networks to improve diabetes care.
References
Footnotes
Twitter @gabrielamabel12 @vmontori
Contributors GS-B, OJP, PJE, RR-G and VMM designed the protocol. GS-B and PJE searched the literature; GS-B, OJP and RR-G extracted the data. GS-B, NA-V and VMM analysed the data. GS-B, OJP, RR-G, NA-V, PJE, LL-M, AR and VMM interpreted the data and critically revised the report.
Funding GS-B was supported by CTSA grant number TL1TR000137 from the National Center for Advancing Translational Science (NCATS) and grant number 3R01HL131535-01S1 from the National Heart Lung and Blood Institute (NHLBI). VMM was partially supported by grant number UL1TR000135 from the National Center for Advancing Translational Science(NCATS), a component of the National Institutes of Health (NIH).
Disclaimer Its contents are solely the responsibility of the author and do not necessarily represent the official view of the NIH. The funder had no role in study design, data collection, data analysis, data interpretation or writing of the report.
Competing interests None declared.
Provenance and peer review Not commissioned; externally peer reviewed.
Data sharing statement Datasets used and/or analysed during the current study available from the corresponding author on reasonable request.