Article Text

Abstract
Objective This study estimated the potential loss of life and the lifetime cumulative risk of end-stage renal disease (ESRD) from live kidney donation.
Design Markov medical decision analysis.
Setting USA.
Participants 40-year-old live kidney donors of both sexes and black/white race.
Intervention Live donor nephrectomy.
Main outcome and measures Potential remaining life years lost, quality-adjusted life years (QALYs) lost and added lifetime cumulative risk of ESRD from donation.
Results Overall 0.532–0.884 remaining life years were lost from donating a kidney. This was equivalent to 1.20%–2.34% of remaining life years (or 0.76%–1.51% remaining QALYs). The risk was higher in male and black individuals. The study showed that 1%–5% of average-age current live kidney donors might develop ESRD as a result of nephrectomy. The added risk of ESRD resulted in a loss of only 0.126–0.344 remaining life years. Most of the loss of life was predicted to be associated with chronic kidney disease (CKD) not ESRD. Most events occurred 25 or more years after donation. Reducing the increased risk of death associated with CKD had a modest overall effect on the per cent loss of remaining life years (0.72%–1.9%) and QALYs (0.58%–1.33%). Smoking and obesity reduced life expectancy and increased overall lifetime risks of ESRD in non-donors. However the percentage loss of remaining life years from donation was not very different in those with or without these risk factors.
Conclusion Live kidney donation may reduce life expectancy by 0.5–1 year in most donors. The development of ESRD in donors may not be the only measure of risk as most of the predicted loss of life predates ESRD. The study identifies the potential importance of following donors and treating risk factors aggressively to prevent ESRD and to improve donor survival.
- nephrectomy
- live kidney donation
- end stage renal disease
- chronic kidney disease
This is an Open Access article distributed in accordance with the Creative Commons Attribution Non Commercial (CC BY-NC 4.0) license, which permits others to distribute, remix, adapt, build upon this work non-commercially, and license their derivative works on different terms, provided the original work is properly cited and the use is non-commercial. See: http://creativecommons.org/licenses/by-nc/4.0/
Statistics from Altmetric.com
Strengths and limitations of this study
The study projects the long-term risk of donating a kidney, including loss of life and the added risk of end-stage renal failure.
These findings help quantify and communicate risk to potential donors and convey the importance of lifelong follow-up in actual donors.
The study uses evidence of over 15 years of follow-up in actual live kidney donors and healthy controls.
The ability to predict lifetime outcomes from 15-year follow-up in donors of all ages and medical conditions is a limitation.
Introduction
Nearly 30 000 live donor kidney transplant surgeries are performed throughout the world each year.1 The benefits to the recipients are substantial in terms of improved life expectancy and quality of life compared with dialysis or deceased donor transplantation.2 The risks to the donors are generally felt to be small to modest, with a low postoperative mortality (approximately 3.1 deaths per 10 000 operations).3 4 The long-term risks are also presumed to be small especially in low-risk donors who are adequately screened. Recent reports however show that there is some increase in risk of end-stage renal disease (ESRD) from donation and possibly an increase in cardiovascular mortality.5 6 Patients who donate a kidney may be at greater risk of developing chronic kidney disease (CKD) as defined by a low glomerular filtration rate (GFR) of <60 mL/min/1.73 m2 or proteinuria.7 Furthermore, some donors will develop diabetes mellitus at a later date despite being screened and may be at higher risk of developing hypertension.8 9 These conditions could accelerate the loss of kidney function and increase the risk of ESRD. CKD is associated with an increase in risk of progression to ESRD and an increase in predialysis mortality.10
A recent report projected the 15-year and lifetime risk of ESRD in potential non-donors to assist in counselling patients who are considering donation.11 Those with minor medical abnormalities, men and individuals of black race had greater 15-year and lifetime risks of ESRD. Although this study also projected 15-year risks of ESRD in average donors, the effect on lifetime ESRD risk and reduced life expectancy was not calculated. Knowing the overall effect of donation on remaining life years and remaining quality-adjusted life years (QALYs) is important if risk is to be put into context with other behaviours and environmental exposures. Therefore, the objectives of this study were to estimate the potential loss of life as well as the added lifetime risk of ESRD in average-risk kidney donors.
Methods
Model description
A USA-based Markov model was used to examine the risk of ESRD in a population of non-donors and donors. The transition from the normal health state through other health states is shown in figure 1.

Markov model. CKD, chronic kidney disease; DM, diabetes mellitus; ESRD, end-stage renal disease; HTN, hypertension; P, proteinuria.
The following are the key assumptions for the model:
ESRD rates are increased in donors compared with non-donors.11
ESRD in both donors and non-donors will be associated with high mortality rates.
Donor and non-donors transition through a CKD state for at least 1 year before developing ESRD.
Since ESRD rates are increased in donors compared with non-donors, we assumed there must have been an increase in the rate of transition to and time spent in CKD states.
Nephrectomy in donors will quantitatively reduce overall patient kidney function. Given that kidney function declines over time in most individuals, donors will have a greater risk of falling below a GFR threshold of 60 mL/min/1.73 m2 compared with non-donors.
Cohorts are assumed to be free of hypertension, diabetes mellitus and proteinuria at donation. However they are at risk of developing these conditions whether they donate or not, and these will impact patient survival and loss of kidney function in both donors and non-donors. Given that some individuals may be at higher or lower risks of diabetes mellitus and proteinuria, smoke or are obese, we examined these in additional sensitivity analyses. Diabetes mellitus in non-donors would follow the same pattern (increasing rates with age) as in the general population even though absolute rates might be lower (if initially screened to be negative).
CKD states will be associated with higher mortality rates as in the general population, but the magnitude of this effect was examined in additional sensitivity analyses.
Model transition rates from normal to CKD states could be empirically derived (by working backwards) to reproduce observed 15-year cumulative incidence rates for ESRD in donors and non-donors and can be used to subsequently project lifetime cumulative risks of ESRD. CKD in non-donors would follow the same pattern (increasing rates with age) as in the general population but at overall lower rates.
A previously published model was updated to include current general population and ESRD vital statistics, and current cumulative risks of diabetes mellitus, CKD and ESRD from published sources12–15 (online supplementary material). The model was developed using TreeAge Pro 2015 (TreeAge Software, Williamstown, Massachusetts, USA). Given that this is a theoretical model that uses published population data, ethics approval was not required.
Patient involvement in study design
The study design, development and research question did not involve patient input, nor were outcomes informed by patient priorities. There was no patient recruitment or participation in this study but rather the study relied on prior published analyses.
Target population
The base case cohorts were 40-year-old patients of both sexes and white/black race from the USA. This is the mean age of live donors (median age 38) and for whom there are recent published estimates of 15-year cumulative risks of ESRD in non-donors and donors.5 11 16
Main outcome measures
The health outcome of interest was remaining years of life (undiscounted). Since quality of life is reduced in patients with ESRD and other related health states, and that these events are downstream, life years were scaled by measures of quality and discounted at a 3% rate of time preference to calculate QALYs. Lifetime cumulative incidence of ESRD was also calculated.
Intervention effects
Donors in the study underwent unilateral nephrectomy. It is assumed that the nephrectomy results in a loss of GFR, and this loss of function would increase the probability of transitioning from a normal (GFR ≥60 mL/min/1.73 m2) kidney function heath state to CKD.
Time horizon
The time horizon for remaining life years and QALYS was lifetime. However, for ESRD, the cumulative incidence was truncated at age 90 in keeping with other studies.11
Analysis, design and outcomes
All analyses compared outcomes of the same population of healthy potential donors and modelled the effects if all donated. Primary outcomes were the net difference in remaining life years, QALYs and development of ESRD. In addition we examined the loss of life attributed to ESRD by eliminating the ESRD health state in both donors and non-donors and assumed all remained in CKD until death. In the base case analysis, age, sex and black/white race annual transition rates for proteinuria, diabetes mellitus and hypertension were empirically derived from population studies assuming that donors were initially disease-free but could subsequently develop these conditions at rates seen in the general population. Transition rates from normal to CKD stage 3 and higher were derived from a previous study.14 The cycle length was 1 year. These rates were multiplied by an empirically derived coefficient that was lower in non-donors and higher in donors to reproduce the 15-year cumulative risk of ESRD in average-age non-donors and donors.11 Non-donors were assumed to have 15-year cumulative ESRD risks of 0.067%, 0.045%, 0.21% and 0.12% for white male, white female, black male and black female, respectively. Donors were assumed to have 15-year cumulative ESRD risks of 0.34%, 0.15%, 0.96% and 0.59% for white male, white female, black male and black female, respectively.
Uncertainty and sensitivity analyses
We assumed that many future risks that can impact on life expectancy and ESRD such as cancer, obesity, smoking and so on were not influenced by the act of kidney donation. The lifetime estimates of ESRD were found to be higher in non-donors than published estimates, in part since this model incorporated the possibility that some participants could develop diabetes mellitus and proteinuria.11 In a sensitivity analysis a lower risk ‘ideal’ cohort was examined. These ‘ideal’ non-donors were assigned lower incidence rates of diabetes mellitus, proteinuria and rates of transition to CKD to match projected lifetime ESRD risks11 rather than calibrating to 15-year ESRD risks. Non-donors were assumed to have lifetime cumulative ESRD risks of 0.43% (95% CI 0.19 to 0.58), 0.29% (95% CI 0.13 to 0.47), 1.00% (95% CI, 0.49 to 1.37) and 0.85% (95% CI, 0.37 to 1.35) for white male, white female, black male and black female, respectively.11 To evaluate a more conservative and more liberal estimate of remaining life years, lost life years postdonation, remaining QALYs and lost QALYS postdonation, we used higher and lower transition rates from normal to CKD states that correspond to the upper and lower bound of the 95% CI of the projected cumulative risk of ESRD from a study by Grams et al.11
Given that the increase in mortality associated with CKD is an important driver of life years lost, in a sensitivity analysis we assumed that the added time spent in isolated CKD (no proteinuria nor diabetes mellitus) in donors compared with non-donors was not associated with an increase in mortality. In other sensitivity analyses age at donation, smoking status, higher body mass index, new-onset diabetes mellitus and biological relationship to recipient were explored. A supplement is provided with additional details of the analysis.
Results
Baseline analysis
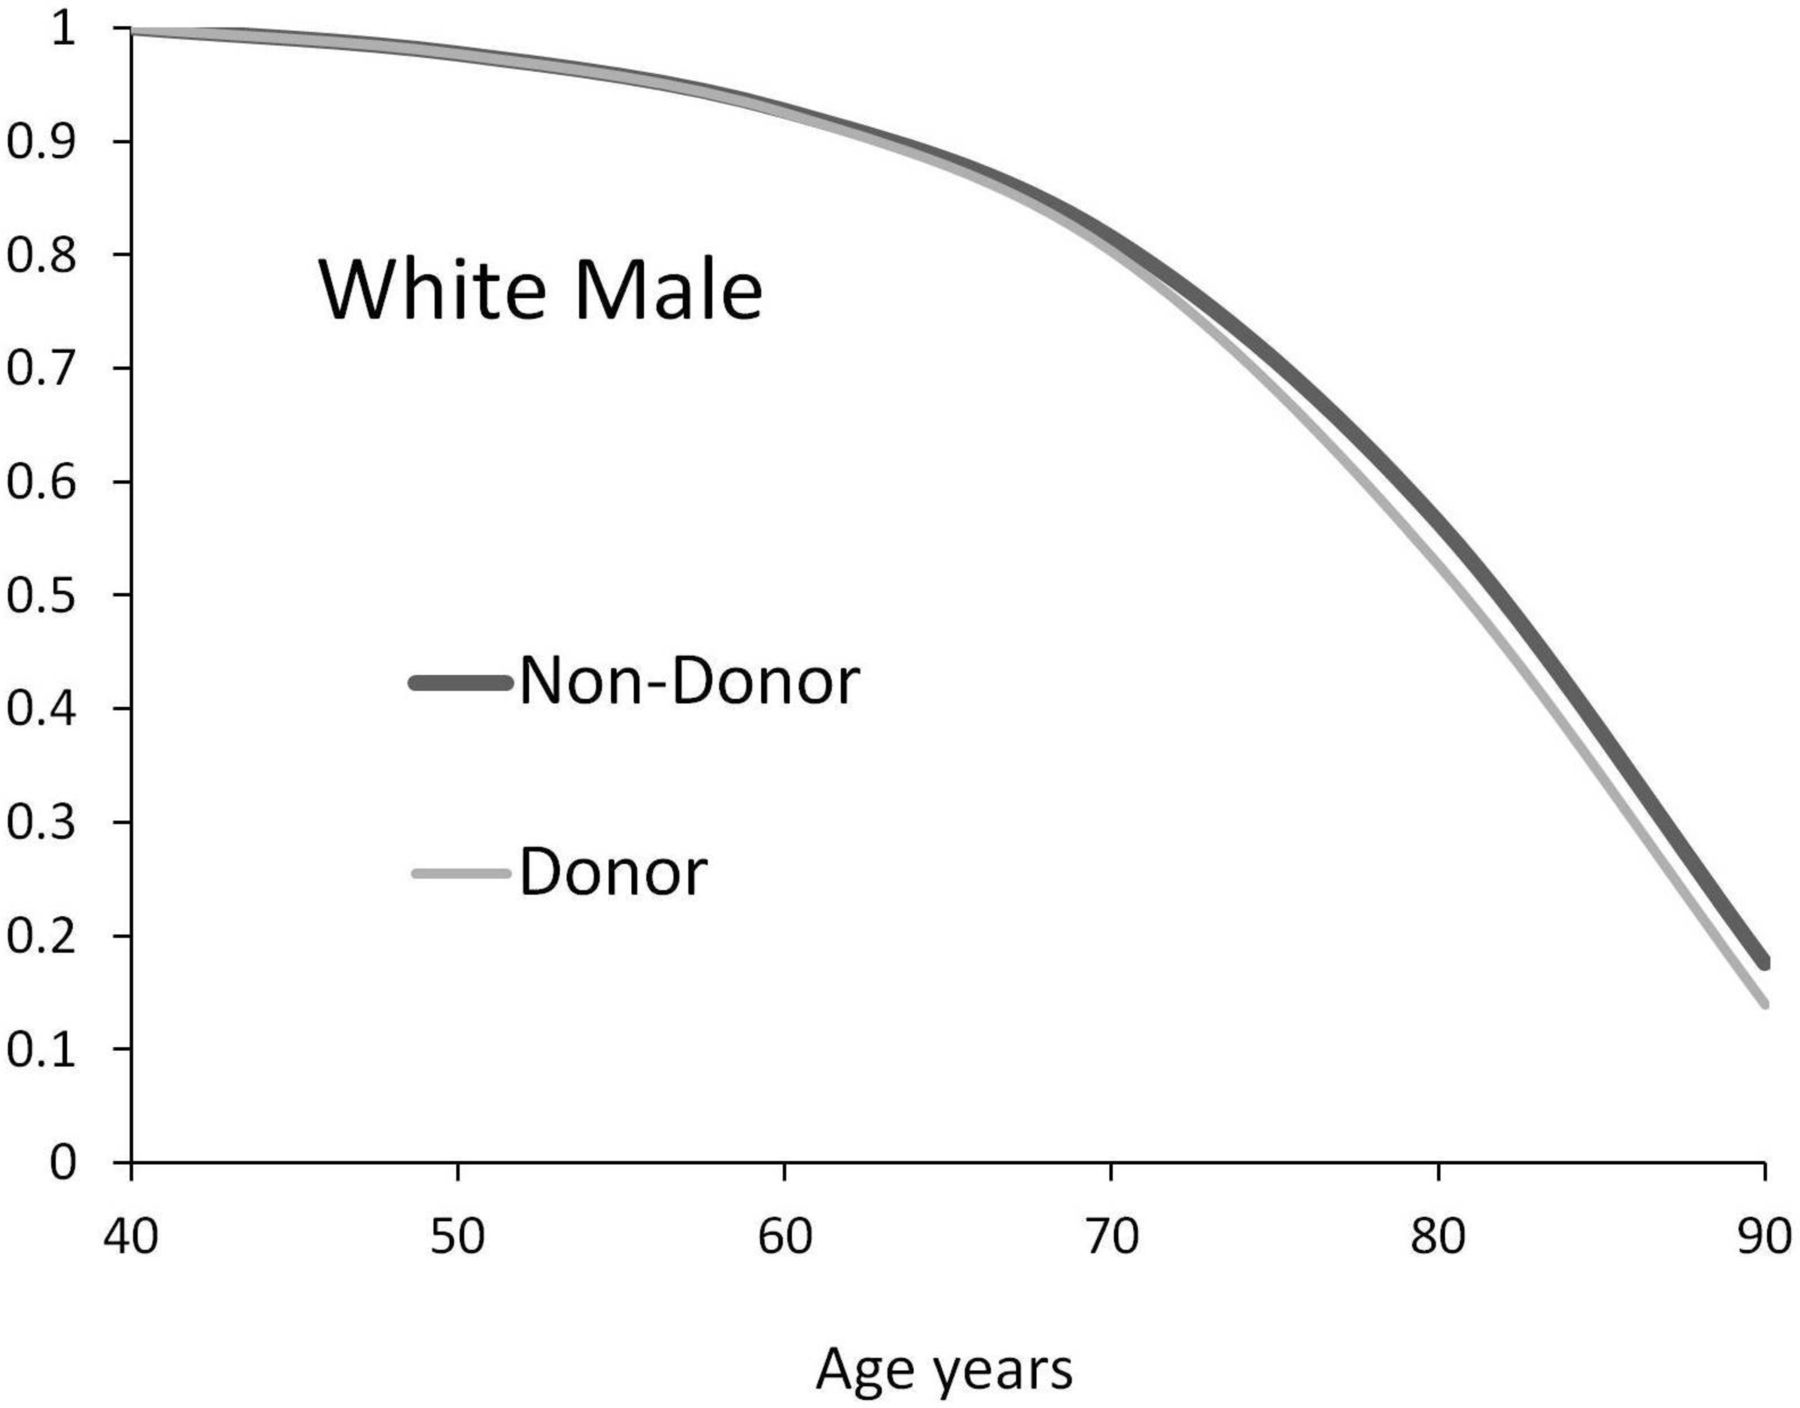
The projected survival of average-age donors and non-donors is shown in figures 2–5. Differences in survival between the cohorts became apparent after 20 years or more after donation. As shown in table 1, the remaining life years lost from donation ranged between 0.532 years for white female and 0.884 years for black female donors. The per cent loss of life was highest in black male donors. The per cent loss of life varied from 1.20% for white female to 2.34% for black male. The per cent loss of total QALYs varied from 0.76% for white female to 1.51% for black male.

Overall survival for donor and non-donor: average white male.
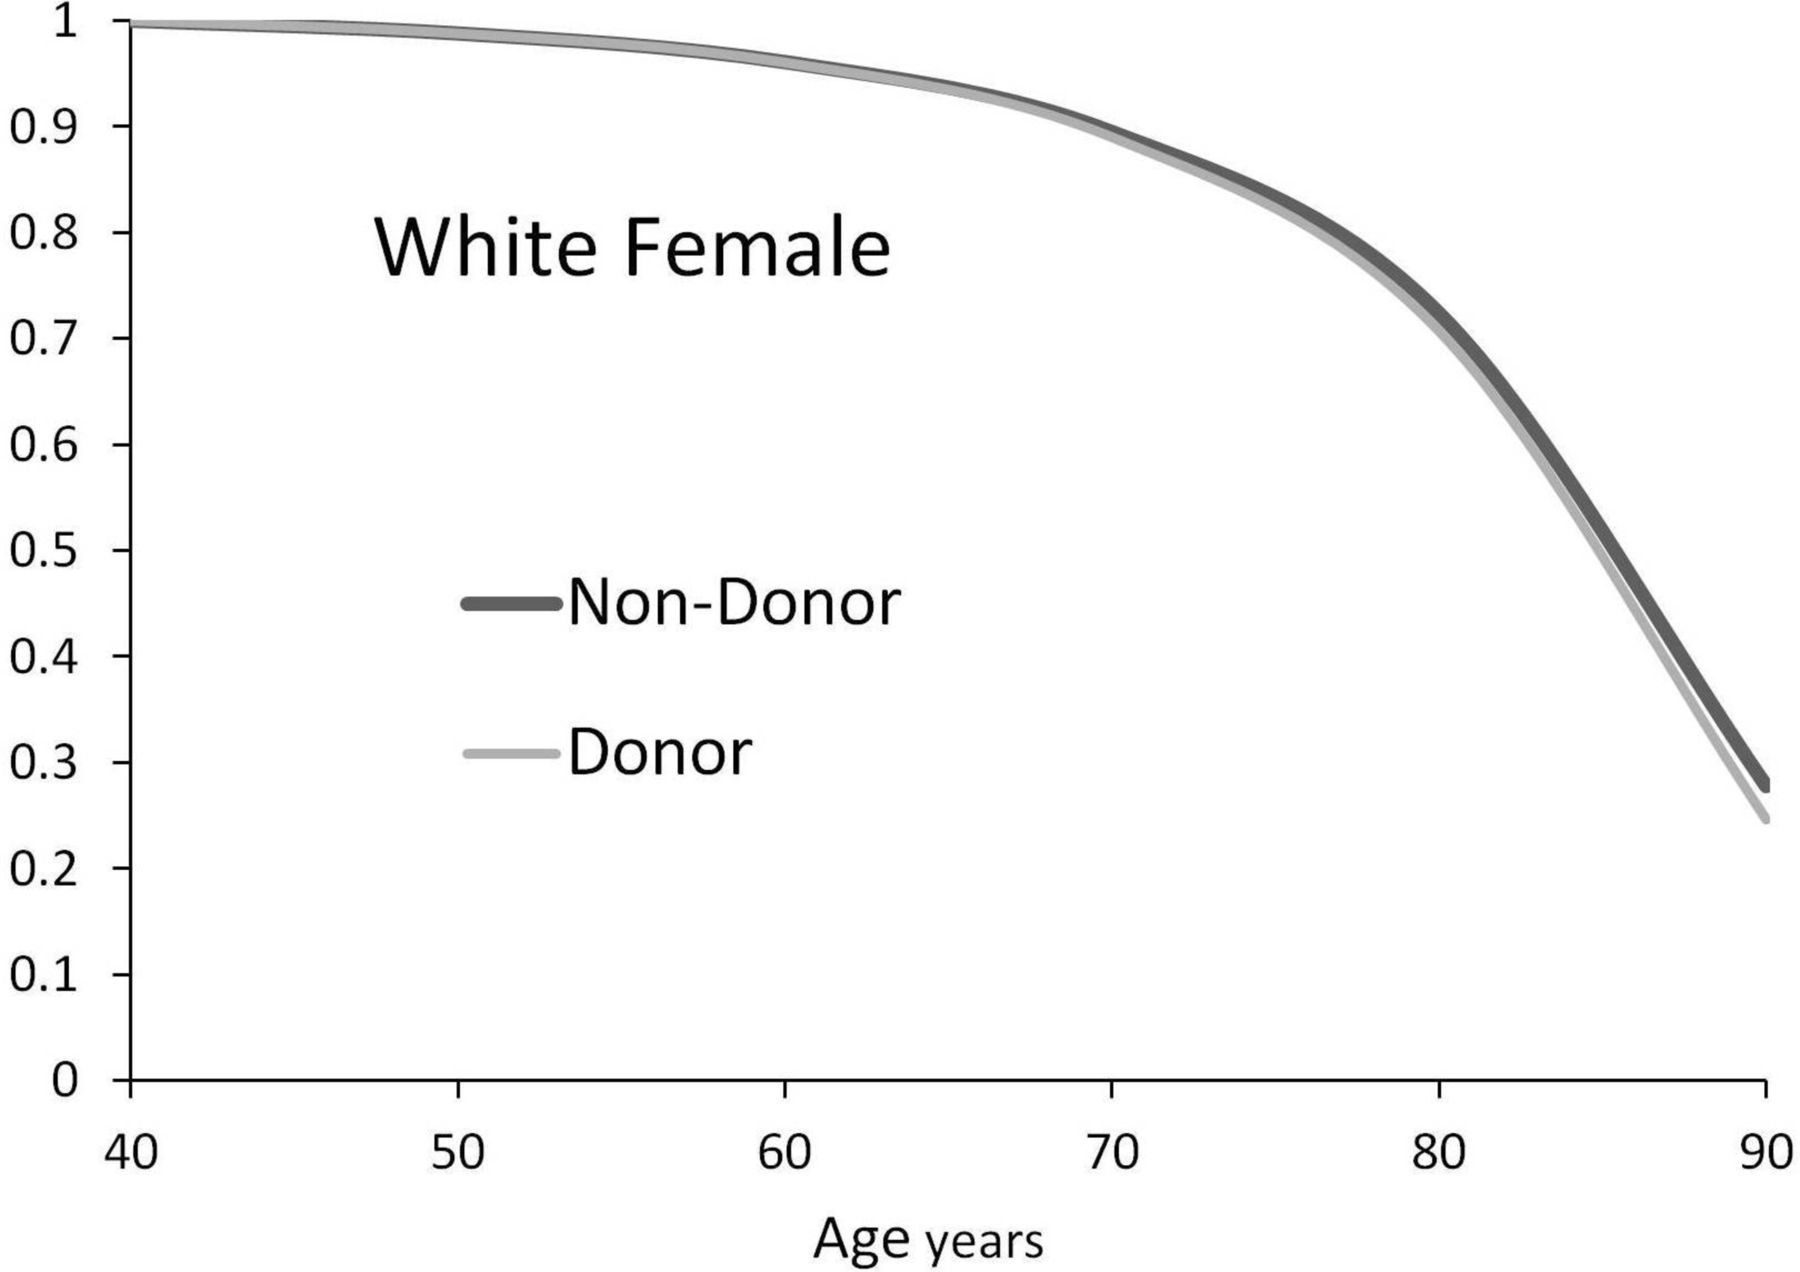
Overall survival for donor and non-donor: average white female.
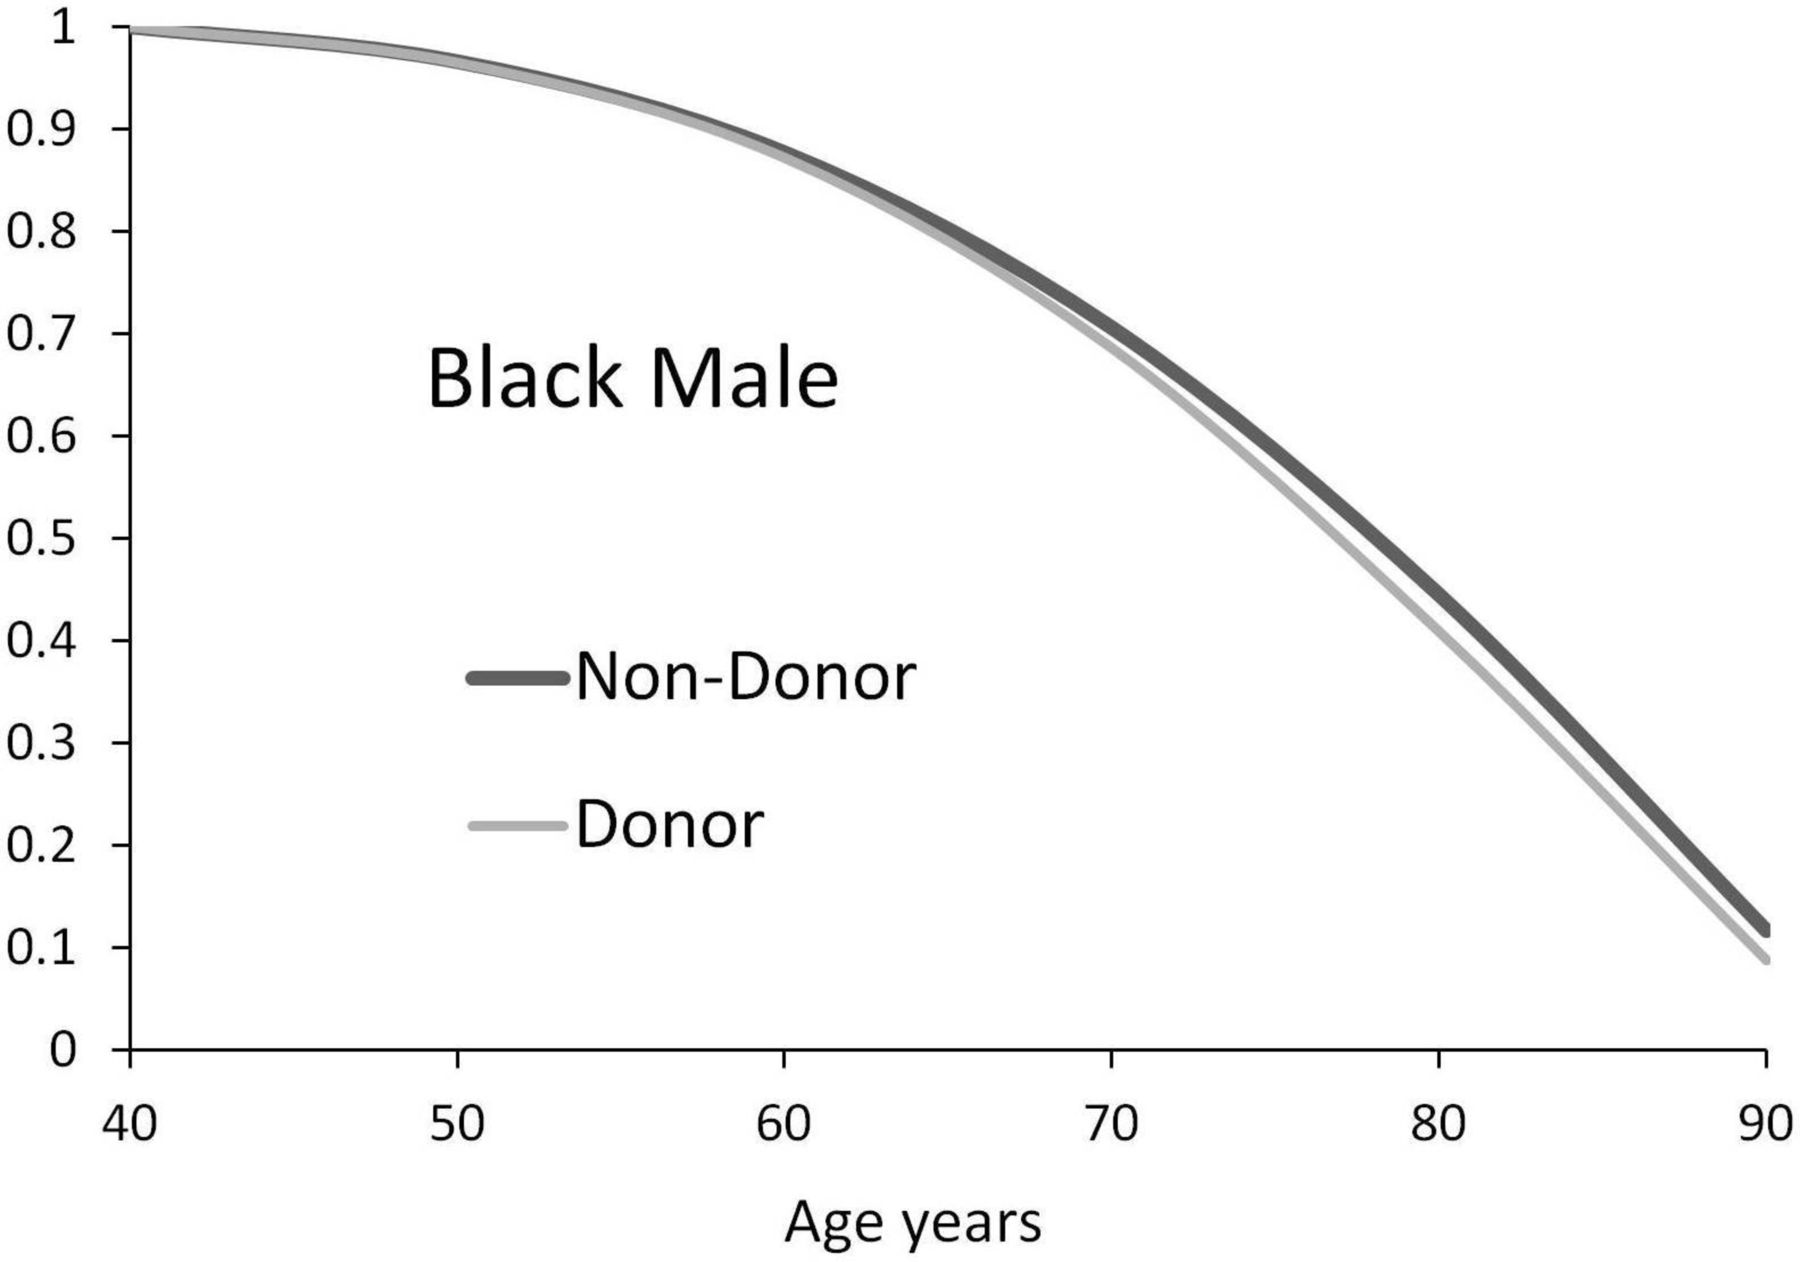
Overall survival for donor and non-donor: average black male.

Overall survival for donor and non-donor: average black female.
Net effect of donation on survival and ESRD in current donors assuming average future population risks
Live kidney donation was associated with an added risk of ESRD especially among those of male sex and black race. The added lifetime cumulative risk of ESRD varied from 1.135% in white female to 4.645% in black male (table 1). This translated to one added ESRD event for every 88 white female donors or one added ESRD event for every 22 black male donors. More than 50% of all ESRD events in donors occurred 25 years or more after donation. The added ESRD events tended to occur earlier in black male compared with white male. The per cent loss of life attributed to ESRD in relation to total remaining years of life varied between 0.29% for white female and 0.88% for black male (table 1).
In a sensitivity analysis, the added cumulative risks of developing ESRD were projected to be lower in the ‘ideal’ cohort especially for white male (1 in 63) and female (1 in 155) compared with the base case analysis (table 2). Despite differences in the absolute rates of ESRD in both donors and non-donors, the absolute and per cent loss of life years and QALYs from donation were only modestly lower compared with the base case analysis (table 1).
Sensitivity analysis: net effect of donation on survival and ESRD in 40-year-old ideal donors assuming reduced future population risks
Donors were projected to spend 50%–85% more time with an isolated low glomerular filtration rate CKD (CKD not associated with diabetes mellitus or proteinuria) compared with non-donors. Assuming the added proportion of time spent with isolated low glomerular filtration rate CKD had no increase in all-cause mortality rate, the loss of remaining life years was 0.551, 0.316, 0.682 and 0.721 for white male, white female, black male and black female, respectively. This corresponded to an overall per cent loss of remaining life years of 1.39%, 0.72%, 1.9% and 1.74% for white male, white female, black male and black female, respectively.
In a variety of subgroup analyses (table 3) younger patients lost more potential years of life and had potentially greater risks of ESRD given longer exposure to reduced kidney function. However on a percentage basis, loss of life was greater in older compared with younger donors. Life expectancies were markedly reduced and lifetime risks of ESRD increased for cohorts who were smokers or had diabetes mellitus. Obese patients were also at increased risk but less so compared with smokers and those with diabetes mellitus. Surprisingly the absolute loss of life years was slightly less in donors who were obese or smoked compared with donors without these conditions. Donors with diabetes mellitus suffered the greatest loss of life years and increased risk of ESRD. Non-biological relationship to the recipient was associated with much lower loss of life years and risk of ESRD compared with those who were biologically related.
Sensitivity analysis: effect of age, obesity, smoking, diabetes mellitus and biological relationship in an otherwise ideal non-donor on outcomes with and without donation
Discussion
Knowing the long-term risks associated with kidney donation is important to potential donors and their providers. The focus of existing studies has been on the increase in ESRD risk resulting from kidney donation. In this study we show that donation potentially shortens life in average-age donors by about 1%–2%. This analysis shows that short-term studies (<20 years) even with appropriate normal controls are not likely to detect an adverse effect on survival. Although ESRD is associated with very high mortality rates, a significant per cent of the loss of life was associated with CKD not ESRD. The study also explored risk factors that can be associated with higher rates of death and ESRD such as smoking, obesity and biological relationship to the recipient.
Death during the CKD health state accounted for most of the projected increase in mortality and reduction in QALYs. Intuitively this makes some sense given that the transition from CKD to ESRD can be over many years and that progressive kidney disease is associated with graded increases in mortality.10 The mechanism by which low glomerular filtration rate CKD is associated with an increase in cardiovascular and all-cause mortality rate is not completely known. Based on current literature it is unclear whether there is a significant risk of death from donation, but studies have had relatively small numbers, have lacked highly scrutinised controls and have only been of relatively short-term (<30 years) follow-up. Therefore an important mortality signal could have easily been missed.4 17 18 This is further highlighted in our study. The per cent of patients modelled to be alive at 20 years post nephrectomy for an average-age white male donor was only 0.2% lower than a non-donor (figure 2). Greater differences were seen later when the cumulative effects of CKD were more evident. It is possible that the lower glomerular filtration rate CKD as a result of donating a kidney in an ideal donor may well be different from CKD that is associated with proteinuria or diabetes mellitus. However, lower mortality risks associated with CKD were explored in the model and the results showed only a modest reduction in the percentage of total life years and QALYs projected to be lost. Although loss of life from CKD was higher compared with life lost from the ESRD health state, there were differences based on race and sex. About 78% of the loss of all QALYs from donation was associated with CKD in white female, whereas the loss was 58% in black male. Given these findings, risk factor detection (hypertension, diabetes mellitus and so on) and prompt intervention could help prevent ESRD and improve donor survival.
This model incorporated the probability that some donors will develop diabetes mellitus, hypertension and proteinuria at a later date, and these would impact on health (overall survival and progression to ESRD) as they do in the general population. The model could have been simplified if these risk factors for CKD and ESRD were not included in the model, but this would not reflect reality. Recent longer term observational studies have found that some donors develop diabetes mellitus and hypertension, despite being absent at the time of donation, and that these factors are subsequently responsible for ESRD.19 20 As a result, when adjusted to replicate 15-year follow cumulative ESRD rates non-donors, the model overestimated the lifetime ESRD predictions in non-donors based on results from a recently published study.11 This study also explored a healthier ‘ideal’ cohort with a reduced risk of developing diabetes mellitus, proteinuria or kidney function decline over time. Although the lifetime added risk of ESRD was lower, the overall predicted absolute loss of life was not very different.
The baseline analysis also showed that white males suffer greater added long-term ESRD risks from donation than would be anticipated. For white male the added risk of an ESRD event was 1 for every 28 donors. For black male the risk was 1 in 22. One would have expected the added risk of ESRD in white male to be less than half the added risk in black male from what is known in the general population.5 16 This risk appeared to accelerate in white male after 25–30 years of follow-up. Part of the increased risk is associated with longer life expectancies in white male. Another potential explanation is that criteria of acceptance of white male may be more lenient than black male, where the long-term impact of this practice may take several decades to fully appreciate. In the sensitivity analysis ‘ideal’ white male had much lower cumulative risks of ESRD; however, the absolute loss of life years and QALYS were not very different between the analyses.
The relationship between loss of remaining life years (and QALYs) and added risk of ESRD in donors is not straightforward. For example, although nearly 3.5% of white male donors are predicted to develop ESRD as a result of donation, only 0.094 QALYs or 0.43% of total remaining QALYS are lost as a result of ESRD. Calculating loss of remaining life years and QALYs helps put the risk of donation into context with other activities. The loss of life from live kidney donation is projected to be far less than smoking or mild obesity (table 3). Despite the higher initial perioperative mortality, live partial liver donation may be less risky over the long run compared with live kidney donation. Live liver donation is reported to have a perioperative death rate of 1.7 deaths per 1000 operations, but no long-term consequences.21 In comparison, live kidney donation is much lower at 0.31 in 1000.4 Despite a higher postoperative mortality with partial live liver donation, kidney donation results in more loss of life when adding in the long-term impact. A recent study calculating the benefits of colorectal cancer screening found that screening saved 244–270 years of life per 1000 people screened (0.244–0.27 years of life saved per person) depending on the method used.22 This analysis would suggest the life years lost from donation are greater than the life years gained from colorectal cancer screening in an average-risk person. It is important to point out that the overall loss of life is averaged over the entire population. There will be some patients who develop ESRD who are relatively young, and these will have large reductions in the remaining life years compared with those who develop ESRD at a later age and those who never develop ESRD.
Ideally a prediction equation could be developed as was recently published for the incidence of ESRD in non-donors with differing baseline characteristics.11 However it was not the purpose or ability of this study to give a precise estimate of lifetime ESRD for individual donors with multiple conditions. The analysis shows that younger donors have greater added risks of ESRD and potential life years lost; however, the percentage loss of life was somewhat less compared with older cohorts. The effect of smoking and diabetes mellitus had large effects on overall survival and in lifetime risks of ESRD in donors and non-donors. The effects were less in obese donors compared with donors who were smoking or had diabetes mellitus. The incremental effects with donation in subjects with and without obesity and smoking varied slightly by sex and race but overall were not very different (table 3). The analysis suggests that counselling and interventions to reduce weight and smoking cessation are more important to both donor and non-donor and less of an argument to deny donation. Having a non-biological relationship to the recipient was associated with lower risks; however, the majority of donors are related.5 Donors with diabetes mellitus were at very high added risks of ESRD and death. It is interesting to point out that a 40-year-old white female with diabetes mellitus, who is otherwise well, has about the same added risk of ESRD and percentage loss of life years as a current ideal 40-year-old black male donor.
There are limitations to modelling future events. We rely on the observed rates of ESRD over 15 years in actual donors and a theoretical matched cohort to calculate lifetime outcomes.11 Life expectancy and the cumulative incidences of diabetes mellitus and ESRD are increasing. Using historic mortality and disease incidence rates to make accurate future lifetime projections is a significant limitation; however, similar modelling studies are used to inform current practice.22 The study was an analysis of US donors, whereas the non-donor control population included US and international populations. The results may not be generalised to live kidney donors from other countries where population ESRD rates are much lower.6 There are many variables and transition rates included in this model and addressing uncertainty in each or combinations of variables would require a much longer paper. The key uncertainties explored were the cumulative risks of developing ESRD and the increased mortality associated with CKD states. Lower risks of developing diabetes mellitus and proteinuria were also explored in ideal donors.
The model did not include multiple stages of CKD. A more complex model could have been generated to differential stages 3a, 3b, 4 and 5 multiplied by three levels of proteinuria. However this would complicate the model and we do not have enough patient-level data to examine this in detail. Adding these states would be the ‘ideal’ and would be a suitable project at a later date once the information becomes available. Since donors eventually have a greater risk of entering into a more advanced CKD state, this analysis may have underestimated the overall net loss of life years from nephrectomy. We also used a uniform cohort of 40-year-old individuals in the baseline analysis, whereas the information available is from a cohort of donors with a wide range of ages.11 Although the numbers vary by race/sex, age and uncertainty in the relative mortality risks associated with CKD, the overall estimates of life loss associated with donation are between 0.5 and 1 year. There however appear to be some paradoxes in the analysis. As noted the absolute loss of life was higher in younger donors but a greater percentage of loss of life in older donors. These result from a fixed relative risk of death associated with CKD multiplied by low baseline death rates in the young compared with higher death rates in older subjects along with differences in exposure. The risks of death associated with CKD may be less in older adults.23 However incorporating a lower relative risk of death associated with CKD at older ages did not change the results significantly (see online supplementary material). The absolute loss of life years was less in obese and smoking donors than in otherwise ideal donors largely because the overall remaining life years were much shorter in donors with these risks. We do not have data on family history of ESRD in the non-biological-related donors. There may be some non-biological-related donors with a family history of kidney disease, which would put them at higher risk. In addition we assumed that the relative risks between white and black of both sexes with a biological relationship were the same.
More information is required before we can truly estimate the impact of live kidney donation. Given the need for large numbers of patients and controls and long term follow-up, this risk may never be accurately measured for all age, race, sex and those with minor medical abnormalities. Given the above, estimating lifetime ESRD rates in non-donors may not be the best or only metric to inform the risk of donation.11 Greater efforts to put risk into context for potential donors in the face of uncertainty for any one individual donor. Asking donors whether they may be willing to give up between 0.5 and 1 year of life may be a better way to convey risk than giving them an estimate of their lifetime risk of ESRD. In addition the study identifies the potential importance of following donors and treating risk factors aggressively to prevent ESRD and to improve donor survival. Acknowledging that many of these risk factors develop years after donation, short-term follow-up of kidney donors may be inadequate. Given that obesity and smoking are risk factors that might develop after donation, encouraging a healthy lifestyle at donor evaluation and postdonation is also important.
References
Footnotes
Contributors BAK is the guarantor of the study. BAK affirms that the manuscript is an honest, accurate and transparent account of the study. Both BK and KKT were involved with the study design, assigning data inputs, sensitivity analyses, writing and final approval of the paper.
Competing interests None declared.
Provenance and peer review Not commissioned; externally peer reviewed.
Data sharing statement The data are incorporated in TreeAge software program. Those interested would need this program.