Article Text

Abstract
Objective The aim of this study was to analyse the changes in new certifications for both sight impairment (SI) and severe sight impairment (SSI, blindness) in Wales due to diabetic retinopathy (DR)/maculopathy between 2007 and 2015.
Research design and methods This is a retrospective analysis of annual data of new certifications for visual impairment and blindness (Certificate of Vision Impairment) for England and Wales derived from the national database provided by the Certifications Office, Moorfields Eye Hospital, over a period of 8 years from 2007.
Results In Wales there were 339 less new certifications for both SI and severe SSI from any cause combined from 2007–2008 to 2014–2015. The number SI and SSI combined specifically due to DR was reduced by 22 in people with known diabetes. This was a reduction in new certifications over the observation period from 82.4 to 46.9 per 100 000 (−43.1%) with a fall in SSI from 31.3 to 15.8 per 100 000 (−49.4%), respectively. During this observation period however, there was a parallel increase in 52 229 (39.8%) persons with diabetes in Wales.
Conclusions While acknowledging the limitations of the certification process and the increasing numbers of persons with diabetes, the incidence of SI and SSI per 100 000 population of persons with diabetes in Wales has almost halved over an 8-year period up to 2015. This may reflect the earlier diagnosis of DR and sight-threatening DR since the introduction of screening and/or improved diabetes management with timely onward referral and newer treatments.
- diabetic retinopathy
- medical ophthalmology
This is an Open Access article distributed in accordance with the Creative Commons Attribution Non Commercial (CC BY-NC 4.0) license, which permits others to distribute, remix, adapt, build upon this work non-commercially, and license their derivative works on different terms, provided the original work is properly cited and the use is non-commercial. See: http://creativecommons.org/licenses/by-nc/4.0/
Statistics from Altmetric.com
Strengths and limitations of this study
A key limitation of our analysis is a consequence of the non-compulsory and inconsistent process of reporting/certification of visual loss (sight impairment and severe sight impairment) which currently requires a consultant ophthalmologist to complete a Certificate of Vision Impairment (CVI or CVI-W) rather than being population based compounded by the reluctance of patients to be registered as visually impaired/blind.
The strength of our study relates to its nationwide coverage, unified data base, providing important epidemiological information on the trends in new certification of visual impairment due to diabetic retinopathy (DR) as the main cause, in Wales, over an 8-year period.
An additional strength of this study is that the time period it covers is when a nationwide screening programme was introduced to reduce severe sight impairment (blindness) by the early detection and treatment of sight-threatening DR and second, raise awareness to the presence of DR when enhanced medical management can prevent progression.
Introduction
In 2015, an estimated 415 million people worldwide had diabetes mellitus, with diabetic retinopathy (DR) among its most feared complications capable of causing visual impairment and blindness.1 Therefore, the predicted global increase in diabetes prevalence to 642 million by 2040 is of considerable public health concern due to its adverse effect on both the individual concerned and society in general.2–4 Previously, in 2012 a pooled meta-analysis was carried out including 35 studies worldwide involving people with diabetes where DR was determined from retinal photographs estimated that 34.6% had evidence of any DR and with 10.2% having vision threatening DR.5 The prevalence of any DR in the Welsh population during 2005–2009 was 32.4% with 29% non-sight-threatening DR and 3.4% sight-threatening DR.6 The increasing prevalence of diabetes is acknowledged to represent a major public health problem worldwide and DR is among the most feared complications, leading to sight impairment (SI) and severe sight impairment (SSI) if not detected and treated at an early stage, and is therefore prioritised on the global public health agenda.7 8 The societal costs of SI due to DR are significant and include severe reduction in quality of life, loss of productivity and increased healthcare costs.2 4 9
In its ‘Action plan for the prevention of avoidable blindness and visual impairment; 2009–2012’ the WHO has highlighted the importance of recording SI and SSI, in an attempt to monitor the impact of various strategies to eliminate preventable SI and SSI globally.8 Recording the number of people who are SSI in England and Wales was initiated in 1851, and between 1930 and 2003 a designated certificate (BD8) was employed which required the signature of an ophthalmologist with the cause of low vision included from 1950 onwards.10–15 The BD8 was superseded in 2005 by the Certificate of Vision Impairment (CVI) for England and later in 2007 its equivalent for Wales (CVI-W) which are crown copyright under the ownership of the government. A copy of the CVI is sent to the Certification Office, London, for anonymised epidemiological analysis and which is funded by the Royal National Institute for the Blind operating under the governance of the Royal College of Ophthalmologists. Since 2012, despite their limitation, certification numbers have been used in an attempt to indicate the burden of preventable sight loss and which are included in the Public Health Outcomes Framework by the Department of Health, UK Government. Between 1999 and 2000 the major causes of SSI in working aged adults (between 16 and 64 years) in England and Wales were DR/maculopathy (17.7%), hereditary retinal diseases (15.8%) and optic atrophy (10.1%).16 17 However, in a more recent analysis for 2009–2010 the order of the three main causes of SSI had changed to hereditary retinal disorders (20.2%), DR/maculopathy (14.4%) and optic atrophy (14.1%).18 DR was therefore, for the first time in five decades, no longer the leading cause of certifiable SSI in England and Wales, a most encouraging trend from a public health standpoint.
In Wales a screening programme for DR was launched in 2003 and by the end of 2006 all persons known to have diabetes in Wales, aged 12 years or over, and under the care of general practice located within Wales had been offered an appointment for screening. Therefore, the time period covered in this analysis corresponds with the time when screening was provided on a national basis implementing standardised quality assured methods to include photography and grading. This retrospective analysis was conducted in order to address whether the introduction of Diabetic Eye Screening in Wales (DESW) has had any impact on the level of certification for SI and SSI in Wales between 2007 and 2015 by virtue of the earlier detection of DR and its subsequent management.
Methods
Numerator
The numerator included the causes of new CVI-W of both SI and SSI for Wales that were sourced from the Certifications Office at Moorfields Eye Hospital, London. Details of data entry and transmission using the BD8 certificate causes of blindness recorded by ophthalmologists and CVI forms have been reported previously.18 19 All patients provided explicit consent for certification and for anonymised data to be sent to the Certifications Office. The number of new certifications of SI and SSI due to diabetic eye disease (retinopathy/maculopathy) included those cases where the main cause of certifiable SI or SSI was DR/maculopathy and those where the main cause was recorded as multiple conditions but a contributory cause was diabetic eye disease. To be certified as SSI, sight assessed using the Snellen chart, while wearing any glasses or contact lenses, will fall into the following categories: visual acuity (V/A) of less than 3/60 with a full visual field, or V/A between 3/60 and 6/60 with a severe reduction of field of vision, such as tunnel vision, or V/A of 6/60 or above but with a very reduced field of vision, especially if a lot of sight is missing in the lower part of the field. A definition of SI requires the sight to fall into one of the following categories, while wearing any glasses or contact lenses, a V/A of 3/60 to 6/60 with a full field of vision, or V/A of up to 6/24 with a moderate reduction of field of vision or with a central part of vision that is cloudy or blurry, or V/A of 6/18 or even better if a large part of the field of vision, a whole half of the vision, is missing or a lot of the peripheral vision is missing. Certification for SI or SSI is decided upon by a consultant ophthalmologist. Incidence data were provided for SI and SSI for each year running from April 2007 to March 2015 derived from the certifications for SI and SSI covering a 2-year period.
Denominator
Annual population estimates for Wales were obtained from the Office of National Statistics and were based on the midyear estimates. Between 2007 and 2010 the estimates were adjusted to bring them into line with the official mid-2011 population estimates published in 2013.20 The number of persons with diabetes in Wales is recorded annually by the Quality and outcomes Framework (QoF) in primary care.21 QoF is a voluntary reward and incentive programme which aims to standardise improvement in the delivery of primary medical services. The estimate for the population with diabetes for the last period of the certification timescale was used as the denominator.
Statistical analysis
The incidence of visual impairment (SI and SSI) due to any cause in Wales was calculated using the total number of new certifications and the population estimates for each yearly time period between 2007 and 2015. In addition, the incidence of SI and SSI related to DR was calculated using the QoF estimates of people with known diabetes in Wales. The results are represented as the combined total (SI plus SSI), SI and SSI individually when due to either any cause or DR in the population of Wales. The percentage change in the incidence of new certifications for SI and SSI due to any cause or DR during each of the eight annual observation periods was also calculated.
Results
Between 2007−2008 and 2014–2015 in Wales there was an overall reduction in new certifications for SI and SSI combined from any cause of 339, that is, from 1582 to 1243, equivalent to 12.2 per 100 000 of the population representing a decrease of 21.4% over the 8-year observation period (table 1). The new certifications for SI fell by 24.2% from 26.9 (95% CI 25.1 to 28.8) per 100 000 population in 2007–2008 to 20.4 (95% CI 18.8 to 22.0) per 100 000 in 2014–2015. For both parameters, a temporary and unexplainable increase was seen between 2008 and 2009 after which there was a reduction year on year for the remainder of the study period. However, new certifications for SSI have fluctuated over the observation period with a peak at 2008–2009 of 25.6 (95% CI 23.8 to 27.4) per 100 000 population followed by a lesser peak during 2011–2012 before reaching a nadir of 18.3 (95% CI 16.9 to 19.9) per 100 000 during the final year compared with 22.5 (95% CI 20.9 to 24.3) per 100 000 during the initial year period of 2007–2008.
Number of new certifications for combined (total), SI and SSI due to any cause in the population of Wales 2007–2015
The number of new certifications for SI and SSI combined in Wales due to DR during 2007–2008 increased from 108 to a peak of 140 certifications during 2008–2009. Thereafter, the numbers fell to 86 certifications during 2014–2015, a reduction of 20.4% from the initial period of 2007–2008 (table 2). Similarly, there was a temporary increase in both SI and SSI during the second annual period of observation with SI certifications thereafter falling consistently from 89 to 51 during 2014–2015 a reduction of 42.7% and SSI falling from 51 to 29 certificates being a fall of 43.1% over the remaining 7 years of the study. The overall reduction in SI and SSI combined, SI and SSI for the entire study period from 2007–2008 to 2014–2015 was 22.2%, 23.8% and 35.7%, respectively. For the population of Wales the initial rate of new certifications in 2007–2008 for SI and SSI combined, SI and SSI was 3.6 (95% CI 3.0 to 4.3), 2.1 (95% CI 1.7 to 2.7) and 1.4 (95% CI 1.0 to 1.8) per 100 000, respectively, followed by slight increase in the second year to 4.6 (95% CI 3.9 to 5.4), 2.9 (95% CI 2.4 to 3.6) and 1.7 (95% CI 1.3 to 2.2) per 100 000, respectively, and then a general trend downwards to the lowest rate of 2.8 (95% CI 2.2 to 3.4), 1.6 (95% CI 1.3 to 2.2) and 0.9 (95% CI 0.7 to 1.3) per 100 000, respectively, seen during 2014–2015.
New certifications for SI and SSI due to DR in the population of Wales 2007–2015
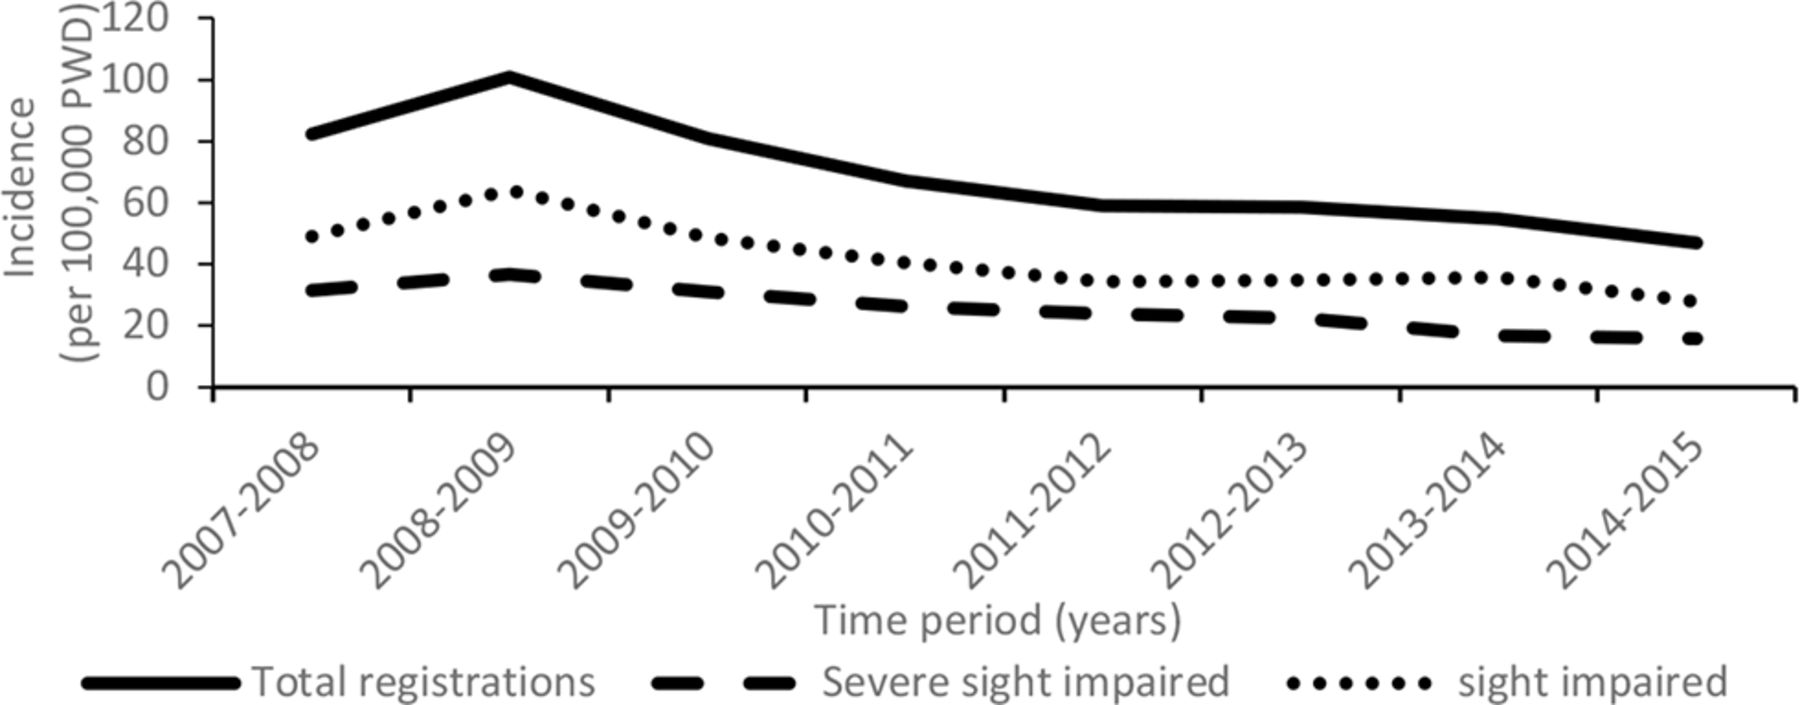
Over the 8-year observation period the number of persons known with diabetes in Wales increased by 52 229 from 131 119 in 2007–2008 to 183 348 in 2014–2015 (table 3) representing an increase in the prevalence of diabetes in Wales from 4.3% in 2007–2008 to 5.9% in 2014–2015. During this time, there was an increase in the rate of new certifications for SI and SSI combined, SI and SSI from the first to the second year (2007–2008 to 2008–2009) from 82.4 (95% CI 68.2 to 99.4), 48.8 (95% CI 38.2 to 62.3) and 31.3 (95% CI 23.1 to 42.4) to 100.7 (95% CI 85.4 to 118.8), 64.5 (95% CI 52.0 to 78.8) and 36.7 (95% CI 27.9 to 48.2), respectively, per 100 000 persons with diabetes. Thereafter, the rate fell to 46.9 (95% CI 38.0 to 57.9), 27.8 (95% CI 21.2 to 36.6) and 15.8 (95% CI 11.0 to 22.7), respectively, per 100 000 diabetic population a reduction of 53.4%, 56.9% and 56.9%, respectively, by 2014–2015. The overall reduction over the entire 8-year study for new certifications in persons with diabetes for SI and SSI combined, SI and SSI was 43.1%, 43.0% and 49.5%, respectively (figure 1).
New certifications for SI and SSI due to diabetic retinopathy in those persons with known diabetes in Wales between 2007 and 2015: n (per 100 000 population)
Total visual impairment certifications and incidence of sight and severe sight impairment due to diabetic retinopathy in Wales (per 100 000 PWD). PWD, people with diabetes.
Discussion
This analysis of new certifications for SI and SSI in Wales from 2007–2008 to 2014–2015 provides information on the changes that occurred over the 8-year observation period due to any cause and specifically DR. Between 2007 and 2015, the number of new certifications for SI and SSI due to DR fell by 23.8% and 35.7%, respectively, although there was a slight increase in the second year in SI and a smaller increase in SSI during the fifth year. In the context of the rising number of persons with diabetes (~40%) during the same period of time, the proportion of persons with diabetes certified as SI and SSI combined, SI or SSI alone almost halved between 2007–2008 and 2014–2015 at 43.1%, 43.0% and 49.5%, respectively. It is acknowledged that a more prolonged period of observation prior to 2007 would have been most helpful in ascertaining the meaningfulness of this important trend in lowering of new certification rates for visual impairment in Wales since the introduction of a national DR screening service for Wales.
Currently there are a limited number of reports on the number of new certifications for SI and SSI due to DR/maculopathy. For those that do exist it is difficult to compare findings due to different methods for certifications and definitions of SI and SSI. However, recently it was reported that in Ireland there were 33 new certifications including both SI and SSI due to DR in 2007 decreasing to 29 in 2013 which equates to almost halving the risk in persons with diabetes from 45.9 per 100 000 in 2007 to 26.4 per 100 000 in 2013,22 which is lower than seen in our population with diabetes in Wales. It is noteworthy that in Ireland prior to the establishment of a national DR screening programme in 2013, DR screening was performed on a limited basis by local services using different models of service provision and the analysis restricted to the 18–69 years of age population. Earlier, in Fife, Scotland, the incidence of blindness due to diabetic eye disease during 1990–1999 was reported to be 64 per 100 000 population/year with diabetes.23 During the following decade between 2000 and 2009 the incidence of blindness in Scotland fell by a mean of 10.6% per year from 59.7 to 23.9 per 100 000 in the diabetes population,24 which is slightly lower than the 30.8 per 100 000 seen in our population in 2009–2010. The Scottish national screening programme for DR was implemented in 2006 mid-way during our study period. A comparison of the causes of new SSI certifications in England and Wales in working age adults (16–64 years) between 1999–2000 and 2009–2010 reported a reduction due to DR from 17.7% to 14.4% as the main cause and from 17.9% to 16.2% with DR as a main or contributory cause.18
In our study, there are a number of possible explanations as to why the number of new certifications of SI and SSI due to DR fell during the 8-year period of observation between 2007–2008 and 2014–2015. Screening for DR was introduced in Wales in 2003,25 26 along with the parallel availability of new treatments for management of both diabetes and sight-threatening DR and maculopathy.27–30 In addition, an increase in the population with diabetes during this period will also contribute to this observation due to the greater awareness of diabetes and changes in diagnostic criteria. To date, relatively few studies have reported a reduction in the prevalence of sight-threatening DR mainly referring to persons with type 1 diabetes,31–33 again suggesting the possible benefit of recent changes in the management of diabetes. In addition, a systematic review of 28 studies noted that participants involved from 1986 onwards had a lower proportion of proliferative DR and severe vision loss at 2.6% and 3.2%, respectively, compared with 1985 and before at 19.5% and 9.7%, respectively.31 These studies suggest that the reduction in sight-threatening DR could possibly be due to improved diabetes and/or ophthalmological care. In our experience in Wales, the number of people referred by the DESW to the hospital eye services with sight-threatening DR for ophthalmological review fell from 3.4% in 2007 to 2.0% in 2015.34 There has also been a decrease in the volume of certifications in England and Wales especially of partially sighted people and also there is evidence to suggest an inappropriate SSI certification rate of approximately 20%, due to a variety of reasons.35 36 Implementation of the national DR screening service will have resulted in a reduction in SSI as a result of the earlier referral and treatment of sight-threatening DR by the hospital eye services. In addition, providing awareness of the presence of DR to primary care indicates the need for reviewing diabetes management in order to prevent progression of non-sight-threatening DR. It would be difficult to say if one or any one of these changes were primarily responsible for the observed decrease as it is more likely to be a combination of these elements.
Using certifications to study rates of SI is justified on the grounds of coverage and the collection of uniform data fields and working definitions of visual impairment both partially sighted and blindness. However, there are major limitations which are well described by others14–16 acknowledging the fact that certification is hospital and not population based which requires the patient to access hospital-based services in order to be seen and certified by a consultant ophthalmologist. A substantial proportion of visually impaired persons (approximately 50%) remains uncertified and certification is deemed inappropriate in approximately 23%.15 32 34 Patient and healthcare professional knowledge and attitude relating to certification for visual impairment can also have a negative impact. Understandably, the offer of certification can be distressing for patients and they may therefore need time to come to terms with this realisation as well as understanding the important benefits certification may bring.17 Ophthalmologists can be uncertain as to when to offer certification, which results in unnecessary delay between the diagnosis of certifiable sight loss and the offer of certification with a bias towards SSI, permanent, non-treatable causes, and those with the central rather than peripheral vision loss.37 38 Our analysis provides data on the incidence of new certifications for SI and SSI in Wales as a result of DR over an 8-year period since the introduction of a nationwide DR screening service (DESW). The findings need to be interpreted acknowledging the inherent limitations of the current state of visual impairment certifications where unfortunately blind certification does not equate with blindness rates. Due to these limitations and different definitions of SI and SSI in other countries and settings, it would be difficult to apply these findings to other settings outside of the UK.
Trends in SI and SSI certifications due to DR are clearly decreasing in Wales as in other regions of the UK,18 22 24 although the reasons need to be more fully elucidated and confirmed with further analysis over the coming years. Studies have also indicated that those persons most at risk of losing vision due to DR either do not attend for eye screening and/or are not fully engaged with the management of their diabetes.39–43 In order to ensure the reduced risk for sight loss due to DR in Wales continues, more needs to be done to improve attendance rates for eye screening above its current and stable level at approximately 80%. Studies are currently under way to explore this very important question and to ensure a better uptake into the screening services in order to accommodate this vulnerable segment of the population of people with diabetes. Increased access to structured diabetes education programme is another essential way to help those with diabetes to better understand the importance of regular DR screening and the need to achieve and maintain good glycaemic, blood pressure and lipid control.
In conclusion, findings from this analysis provide positive and useful epidemiological information to assist in the future monitoring of diabetic eye disease in order to provide the basis for assessing the benefit or otherwise of changes in the management of diabetes and DR/maculopathy. However, improvements are needed to the certification process to enhance its value by providing reliable and meaningful epidemiological data in support of the eventual aim of eradicating preventable vision threatening disease in the ever increasing population of people with diabetes and the general population alike. This analysis, despite the inherent limitations of the current process for the CVI, highlights the positive benefits of introducing a community-based screening programme for the early detection of sight-threatening DR.
Acknowledgments
The data provided by Moorfields Eye Hospital, captured by the Certificate of Vision Impairment (CVI), are Department of Health copyright and this work was made possible by collaboration with the Royal College of Ophthalmologists. Any views expressed in the publication are those of the author(s) alone and are not necessarily those of the Department of Health. The authors would like to thank Philippa Simkiss from RNIB who reviewed the manuscript.
References
Footnotes
Contributors RLT performed the data analysis and wrote and edited the manuscript. SDL, RVN, SB and DRO all contributed to the study design and interpretation of the data and revised the manuscript. AZ and CB carried out the data collection and revised the manuscript.
Funding Support for this study was provided by the Wales School of Primary Care Research and the Diabetes Research Unit Cymru. The funders had no role in the study design, collection analysis and interpretation of data, report writing or submission for publication.
Competing interests None declared.
Provenance and peer review Not commissioned; externally peer reviewed.
Data sharing statement No additional data are available.