Article Text

Abstract
Objectives The two-child policy took effect in China on 1 January 2016, thus officially ending the one-child policy. The resultant growth in the population will create a considerable demand for public services such as paediatric healthcare, even while there are limited paediatric resources. We estimated the relationship between paediatric health resources and services and child mortality to determine the degree of the deficiency of such resources in China. Projecting the quantity of paediatric health resource allocation and service supply through 2030 will help provide data reference for future policy decision making.
Design Time-series study.
Setting The People’s Republic of China.
Participants Paediatric patients whose data were recorded between 2003 and 2012 from the National Health and Family Planning Commission of the People’s Republic of China.
Primary and secondary outcome measures Child mortality and paediatric health resources and services data were entered into a cubic polynomial regression model to project paediatric health resources and services to 2030.
Results Child mortality decreased throughout the past decade. Furthermore, the number of paediatric beds, paediatricians and nurses increased between 2003 and 2012, although the proportions increased rather slowly. Both the number and proportion of paediatric outpatients and inpatients increased rapidly. The observed and model-predicted values matched well (adjusted R2=93.8% for paediatric beds; adjusted R2=96.6% for paediatric outpatient visits). Overall, the projection indicated that paediatric beds, paediatricians and nurses will reach 460 148, 233 884 and 184 059 by 2030, respectively. Regarding paediatric services, the number of paediatric outpatient visits and inpatients is expected to reach upwards of 449.95 million and 21.83 million by 2030, respectively.
Conclusions Despite implementation of the two-child policy, resource allocation in paediatrics has many deficiencies. Proper measures should be taken to actively respond to the demand for paediatric health services.
- pediatric
- health resources
- health services
- China
This is an Open Access article distributed in accordance with the Creative Commons Attribution Non Commercial (CC BY-NC 4.0) license, which permits others to distribute, remix, adapt, build upon this work non-commercially, and license their derivative works on different terms, provided the original work is properly cited and the use is non-commercial. See: http://creativecommons.org/licenses/by-nc/4.0/
Statistics from Altmetric.com
Strengths and limitations of this study
This study examined the paediatric healthcare resources and services in China in order to determine trends in these over the past decade as well as project them, based on child mortality data, over the next 18 years.
The paediatric data are incomplete—in particular, paediatric hospitalisation rates, paediatric hospital bed utilisation rate and average length of stay could not be obtained directly or indirectly.
The rather long projection (18 years) is based on a short time span of data; thus, errors are likely to have influenced the projection results.
Introduction
In recent years, China has begun making efforts to improve maternal and child healthcare. These efforts have achieved fruitful results: a series of laws and regulations aimed at improving child health have been enacted, and the developments of paediatric health resources and services have contributed to decline in child mortality in China. Furthermore, the two-child policy took effect in China on 1 January 2016—thus allowing couples to have two children—officially ending the 35-year-long one-child policy.1 The two-child policy seems like a necessary measure, given current fertility rates: Chinese Academy of Social Sciences’ publication (the Economic Blue Book, ‘China’s economic situation and forecast in 2015), the total fertility rate in China was reported to be only 1.4, which is close to the internationally recognised ‘low fertility trap’ of 1.3.2 China’s population is expected to reach 1.45 billion by 2030, following the easing of the one-child policy.3 4 The growth in population as a result of the two-child policy will soon create a considerable demand for public services such as healthcare. This population growth will likely be challenging to both government and society, who must meet the increasing demand and improve services to fulfil the needs of an increasingly demanding public. However, at present, China’s hospital and medical systems are not adequately equipped to handle a baby boom. According to the Chinese Medical Doctor Association, compared with developed countries, China is short of at least 200 000 paediatricians. The shortage of paediatricians and paediatric nurses in China is alarming, and it is becoming the norm for patients to wait for several hours in paediatric clinics before seeing either.5 Furthermore, in China, only 5% of pharmaceutical companies produce paediatric drugs, and 90% of medications on the market do not mention child-specific dosages on the packages.6 Overall, the paediatric resources of general hospitals are shrinking. This shrinkage—called ‘class II and III hospital paediatric contraction phenomenon’—is apparently most serious in Shanghai, where hospitals have not hired a new paediatrician every 5–10 years. Furthermore, some hospitals have had to close their paediatric departments because their paediatrician resigned. The National Health and Family Planning Commission of the People’s Republic of China (NHFPC) must therefore attempt to improve maternal and childcare services throughout the country to respond to the increasing population.
The United Nations, in its Sustainable Development Goal 3, is calling for ‘by 2030, end preventable deaths of newborns and children under 5 years of age, with all countries aiming to reduce neonatal mortality to at least as low as 12 per 1000 live births and under-5 mortality to at least as low as 25 per 1000 live births’.7 Furthermore, the Global Strategy for Women’s, Children’s and Adolescents’ Health (2016–2030) provides guidance towards achieving nothing less than a complete transformation of health and sustainable development by 2030 for women, children and adolescents worldwide.8 In line with these efforts, the Chinese government is actively promoting a sustainable development agenda to achieve these health-related targets for 2030. Indeed, on 26 August 2016, the Political Bureau of the Communist Party of China Central Committee reviewed and approved the plan for Healthy China 2030.9
Nevertheless, with the increasing demand for paediatric services brought on by the additional births and currently limited paediatric resources, how will China’s health system adapt to ensure qualified and accessible health services?10 11 In this study, we focused on three main variables: (1) Chinese children’s health, (2) Chinese paediatric health resources and (3) Chinese paediatric health services. To examine the current situation of children’s health, we focused on the neonatal mortality rate (NMR), infant mortality rate (IMR) and under-5 mortality rate (U5MR; ie, the mortality rate for children under 5 years of age) from 1991 to 2012. Trends in paediatric resources and their allocation were examined by focusing on the number of beds, paediatricians and paediatric nurses. Finally, to examine trends in paediatric service supply, we focused on the number of paediatric outpatient visits and inpatients. We also examined the relationships between paediatric health resources and services and child mortality; then, we predicted paediatric health resource allocation and service supply by 2030 using child mortality. The overall objective of this study is to determine the deficiency in paediatric health resource allocation and service supply in China, thus providing reference data for future policy decision making.
Methods
Study design
In this study, we estimated the status and trends in child mortality and paediatric resources and services, explored the relationships between child mortality and paediatric resource allocation and service supply in the past decade and, based on a regression model, projected paediatric resources and services into the year 2030 to identify whether the current resource allocation and supply of services will pose a future challenge in the light of the new two-child policy.
Data sources
The demographic data were obtained from the statistical reports of the NHFPC, Ministry of Public Security, Ministry of Education and Ministry of Civil Affairs spanning 2003 to 2013. The number of paediatric beds and outpatient visits were obtained from the Chinese Health Statistics database. As department-level statistical data for human healthcare resources in China are not available, we estimated the number of paediatricians and paediatric nurses from official data and using the paediatric resource allocation ratio policy.12 13
The data for NMR, IMR and U5MR were obtained from the Maternal and Child Mortality Surveillance system (MCMS) for the period 1991–2012. This system provides accurate estimates of child mortality using a large sample size.14 The surveillance sites included in MCMS were chosen to provide a nationally representative sample, rather than a provincially representative one. At the time of this study, MCMS covered 334 of the 2377 administrative units of China (124 urban and 210 rural) spread across 31 provincial-level divisions.
Study variables
The following study variables were included.
Mortality rate: we examined three sets of mortality rates: NMR, IMR and U5MR.
Paediatric beds: the number of beds in the paediatric department of a hospital. Based on the registration type, hospitals could be divided into public and non-public hospitals, while based on type of ownership, hospitals could be divided into government, public and private hospitals.
Paediatricians: these included practitioners with paediatric practice certificates and practical personnel engaged in paediatric medical treatment, disease prevention and healthcare. This group included assistant practising doctors, but not medical practitioners working in management.
Paediatric nurses: these included personnel engaged in paediatric nursing work, not including nurses working in management.
Paediatric outpatient visits: this was defined as the number of outpatient or emergency visits in paediatric departments.
Paediatric inpatient: this was defined as the number of inpatients who received a hospital discharge. Thus, it would include all those who recovered, improved, were not cured, died and so on.
Statistical analysis
First, a retrospective study was used to estimate the trends in children’s mortality and paediatric health resources and services. Subsequently, we used a time-series analysis to investigate associations between dependent and independent variables within the observed data.15–18 A time-series study is a quantitative method for assisting the subjective art of data interpretation.19 Time-series designs are widely used in public health research to examine associations between two variables, such as mortality or health service supply.20 21 In particular, it can be used to explore the influence of various conditions on the parameters of interest through continuous observation over time, thereby revealing temporal changes in the characteristics and patterns of these parameters. Trends in the data from 2003 to 2012 were analysed using a time-series analysis with children mortality or paediatric health resources and services as the main outcomes.22–24 Paediatric bed allocation affects the number of paediatricians, paediatric nurses and paediatric outpatient service, which affects the paediatric inpatients. Therefore, we selected paediatric beds and paediatric outpatient visits as representative indicators of paediatric resources and service respectively. Then, a cubic polynomial model was used to evaluate the relationships between number of paediatric beds or outpatient visits and total U5MR, as well as how these relationships changed over time. Cubic polynomial curves were plotted from the continuous observational data, and the real values and resulting equations were used to estimate new corrected data points.25
After applying the criterion of minimising the sum of squared errors, the cubic polynomial fit curves were found to substantially improve the correction results. The following equation was used for curve fitting:

where a, c, d and e are arbitrary parameters. The fitting was followed by solving the cubic equations for the unknown x using Cardano’s method, described previously.26 27
Data were divided into two parts: data from 2003 to 2010 were used to build the model, while data from 2011 to 2012 were used to validate the model. A natural log transformation of the dependent variable was conducted to meet the requirements of the data being stationary and normally distributed for the cubic polynomial model. All of the data analyses were performed using SAS V.9.2 software (SAS Institute).
Ethics
Since no primary data collection was undertaken, no formal ethical assessment or informed consent was required.
Results
Trends in child mortality between 2003 and 2012
Figure 1 shows the trends in age-specific mortality in China between 2003 and 2012. In this decade, NMR, IMR and U5MR decreased by 61.67% (from 18.0 to 6.9 per 1000 live births), 59.61% (from 25.5 to 10.3 per 1000 live births) and 55.85% (from 29.9 to 13.2 per 1000 live births), respectively (figure 1A). Thus, child mortality evidently decreased in this decade. However, the progress was not evenly distributed between urban and rural areas: by 2012, U5MR in urban and rural areas had decreased by 60.14% and 51.50%, respectively, from 2003 (urban: 5.9 vs 14.8; rural: 16.2 vs 33.4). However, children who were born in poor rural areas were still nearly three times as likely to die as children from urban areas (figure 1D).

The trends in child (<5 years old) mortality rate (per 1000 live births) in China from 2003 to 2012. (A) Total mortality of NMR, IMR and U5MR; (B) Urban and rural NMR; (C) Urban and rural IMR; (D) Urban and rural U5MR. IMR, infant mortality rate; NMR, neonatal mortality rate; U5MR, under-5 mortality rate.
Observed trends in paediatric health resources and services
Table 1 summarises the observed trends in paediatric health resources and services across the study period. We examined these data separately according to the category of institutions (all medical institutions, hospitals and children’s hospitals). In 2012, the number of paediatric beds in all medical institutions was 2.51 times than that in 2003 (ie, from 152 208 (6.47% of the total) in 2003 to 381 824 (6.67% of the total) in 2012). Furthermore, during this period, the number of paediatric beds increased by 106 158 beds in hospitals, but proportion increased only by 0.03%. Looking specifically at children’s hospitals, the number of paediatric beds increased by 14 593, whereas the percentage increased only by 0.13%. These results indicate that if all hospitals in China were allocated 1000 beds, only one of those beds would be for children’s hospitals.
The observed values in paediatric resources and services in China for 2003–2012
Regarding the paediatric workforce, the numbers of paediatricians in medical institutions increased from 56 521 in 2003 to 102 026 in 2012, with the proportions increasing by 0.30%. Paediatric nurses in medical institutions increased from 60 883 in 2003 to 152 730 in 2012, while the proportions increased by 1.31% in the past decade. Furthermore, while the number of paediatric nurses in hospitals increased from 50 383 to 92 846, the proportion of the total number of nurses decreased from 5.42% to 5.07%. The numbers of paediatricians in children’s hospital increased from 6146 to 11 525, while the proportion increased by 0.09%. Paediatric nurses in children’s hospital increased from 8248 to 19 059, while the proportion increased by 0.15% in the past decade.
Furthermore, the number of paediatric outpatient visits in all medical institutions increased by 247 million, starting at 156 million (7.82%) in 2003 and reaching 404 million (9.57%) in 2012. Specifically in hospitals, the number of paediatric outpatient visits increased from 84.78 million (7.44%) to 224.38 million (9.04%), representing a 2.65-fold increase and an absolute increase of around 140 million. The number in children’s hospitals increased from 15.62 million (1.36%) to 42.83 million (1.72%), indicating an absolute increase of 27.21 million (0.37%). The growth in paediatric inpatients was also rather rapid: from 2003 to 2012, the number of paediatric inpatients increased from 3 765 932 to 18 565 523 in medical institutions. In the hospital, the number of paediatric inpatients increased from 1 759 070 to 12 404 012, while the proportion increased by 5.48%. At the same time, in children’s hospitals, the number of paediatric inpatients increased from 463 580 to 1 340 628, while the proportion increased by 0.03%.
Results of the cubic polynomial regression model
The number of paediatric beds and outpatient visits observed from 2003 to 2010 matched the numbers extrapolated from the cubic model to a reasonable degree. Furthermore, the data from 2011 and 2012, used to validate the model, illustrated good fitness between the observed and predicted values (adjusted R2=93.8% for the number of paediatric beds; adjusted R2=96.6% for the number of paediatric outpatient visits).
The final fitted model for paediatric beds was as follows:

The final fitted model for paediatric outpatient visits was as follows:

Projected paediatric health resources and paediatric services for the years 2013–2030
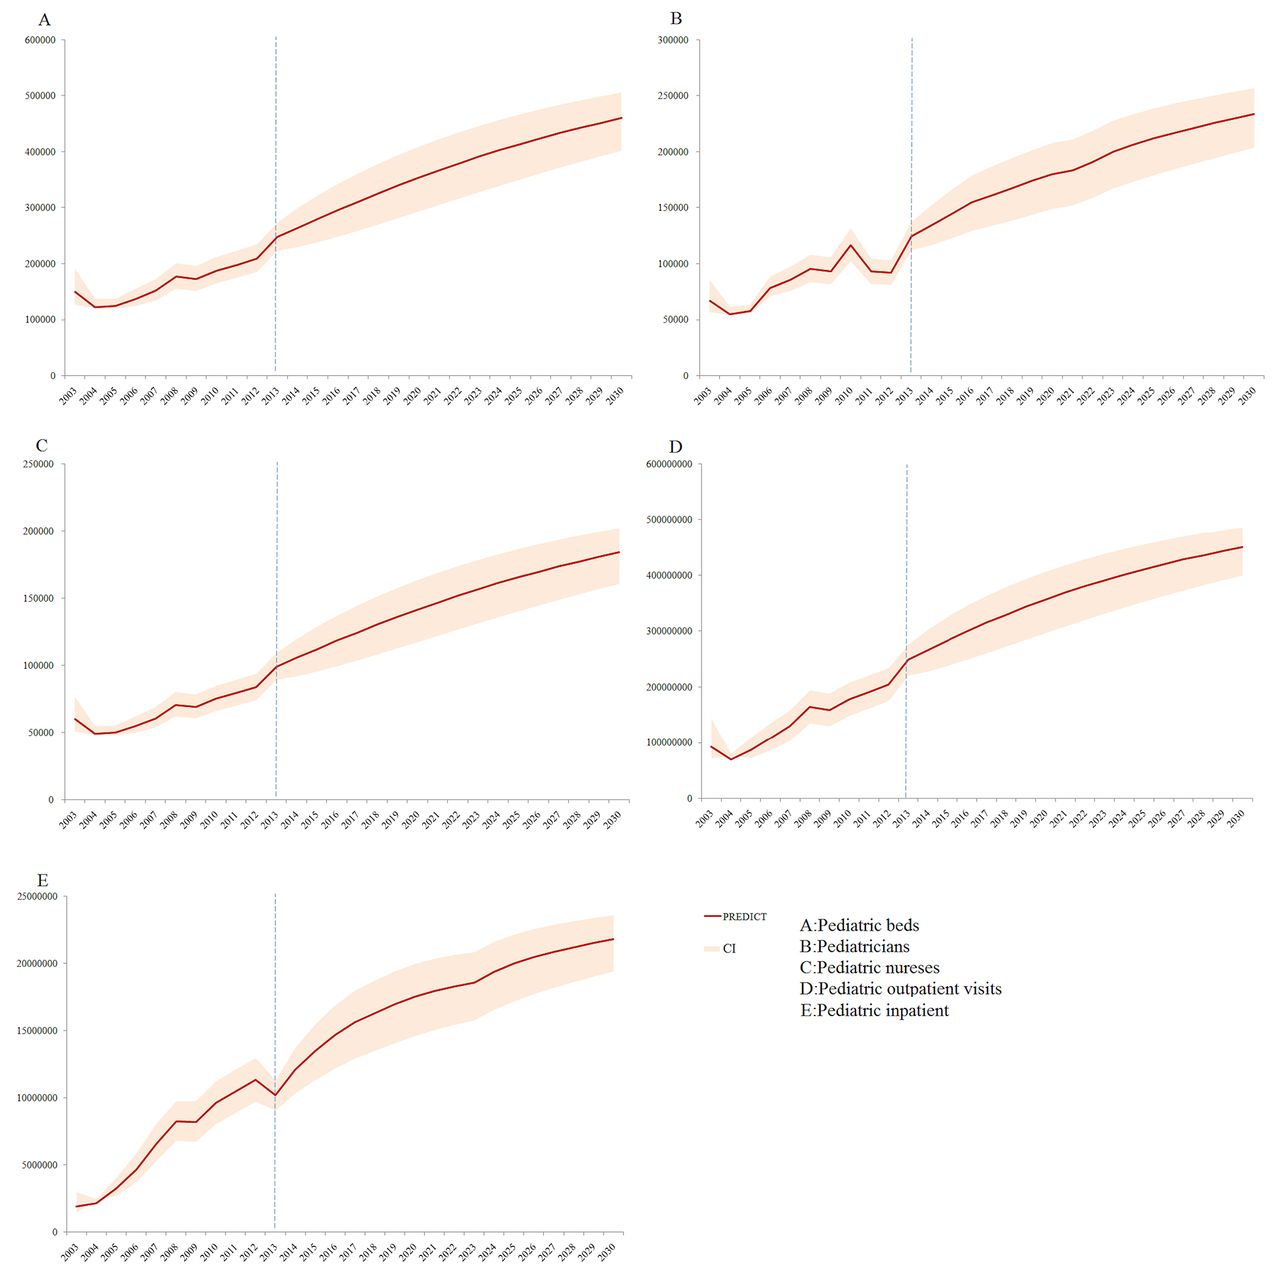
Based on the cubic relationship between paediatric beds and U5MR, we projected the number of paediatric beds from 2013 to 2030. The predicted and actual values for 2011 and 2012 were essentially identical. The results indicated that the number of paediatric beds will continue to increase in the future, ultimately reaching 460 148 in 2030 (table 2); this is 1.98 times the number in 2012 (figure 2A). The predicted value for the number of paediatric beds was lower than the observed values for 2011 and 2012, indicating that the prediction was reasonable. Based on the relationship between paediatric beds and paediatric human resources, we projected that the number of paediatricians and nurses would reach 233 884 and 184 059, respectively, in 2030 (table 2 and figure 2B,C).
Projected results in paediatric resources and services in China for 2013–2030
Observed and projected trends of paediatric resources and paediatric services in China.
There was a cubic relationship between the number of paediatric outpatient visits and child mortality. The predicted and observed values for paediatric outpatient visits in 2011 and 2012 were essentially identical. The number of paediatric outpatient visits is projected to continue to increase in the future, ultimately reaching 449.95 million in 2030, or 2.00 times the number in 2012 (table 2 and figure 2D). Furthermore, by 2030, paediatric inpatient services will reach 21.83 million, or 1.76 times the number in 2012 (table 2 and figure 2E).
Discussion
Overall, we found that between 2003 and 2012, the total numbers of paediatric beds, paediatricians, paediatric nurses, paediatric outpatient visits and paediatric inpatients in China steadily increased in parallel with a reduction in child mortality. These results suggest that the improvements made to paediatric healthcare in China resulted in a major reduction in child mortality between 2003 and 2012. Importantly, the observed and predicted values were very close, and the relative error remained within a reasonable range; therefore, the projected results of this study can be considered reasonable and credible. The prediction results have clarified that the increase in the population expected in the future is likely to pose a huge challenge to paediatric health resource allocation and health service supply.
Improvements in paediatric health resources and services are evidently key factors influencing the child mortality rate.28 29 This accords with previous studies examining the factors that may have influenced the reduction in child mortality observed over the past two decades in China, including better healthcare, adequate nutritional intake, expansion of healthcare systems and higher rates of insurance coverage.30
The amounts of paediatric resources and services provided both showed an annual increasing trend. The upward trend in the former suggests that the government has paid attention to the appropriate allocation of paediatric resources in the past decade. Furthermore, we observed an interesting phenomenon regarding the allocation of paediatric beds: although the number of paediatric beds increased annually, the proportion of paediatric beds to the total number of beds remained at approximately 6.47% and 5.48% in all medical institutions and hospitals, respectively. Thus, it would seem that the paediatric workforce increased relatively slowly compared with the amount of paediatric beds and services provided. Some institutions were evidently showing reductions in the amount of paediatric human resources. Regarding the paediatric service supply, the number of paediatric outpatient visits and inpatients showed more rapid growth compared with the amount of paediatric resources. This might be the result of increases in paediatric medical needs.31 Furthermore, in all medical institutions, the number of paediatric outpatient visits tripled in the past decade, while the proportion of paediatric outpatient visits to the total number of such visits increased from 7.82% to 9.04%. One possible reason for this is the changing spectrum of disease among children.32–34 At the same time, it may be that paediatric outpatient treatment is becoming a more convenient treatment method, especially considering the increasing demand for paediatric beds.
The rapid growth in the demand for paediatric inpatient services might result in a shortage of paediatric hospital beds and overburdening of paediatricians. According to the population of children under the age of 5 per year with the number of inpatient, the hospitalisation rate was found to have increased from 5.46% to 24.34% in the past decade. By contrast, the number of paediatric beds increased from 2.21 to 5.01 per 1000 children. Thus, the uncoordinated growth in demand and supply of paediatric beds is perhaps influencing accessibility to paediatric health services.
We explained the impact of the allocation of paediatric resources and services on child mortality by creating regression models describing the relationships of number of paediatric beds and paediatric outpatient visits with child mortality. This projection retains objective historical data and projects paediatric health resources and services more reliably. The results of the projection indicate that the paediatric health resources and services will increase by 2030. These projected trends will no doubt aid in future management and development plans.
Note that, from the starting point of data collection, the paediatric data available are not rich and the period over which these data were recorded is rather short. In 2007, China modified the path of health statistics; thus, some of the health indicators are deficient. Since paediatric beds and paediatric outpatient visits in hospitals had not been recorded before 2007, to calculate the trends in paediatric resources and services, we needed to fill in some missing data. Furthermore, since paediatricians in hospitals had no records in the past decade, we had to start that column. The children’s hospital data were the most complete, but as of 2012, China had only 89 children’s hospitals, meaning that the representativeness of these data are poor. Therefore, we were unable to fully analyse the allocation of paediatric health resources and service supply. Furthermore, we used a time-series design to project paediatric resources and services. However, since the official data’s year span is limited, we were only able to include data from 2003 to 2012. As such, our prediction of 18 years in the future is based only on data over 10 years; to ensure the accuracy of the model fitting and projection, we selected the cubic polynomial model. With continuous improvement of health, particularly with respect to the reduction of child mortality, it is essential to increase the amount of paediatric health resources and services to meet the increasing demand in China; however, it is equally important, if not more so, to improve the efficiency of utilisation of the same. Thus, China’s two-child policy raises the bar for the allocation of paediatric resources and service supply.
References
Footnotes
Contributors XZ constructed the database, extracted the data and drafted the manuscript. YG extracted the data and information and analysed the data sources of child mortality. CL conducted statistical analysis and revised the paper. RZ, JC and LZ provided technical assistance during the analysis of mortality data, participated in interpretation of the data and made important revisions to the draft manuscript. YFW contributed to the study design and made critical revisions to the manuscript. YGW directed the entire study process, including the study design, data collection and analysis and data interpretation, and made critical revisions to the paper. All authors have contributed to, reviewed and approved the manuscript.
Funding This work was supported by the National Natural Science Foundation of China (grant numbers 71273187 and 71473175). YFW’s work was partly funded by the National Institutes of Health, and the National Institute of Child Health and Human Development (NICHD, grant number U54HD070725). The U54 project was cofunded by the NICHD and the Office of Behavioral and Social Sciences Research (OBSSR).
Disclaimer The authors of this paper assume complete responsibility for the contents of this paper, and their views do not necessarily represent the official views of the funders.
Competing interests None declared.
Provenance and peer review Not commissioned; externally peer reviewed.
Data sharing statement No additional data available.
Correction notice This paper has been amended since it was published Online First. Owing to a scripting error, some of the publisher names in the references were replaced with 'BMJ Publishing Group'. This only affected the full text version, not the PDF. We have since corrected theseerrors and the correct publishers have been inserted into the references.