Article Text

Abstract
Objectives This study aimed to compare serum free fatty acids (FFAs) and lipopolysaccharide-binding protein (LBP) between metabolically healthy abdominally obese (MHAO) and metabolically unhealthy abdominally obese (MUAO) individuals. We also examined the association between serum FFAs and LBP in the participants.
Methods In this age-matched and gender-matched case–control study, 164 abdominally obese subjects were recruited from June to November 2015 in the northwest of Iran. Demographic data, dietary intake, body composition, anthropometric indices and physical activity (PA) were assessed. Basal blood samples were collected to determine serum metabolic parameters, FFAs and LBP. Abdominal obesity was defined as having waist circumference ≥95 cm. Those with three or more metabolic alterations were defined as MUAO and those having two or less were classified as MHAO. Data were analysed using SPSS V.17.0.
Results There were no significant differences in dietary intake, anthropometric indices, body composition and PA between the two groups. The odds of MUAO significantly increased by increments in serum fasting blood sugar (OR 3.79, 95% CI 2.25 to 6.40), triglycerides (OR 1.10, 95% CI 1.05 to 1.15), systolic blood pressure (OR 1.02, 95% CI 1.00 to 1.04) and diastolic blood pressure (OR 1.03, 95% CI 1.01 to 1.06) and decreased by increase in serum high-density lipoprotein cholesterol (OR 0.32, 95% CI 0.20 to 0.52). The levels of LBP and FFAs showed no significant differences between the two groups. However, significant correlations were found between LBP and FFAs in pooled population (r=0.712; p<0.001) as well as in cases (r=0.717; p<0.001) and controls (r=0.704; p<0.001). Neither FFAs nor LBP were significantly correlated with dietary intake or metabolic parameters (p>0.05).
Conclusion The results indicated that serum LBP and FFAs are highly correlated both in MHAO and MUAO states. In addition, the levels of LBP and FFAs seem to be more related to abdominal obesity than to the presence or absence of metabolic health.
- free fatty acids
- lipopolysaccharide binding protein
- metabolic health
- abdominal obesity
This is an Open Access article distributed in accordance with the Creative Commons Attribution Non Commercial (CC BY-NC 4.0) license, which permits others to distribute, remix, adapt, build upon this work non-commercially, and license their derivative works on different terms, provided the original work is properly cited and the use is non-commercial. See: http://creativecommons.org/licenses/by-nc/4.0/
Statistics from Altmetric.com
Strengths and limitations of this study
The association of lipopolysaccharide-binding protein and free fatty acids levels in metabolically healthy abdominally obese and metabolically unhealthy abdominally obese individuals for the first time and found significant differences between the two parameters.
This was a case–control study in which causality could not be assessed.
Insulin levels were not measured in our study population; therefore, insulin resistance was not studied.
The present work was carried out on volunteer participants. Though all volunteers were randomly recruited from general population after public announcement and based on the eligible criteria.
Introduction
Obesity is increasingly prevalent worldwide.1 There are well-established health consequences of obesity such as type 2 diabetes, metabolic syndrome (MetS) and cardiovascular disease.2 However, not all obese people are at higher risk of metabolic diseases. In a subtype of obese persons, described as ‘metabolically healthy obese (MHO)’, the obese phenotype may exist devoid of metabolic dysfunction.3 Despite there still being no uniform definition for MHO, it is thought to account for approximately one-fifth of the obese population.4
Evidence increasingly identifies inflammation as a potential mechanism linking adiposity, especially abdominal fat and metabolic dysfunction.5 However, published results are rare and conflicting regarding the role of inflammation in the metabolic differences observed between metabolically healthy and unhealthy individuals.6 7 Studies on postmenopausal obese women suggest that the MHO may have more favourable inflammatory profiles8 and less visceral fat9 than their counterparts with insulin resistance (IR) and other metabolic abnormalities.10 In contrast, another stduy11 reported that MHO women displayed abnormal levels of inflammatory profile, despite not having increased 10 year risk of cardiovascular disease.
The basic mechanism accounted for inflammation in adipose tissue is still unknown, but some factors including plasma free fatty acids (FFAs) are suggested.12 It was clarified that plasma FFAs are increased among the obese as they are released from inflamed adipose tissue13 and through the lipolysis of adipocytes.14 However, little is known about the contribution of FFAs to the development of inflammation in obesity. Therefore, examining the association of FFAs with inflammatory markers seems to be warranted.
Lipopolysaccharide (LPS) molecules, also known as bacterial endotoxins, may trigger inflammation, leading to activation of immunity and cytokine release. LPS infusion and consequent subclinical endotoxaemia results in elevated levels of proinflammatory markers and metabolic aberrations.15 16 LPS has a short half-life17 and there is no agreement on the measurement of its plasma level.18 Hence, lipopolysaccharide-binding protein (LBP) is introduced with longer half-life and more reliable measurement.19 20 Also, serum LBP level is a proxy of serum LPS level.21 A population-based study22 found that LBP was significantly associated with MetS in normal weight participants. Another study23 reported that among MetS components LBP concentration was independently associated with abdominal obesity.
In prior studies, inflammatory parameters were compared between obese and lean subjects.19 24 25 Therefore, it remains unclear whether the observed alterations in serum FFAs and/or inflammatory parameters in metabolically unhealthy obese patients are due to adiposity and/or metabolic state. Therefore, regarding the significant confounding effect of abdominal obesity, we used waist circumference (WC), as a reflection of visceral adipose tissue,26 to define abdominal obesity and examined differences in characteristics and inflammatory markers (serum LBP and FFAs) between ‘metabolically healthy’ and ‘unhealthy’ abdominally obese individuals. We also examined the association between serum FFAs and LBP in pooled population as well as in each group.
Methods
Study design and participants
A total of 81 metabolically healthy abdominally obese (MHAO) with 83 age-matched and gender-matched metabolically unhealthy abdominally obese (MUHAO) were recruited in this case–control study, carried out from 15 June to 6 November 2015 in the northwest of Iran. Frequency matching was carried out for the present study. Apparently healthy individuals aged 18–60 years with abdominal obesity were included in the study. We excluded pregnant or lactating women, those with diarrhoea for 3 consecutive days within the previous 3 months, diagnosed diabetes, coronary heart disease, stroke, myocardial infarction, cardiovascular and kidney, liver or infectious diseases including tuberculosis, AIDS and hepatitis; thyroid problems, severe mental disorders or physical disabilities and malignancies; taking oral antidiabetic agents or insulin or other drugs for the past 2 months or antibiotics used for 3 consecutive days within the previous 3 months; smokers or alcohol consumers; misreported dietary intakes (<800 kcal/day or >4200 kcal/day) or being on specific diets in the past 6 months and having gastrointestinal surgery within the past 1 year.
Abdominal obesity was defined as having WC ≥95 cm according to the Iranian National Committee of Obesity.27 According to Meigs et al28 , metabolic health was defined as the presence of <3 of the following metabolic abnormalities including abdominal obesity (WC ≥95 cm for both genders)27; high serum triglyceride (TG) concentration (≥150 mg/dL); low serum high-density lipoprotein cholesterol (HDL-C) (<40 mg/dL for men and <50 mg/dL for women); elevated blood pressure (BP) (≥130/85/85 mm Hg) and fasting blood sugar (FBS) (≥100 mg/dL). Eighty-one individuals with ≥3 criteria entered the case group (MUAO) and 83 with ≤2 criteria formed the control group (MHAO).
Sampling procedures
After public announcement for the study, 500 volunteers were recruited from general population. Of these, 178 people could enter the study based on the defined eligibility criteria for the present study. Informed consent was taken from each participant before the study. After taking blood samples and anthropometric measurements, 14 of them were excluded due to diabetes (FBS ≥126 mg/dL29 in two occasions), leaving 164 people (82 men, 82 women) to conduct the research.
Biochemical assays
After a 12 hour overnight fast, 5 cm3 blood was obtained for serum analyses. After centrifugation at 3000 rpm for 5 min, metabolic parameters were analysed immediately, but serum FFAs and LBP were analysed after supplying in −80°C.
FBS was measured by the enzymatic colorimetric method using glucose oxidase. Serum TG concentration was measured by commercially available enzymatic reagents with glycerol phosphate oxidase. Serum HDL-C was measured after precipitation of the apolipoprotein B-containing lipoproteins with phosphotungistic acid. Assays were performed using Pars Azmoon kits (Pars Azmoon, Tehran, Iran) and a Selectra 2 auto-analyzer (Vital Scientific, Spankeren, the Netherlands). Interassay and intra-assay coefficient of variation (CV) was <5% for all assays. Serum samples for both LBP and FFAs assays were stored at −80°C until analysis. Both serum LBP and FFAs levels were determined by a sandwich ELISA (Bioassay Technology Laboratory, Shanghai Korean Biotech, Shanghai City, China) according to the manufacturer’s instructions. The intra-assay and interassay CVs were <8% and <10%, respectively.
Measurements
All anthropometric indices were measured by a trained researcher. Height (without shoes in standard situation with precision of 0.1 cm and with an inelastic measuring tape) and weight (with Seca scale, light clothes and precision of 0.1 kg) were measured and body mass index (BMI) was calculated as weight in kilogram divided by the square of height in metres.30 WC was measured using a non-stretchable fibre measuring tape. The subjects were asked to stand erect in relaxed position with both feet together on flat surface. WC was measured as the smallest horizontal girth between the costal and iliac crests at minimal respiration. Hip circumference was taken as the greatest circumference at the level of greater trochanters (the widest portion of the hip) on both sides. Waist to hip ratio was calculated by dividing WC (cm) by hip circumference (cm).31 BP was recorded in a comfortable sitting position in the left arm after at least a 5 min rest using the mercury sphygmomanometer. Two measurements were taken and the mean of the two measurements was considered as the BP.32 Bioelectrical Impedance Analysis (BC-418MA, Tanita, Japan) was used to describe fat per cent, fat mass and fat-free mass. Dietary intake was assessed using a 3-day food record (1 weekend day and 2 workdays). Nutritionist IV software (Axxya Systems, Stafford, Texas, USA), modified for Iranian foods, was used for dietary data analysis. Physical activity (PA) was measured via long-form International Physical Activity Questionnaire (IPAQ).33
Statistical analysis and sample size
To examine the normal distribution of variables, Kolmogrov-Smirnov tests and histograms were applied. The independent samples t-test was used to compare the means (SD) of normally distributed variables between the two groups. The Mann-Whitney U test was used for values with skewed distribution and in such conditions median (25th, 75th) was reported. In order to assess the association of two categorical variables, χ2 test was applied. The correlation between serum FFAs and LBP was assessed using Spearman’s correlation coefficient analysis. ORs and their 95% CIs were reported using logistic regression test.
The larger sample size was calculated for serum FFAs compared with LBP using literature-derived data34 for patients with non-alcoholic fatty liver disease (NAFLD); the effect size for serum FFAs was 0.20 nmol/L (SD1=0.34 nmol/L for controls and SD2=0.53 nmol/L for patients with NAFLD). Therefore, sample size estimation was based upon this parameter with 80% power and α-error of 5% and a case-to-control ratio of 1:1. It was predicted that 79 persons in each group would detect changes in serum FFAs as well as serum LBP level using the two-means formula. Data were analysed using SPSS V.17.0 for Windows (PASW Statistics). p value <0.05 was considered significant. Finally we reported the study based on the STROBE statement for Case-Control studies (Supplementary file 1).
Results
Males comprised about 50% of the study participants in the two groups (p=0.87). The age range of the subjects was 20–59 years. Participants of the two study groups similarly had WC ≥95 cm, that is, the cut-off point of WC for Iranian population. Overall, there were no significant differences in age, gender, anthropometric indices and body composition between the two groups. Dietary parameters, especially total fat, saturated fatty acids (SFA), monounsaturated fatty acids (MUFA) and polyunsaturated fatty acids (PUFA) intakes, were more or less the same between the two study groups (table 1). Marital status, education level and job of the cases and controls were also similar. However, mean number of metabolic aberrations were significantly higher in cases than controls (3.25±0.72 vs1.67±0.50; p<0.001) (data not shown). The flow chart of the study is shown in figure 1.

Flow chart of the study. BMI, body mass index; FBS, fasting blood sugar; TG, triglyceride.
Demographic, anthropometric and dietary intake parameters in metabolically unhealthy abdominally obese (MUAO) and metabolically healthy abdominally obese (MHAO) patients
Except for WC which was matched between the two groups, metabolic aberrations including low HDL-C (82% vs 34%), high TG (78% vs 24%), high FBS (33% vs 0%) and hypertension (34% vs 10%) were significantly higher in the cases than controls, respectively (figure 2). The current study indicated that each 10-unit increment in serum FBS level increased the risk of MUAO about 3.8 times (OR 3.79, 95% CI 2.25 to 6.40). Additionally, the odds of MUAO was significantly increased per one increment in serum TG level (OR 1.10, 95% CI 1.05 to 1.15), the systolic blood pressure (SBP) (OR 1.02, 95% CI 1.00 to 1.04) and diastolic blood pressure (DBP) (OR 1.03, 95% CI 1.01 to 1.06). However, the odds of having MUAO was significantly decreased by 68% per 10-unit increment in serum HDL-C level (OR 0.32, 95% CI 0.20 to 0.52) (table 2).
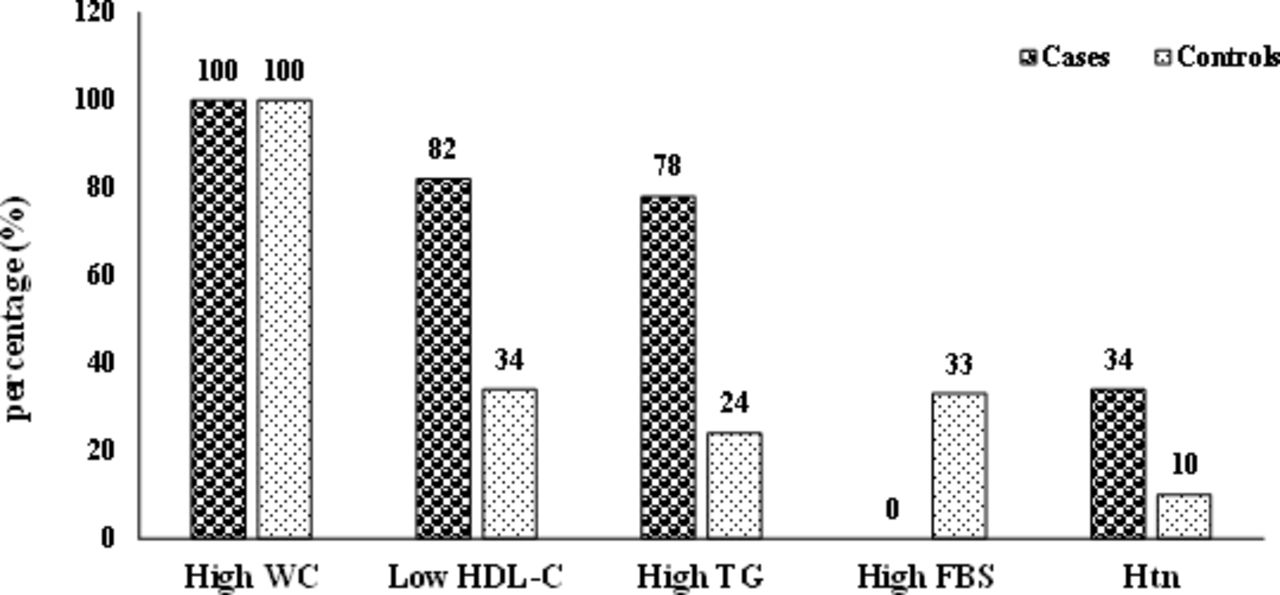
Metabolic characteristics of metabolically unhealthy abdominally obese and metabolically unhealthy abdominally obese subjects. p<0.001 for all except waist circumference (WC), using χ2. FBS, fasting blood sugar; HDL-C, high-density lipoprotein cholesterol; Htn, hypertension; TG, triglycerides.
Biochemical characteristics in metabolically unhealthy abdominally obese (MUAO) and metabolically healthy abdominally obese (MHAO) patients
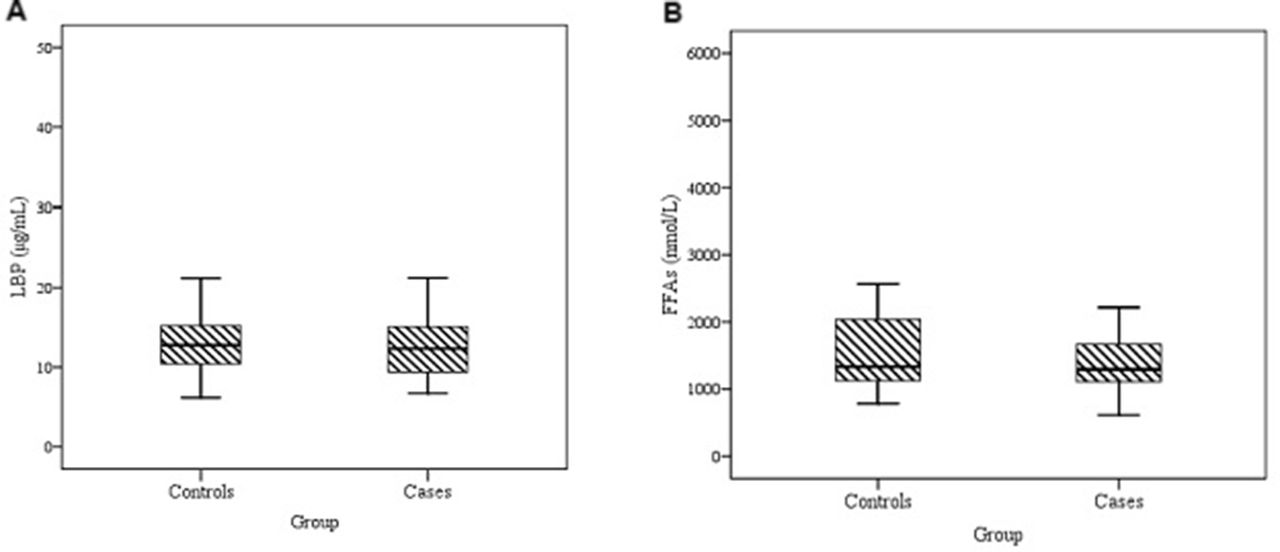
The median of LBP (12.32 µg/mL in cases vs 12.76 µg/mL in controls, p=0.483) and FFAs (1294 nmol/L in cases vs 1333 nmol/L in controls; p=0.686) showed no significant difference between the two groups (figure 3). However, a significant correlation was found between LBP and FFAs in pooled population (r=0.712; p<0.001) as well as in cases (r=0.717; p<0.001) and controls (r=0.704; p<0.001) (figure 4). The results of partial correlation indicated much stronger correlation between LBP and FFAs, when controlling for WC (r=0.961; p<0.001). Moreover, number of metabolic aberrations was significantly correlated with HDL-C (r=−0.537; p<0.001), TG (r=0.468; p<0.001), FBS (r=0.534; p<0.001), SBP (r=0.247; p=0.001) and DBP (r=0.315; p<0.001). Neither FFAs nor LBP were significantly correlated with dietary intake of total fat, SFA, MUFA and PUFA (data not shown). There were also no significant correlations of LBP and FFAs with metabolic parameters (table 3).

Lipopolysaccharide-binding protein (LBP) (µg/mL) (A) and free fatty acids (FFAs) concentrations (nmol/L) (B) in subjects with metabolically healthy abdominally obese (controls) and metabolically unhealthy abdominally obese (cases). p=not significant. Data are presented as box plot where boxes represent the IQR, the line within boxes represents the median and the lines outside the boxes represent the lower quartile minus 1.5 times the IQR or the upper quartile plus 1.5 times the IQR.

Spearman’s correlation between lipopolysaccharide-binding protein (LBP) and free fatty acids (FFAs) in pooled population (A) as well as in each study group (B).
Correlation of free fatty acids (FFAs) and lipopolysaccharide-binding protein(LBP) with metabolic parameters in metabolically unhealthy abdominally obese (MUAO) and metabolically healthy abdominally obese (MHAO) individuals
Discussion
The present study, to the best of our knowledge, examined the association of LBP and FFAs levels in MHAO and MUAO individuals for the first time and found significant differences between the two parameters. Anthropometric indices as well as body composition profile were similar between the two groups. Moreover, there were no significant differences in LBP and FFAs between MHAO and MUAO.
In the present study, we matched metabolically healthy with metabolically unhealthy individuals on abdominal fat which might explain why we did not find any differences in levels of FFAs and LBP, as inflammatory markers, and body composition between the two groups. Therefore, the levels of LBP and FFAs seem to be more related to abdominal obesity than to the presence or absence of metabolic health. This is further supported by the observation that serum FFAs or LBP levels were not correlated with metabolic parameters. Therefore, our findings suggest that increased levels of these two markers are not necessarily related to the presence of metabolic aberrations.
A few smaller studies have examined differences in body composition and/or inflammatory profile between metabolically healthy and unhealthy obese postmenopausal women.35–37 In line with our result, Engström et al, 36 in a research on 58 obese postmenopausal women, found no significant differences in levels of inflammatory markers between those with MetS compared with those without MetS. Additionally, in the population-based study of Philips et al 38, no significant difference was noted in C reactive protein (CRP) level between MHAO and MUAO, based on metabolic health criteria of the Meigs et al 28 study. It is noteworthy that in the present study we used Meigs’s metabolic health definition in which WC has also been considered.
A recent study revealed that the association between inflammatory biomarkers and metabolically healthy obesity depends on the criteria used. Since in that research, a significant difference was noted in the levels of CRP and interleukin-6 (IL-6) with some but not all MHAO definitions, which disappeared after adjustment for abdominal obesity or per cent body fat.39 This study confirms our results. However, Phillips et al 40 showed that obese women and men with MetS had significantly higher levels of inflammatory cytokines than obese persons without MetS. Beasley et al 41 showed that visceral adiposity, and not abdominal subcutaneous fat, was most consistently associated with significantly higher levels of IL-6 and CRP levels in black and white men and women in the Health ABC study. We could not measure visceral fat in our study, though, abdominal obesity measured through WC, can reflect visceral adiposity.26 On the other hand, a recent work observed no significant differences in visceral fat between the obese-insulin-resistant and obese-insulin-sensitive persons.42
Several studies have demonstrated a strong association of IR with obesity, low HDL-C, hypertriglyceridaemia and hypertension10 43 as well as inflammatory factors.44 However, in our study, we could not assess IR due to some financial deficits.
In the present work, dietary intake was compared between the two obese groups; therefore, no significant difference was found in terms of energy or macronutrients, especially fat intake. Moreover, habitual PA was controlled between the study groups. And, in our previous report, there were no significant differences between the two groups in terms of PA (unpublished data). Since different levels of habitual PA might affect levels of serum inflammatory markers.45
Obesity, as a well-known metabolic risk factor, is usually associated with mild chronic inflammation.46 The relationship between obesity and increased inflammation may be justified, in part, by FFAs47 which are released from adipocytes through lipolysis and are elevated in obesity due to increased adipose tissue.48 Inflammatory cytokines such as IL-6 can stimulate lipolysis and increase levels of FFAs.49 On the other hand, in healthy persons an acute increase in FFAs can induce inflammatory changes.50 Therefore, FFAs are not only increased by inflammation, but also promote inflammation. The results of the present research showed that FFAs are positively correlated with LBP levels either in the pooled population or in each group. It shows that any increase in the level of FFAs, observed in the abdominally obese, regardless of their metabolic aberrations can lead to a significant elevation in the level of LBP.
LBP has been considered a key inflammatory marker which mediates LPS-triggered innate immunity.51 Although LBP concentration was previously reported to be associated with various anthropometric and metabolic factors such as BMI, WC and so on,23–25 in our study the relationship only existed between the two biomarkers, FFAs and LBP, but not with the metabolic or anthropometric parameters. It is notable that the positive relationship between LBP and BMI was not observed in either normal weight or obese groups in the Yang et al 52 study after multivariate analyses. In their research, the level of LBP significantly reduced after bariatric surgery and consequent reduction in WC (from 121.6 cm to 90.6 cm; p<0.001) which indicates the strong association of LBP with WC. Liu et al, 22 in a population-based follow-up study on 2529 Chinese, also found that the association of LBP with MetS was significant only in normal weight participants, but not in their overweight/obese counterparts after multivariate adjustments including BMI, which supports our study’s findings. It is assumed that the association between serum LBP level and MetS observed in previous studies19 24 25 is mediated by BMI or WC, and finding no association between serum LBP level and incidence of MetS in our study, in which the WC-matched controls were included, is not unexpected.
Overall, what makes our research different from most of the previous ones is that in our study we matched the two groups based on WC, rarely observed in prior reports. Most of the previous studies have examined either MetS patients versus those without the syndrome or metabolically healthy versus metabolically unhealthy, regardless of their BMI or WC status and based on different metabolic health criteria.3 8 28 A few have examined inflammatory markers between metabolically healthy and unhealthy persons, considering WC or abdominal obesity.36 38 39
Conclusion
Our study indicated that WC could be a strong mediator of the association between serum LBP, FFAs and metabolic alterations. In fact, the levels of LBP and FFAs seem to be more related to abdominal obesity than to the presence or absence of metabolic health. The results also suggested a significant correlation between serum FFAs and LBP in abdominally obese population, which seems to be independent of metabolic aberrations.
Acknowledgments
The authors thank those who participated in this study.
References
Footnotes
Contributors MS-A and NK conceived the study design and wrote the study protocol. MS-A and NK analysed and interpreted the data. MS-A, PA, MN, SMG and NK have been involved in drafting the manuscript or revising it critically for content. All authors have given final approval of the version to be published.
Funding This work was financially supported by MRGUMS and TBZMED, Iran.
Disclaimer None.
Competing interests None declared.
Patient consent Obtained.
Ethics approval All protocols were approved by ethics committees of Maragheh University of Medical Sciences (MRGUMS) and Tabriz University of Medical Sciences (TBZMED). Research was carried out in compliance with the Declaration of Helsinki.
Provenance and peer review Not commissioned; externally peer reviewed.
Data sharing statement No additional data available.