Article Text

Abstract
Objective Personalised medicine seeks to select and modify treatments based on individual patient characteristics and preferences. We sought to develop an automated strategy to select and modify blood pressure treatments, incorporating the likelihood that patients with different characteristics would benefit from different types of medications and dosages and the potential severity and impact of different side effects among patients with different characteristics.
Design, setting and participants We developed a Markov decision process (MDP) model to incorporate meta-analytic data and estimate the optimal treatment for maximising discounted lifetime quality-adjusted life-years (QALYs) based on individual patient characteristics, incorporating medication adjustment choices when a patient incurs side effects. We compared the MDP to current US blood pressure treatment guidelines (the Eighth Joint National Committee, JNC8) and a variant of current guidelines that incorporates results of a major recent trial of intensive treatment (Intensive JNC8). We used a microsimulation model of patient demographics, cardiovascular disease risk factors and side effect probabilities, sampling from the National Health and Nutrition Examination Survey (2003–2014), to compare the expected population outcomes from adopting the MDP versus guideline-based strategies.
Main outcome measures Costs and QALYs for the MDP-based treatment (MDPT), JNC8 and Intensive JNC8 strategies.
Results Compared with the JNC8 guideline, the MDPT strategy would be cost-saving from a societal perspective with discounted savings of US$1187 per capita (95% CI 1178 to 1209) and an estimated discounted gain of 0.06 QALYs per capita (95% CI 0.04 to 0.08) among the US adult population. QALY gains would largely accrue from reductions in severe side effects associated with higher treatment doses later in life. The Intensive JNC8 strategy was dominated by the MDPT strategy.
Conclusions An MDP-based approach can aid decision-making by incorporating meta-analytic evidence to personalise blood pressure treatment and improve overall population health compared with current blood pressure treatment guidelines.
- hypertension
- cardiovascular disease
- personalised medicine
This is an Open Access article distributed in accordance with the Creative Commons Attribution Non Commercial (CC BY-NC 4.0) license, which permits others to distribute, remix, adapt, build upon this work non-commercially, and license their derivative works on different terms, provided the original work is properly cited and the use is non-commercial. See: http://creativecommons.org/licenses/by-nc/4.0/
Statistics from Altmetric.com
Strengths and limitations of this study
This analysis provides a computational tool to operationalise personalised medicine for blood pressure therapy and determine the optimal treatment for an individual, incorporating a complex variety of individual-level covariates, treatment effect modifiers and risks and benefits of treatment alternatives.
This framework can approximate optimal treatment decisions in complex and uncertain environments and can be applied to other disease processes.
Based on published data, the health benefits of medications were assumed to be mediated through changes in blood pressure as per current physiological understanding.
This study used survey data that are subject to recall biases, acceptability biases and under-reporting that may lead to mis-estimation of baseline covariates, and limits the analysis to the non-institutionalised US population.
Introduction
Personalised medicine seeks to select and modify treatments based on individual patient characteristics and preferences.1 While much of personalised medicine focuses on genetics, an increasing number of studies have suggested that personalised medicine could also assist in improving overall population health outcomes even when genetics are not considered or relevant, by using large-scale data synthesis approaches to improve medical decision-making, particularly when numerous patient features and multifaceted data must be considered.2–4 For example, blood pressure therapy guidelines (the Eighth Joint National Committee, JNC8) currently recommend treating large categories of people (eg, older adults, those with diabetes and those with chronic kidney disease) to attain specific targets.5 A few general classes of medications are recommended based on race and comorbid conditions such as diabetes and chronic kidney disease.
Such simplification poses the dilemma of recommending suboptimal treatment choices with submaximal benefit and substantial side effect risk among some patients, in favour of an approach that may direct appropriate therapies to a majority of patients.3 Any particular individual patient may have some or all of these features (eg, not only features suggesting the need for intensive treatment but also features posing risk for severe side effects), requiring clinicians to judge how intensively to treat patients who have multiple features. The target levels of treatment are themselves also subject to controversy. Lower targets for treatment have been advocated for some patients with high cardiovascular disease (CVD) risk following the Systolic Blood Pressure Intervention Trial (SPRINT) study in which a target of 120 mm Hg for systolic blood pressure (SBP) was found to reduce CVD event risk among patients with very high risk6–8; yet post hoc analyses found considerable heterogeneity in the treatment effects and harms, with some researchers proposing decision rules to find groups of patients more likely to experience benefit or harm from the lower blood pressure target.9
Furthermore, side effects of therapy vary among patients with different features, and the complex matrix of different side effect probabilities is challenging for a clinician to remember and calculate for any given patient.10 Hence, automated synthesis of complex data to enable personalised therapy may be helpful to maximise benefits and minimise risks among patients.
We developed and tested a generalisable computational strategy to help personalise treatment when multiple treatment options, benefits and risks must be considered, using a Markov decision process (MDP) model—a model in which outcomes are partly under the control of a decision-maker and partly based on probabilistic calculations from high-quality meta-analytic data. Prior work suggests that personalising optimal treatment policies using an MDP framework could improve patient health outcomes compared with JNC7 treatment guidelines.11 This prior work focuses on assessing the impact of the MDP-based policies on certain cohorts of patients, not on population health. Our study advances this prior literature by incorporating large-scale meta-analytic and network meta-analytic data sources, providing a full life-course simulation to evaluate long-term impact and using population-representative data to assess the overall national implications of personalised blood pressure treatment selection. We open-sourced the model code to permit its replication, application and potential modification for solving other, similar treatment problems.
Methods
Model overview
We modelled the process of sequentially choosing blood pressure treatment medications with a discrete-time, finite time-horizon MDP, which obtains input data from meta-analyses describing medication choices, their potential treatment effects and side effects among patients with different characteristics. Accounting for patient’s characteristics, our MDP performs optimisation using additional data to compute the quality-adjusted life-years (QALYs) that would be gained from averted myocardial infarctions (MIs) or strokes (the primary benefits of lowering blood pressure) or lost to specific side effects, over a simulated lifetime.12 13 The online supplementary appendix file contains all input data, equations and complete technical details consistent with international model reporting guidelines,14 along with a link to program code for replication and extension of our analysis. Here, we provide an overview of the model’s key components (figure 1, table 1).
Supplementary file 1

Model schematic. *‘High-risk’ was defined the same as SPRINT and ACCORD trial enrolment eligibility criteria except for type 2 diabetes status. ACCORD, action to control cardiovascular risk in diabetes; BP, blood pressure; CVD, cardiovascular disease; JNC8, Eighth Joint National Committee; MDP, Markov decision process; SBP, systolic blood pressure; SPRINT, Systolic Blood Pressure Intervention Trial; yrs, years.
Model parameters and sources
Model formulation
At each monthly time step t=1,…, T over a patient’s simulated lifetime, the MDP model (online supplementary appendix eText 1) is described with four components: state space (S), action space (A), transition probabilities P(st+1| st, at) and rewards R(s). The cycle length of 1 month was chosen to be in accordance with current clinical guidelines and with the timing of observations for SBP reduction in randomised trials used to inform the model and to capture rapid response in blood pressure to antihypertension medication.6 15
The action space (A) consisted of a finite set of possible actions (treatment decisions). For each state  at time t, three actions,
  , were possible: the patient could stop a medication treatment, remain on the current medication treatment(s) and dose level(s) or change medication treatment (by increasing a dosage of a current medication and/or changing the medication) (online supplementary appendix eFigure 1). The state space S, comprising the states at time t (
 , consisted of demographic information (age, sex, race/ethnicity), the patient’s CVD-related covariates (age-, sex- and race-dependent chronic kidney disease status, type 2 diabetes status, lipid profile and tobacco smoking status) and the patient’s health state. A patient could enter one of seven health states (online supplementary appendix eFigure 2): (a) no CVD history (no history of MI or stroke); (b) adverse medication side effect but no CVD history; (c) acute MI; (d) acute stroke; (e) post-CVD event (survived MI or stroke); (f) adverse medication side effect with a CVD history or (g) dead from any cause. Transition probabilities P(st+1| st, at) for a certain action were determined from the action and the state, which contains a patient’s characteristics (demographic information and CVD-related covariates) in the current state.
The objective of the MDP was to determine the optimal treatment policy for a patient, π∗, that maximised the patient’s expected discounted QALYs over the patient’s simulated lifetime, using a standard 3% annual discount rate (online supplementary appendix eText 1). The MDP determines treatment dosage and medication type tailored to individual patients, accounting for their demographic information and CVD-related covariates, rather than following the current treatment guidelines to treat based on set blood pressure targets (online supplementary appendix eFigure 3).
Input data
Input data for the model were taken from previously validated risk calculations and meta-analyses of randomised trials. The effect of blood pressure medication on lowering SBP was estimated as a function of the number of prescribed drugs and the dosage level (full or half dose) of each drug, using equations from previously published studies.16 In our model, dose levels from 0 (no medication) to 4 (four drugs at full dose) in increments of 0.5 were modelled: thus, for example, a dose of 0.5 means a half dose of one particular medicine, and 1 means a full dose of one particular medicine. Patients were allowed to take up to full doses of four different medicines, given evidence of no incremental benefit and substantial harm from side effects when escalating therapy beyond four full doses (online supplementary appendix eText 2).3
The probability that a person transitioned from healthy to either MI or stroke was based on equations previously validated in several diverse cohorts containing more than 23 000 subjects and subsequently against prospective patient-level data on blood pressure and CVD mortality from more than 1 million adults (online supplementary appendix eText 3).17–21 The equations are a function of the set of covariates: age, sex, race/ethnicity (Centers for Disease Control and Prevention categories of non-Hispanic White, non-Hispanic Black, Mexican American and Other), initial SBP and diastolic blood pressure, total and high-density lipoprotein cholesterol, tobacco smoking status, current treatment with blood pressure medication, type 2 diabetes status and previous history of MI or stroke. Covariate values were updated annually to reflect linear age and secular time trends. The degree to which a given SBP reduction from a medication at a particular dosage reduced the risk of MI or stroke was calculated based on a prior meta-analysis of randomised trials.19 Deaths attributable to MI/stroke and competing risks were taken into account as a function of age and sex (online supplementary appendix eText 4).21 22 The probability of severe adverse events (significant side effects leading to clinically significant disability or hospitalisation) was determined by a prior meta-analysis, specific to patient covariates, blood pressure medication choice and dosage (online supplementary appendix eTable 1).
We simulated 10 000 adults aged 18–85 years old over their lifetimes, by repeated sampling with replacement from the correlated covariates in the National Health and Nutrition Examination Survey (NHANES, 2003–2014, n=74 501). We used NHANES survey weights to generate sampling distributions for each covariate,23 and used multivariate sampling with copulas to capture the correlations among the covariates.24 To estimate untreated blood pressure for those NHANES participants on antihypertensive medication, we back-calculated the pretreatment blood pressure for those reporting current blood pressure treatment, using a previously published procedure.3 To ensure face validity, MI and stroke incidence rates were compared through backwards projection while maintaining current blood pressure medications listed in NHANES to years 2003 and 2014, to compare to estimates from the Atherosclerosis Risk in Communities study, the Greater Cincinnati/Northern Kentucky Stroke Study and independent cohort studies from the National Heart Lung and Blood Institute.20 25 26 The validation exercise showed that the model was within 5% absolute error from actual observed incidence rates of MI and stroke (online supplementary appendix eFigures 4 and 5, eTable 2).
Comparative effectiveness analysis
We compared three treatment strategies: (1) JNC8 based on current US guidelines, targeting blood pressure <140/90 mm Hg for persons with chronic kidney disease or diabetes or persons <60 years old and blood pressure <150/90 mm Hg for persons >60 years old and without chronic kidney disease or diabetes5; (2) Intensive JNC8 (JNC8 modified by results of the recent SPRINT study), specifically lowering SBP to 120 mm Hg among high-risk patients (those with >15% 10-year risk of combined MI and stroke) but using the same blood pressure targets as in JNC8 for others6 15; and (3) an MDP-based treatment (MDPT) strategy that determines optimal medication choices based on the MDP (figure 1). To restrict our analysis to the range of possibilities considered safe and effective, we set the number of blood pressure medications to a maximum of 4 per person, and stopped augmentation of blood pressure treatment if a simulated patient’s SBP fell below 120 mm Hg.3 27
As suggested in JNC8 guidelines, for all treatment strategies, initial blood pressure medication choice included a thiazide, calcium channel blocker (CCB), ACE inhibitor (ACE-I) or angiotensin receptor blocker (ARB) in the general non-Black population or a thiazide or CCB for the general Black population. In the JNC8 and Intensive JNC8 strategies, if the target blood pressure was not reached within 1 month, the dosage of the medication was increased, or another medication was added.
We used two outcome metrics to compare the treatment strategies: (i) total discounted QALYs over the lifetime of each simulated individual; and (ii) the incremental cost-effectiveness ratio of the MDPT strategy versus JNC8 and that of Intensive JNC8 versus JNC8.
Cost-effectiveness analysis
Following current cost-effectiveness guidelines,28 29 costs and QALY estimates were integrated over the life-course for all simulated individuals, starting in 2017. Costs of medications and associated adverse events were obtained from the National Inpatient Sample survey and Red Book (online supplementary appendix eTable 3).30 31 Annual disease-specific healthcare costs and the disutility of disease states and side effects to calculate QALYs were based on large-scale survey data (online supplementary appendix eTable 3).32 33 Costs were expressed in 2017 US Dollars using the Consumer Price Index,34and QALYs were discounted at 3% annually.
Sensitivity and uncertainty analyses
We performed sensitivity analyses to assess key sources of variability in the outcome estimates, specifically by varying disutility weights for disease states: treatment-related disutility (QALYs per medication per year of treatment associated with serious adverse events) was varied from 0.001 to 0.02. The disutility from CVD events (separately for MI and stroke) was varied across the range from 0.5 to 0.9 based on variations observed in patient survey data.3 35–37 We performed uncertainty analyses across all simulations by re-running the full model while repeatedly Monte Carlo sampling with replacement 10 000 times (thus, 10 000 discrete runs) from the probability distributions of all input parameters.38
All analyses were performed in R (V.3.2.1, The R Foundation for Statistical Computing, Vienna), with model code available at Stanford Digital Repository (https://sdr.stanford.edu) concurrent with publication.
Results
MDPT strategy versus JNC8
Over a simulated life-course, the MDPT strategy tended to treat patients more intensively than JNC8 (figure 2). The MDPT strategy prescribed 2.34 (95% CI 2.33 to 2.34) medication doses per person, versus 2.22 (95% CI 2.21 to 2.22) under JNC8 (table 2). The greatest increases in dosages from the JNC8 to the MDPT strategy were among high-risk individuals aged less than 60 years; patients were treated more intensively earlier in life under the MDPT strategy when their initial 10-year CVD risk was higher (figure 2 and table 3). These increases in dosages were more prominent among Blacks (online supplementary eFigure 6). By starting to treat patients more intensively earlier in life based on individual risks and estimated benefits, the MDPT strategy averted more CVD events over the course of life, preventing more intensive treatment requirements later in life and thereby saving QALYs (online supplementary eFigure 7 and table 3).

Treatment dose levels under each treatment strategy. JNC8, Eighth Joint National Committee; MDP, Markov decision process.
Differences in treatment (mean (SE)) and cost-effectiveness analysis
Comparison of MDPT versus JNC8 strategy
Treated individuals experienced 19.03 (95% CI 19.01 to 19.05) and 18.97 (95% CI 18.95 to 18.98) total discounted QALYs per person under the MDPT and JNC8 strategies, respectively. Compared with JNC8, the MDPT strategy gained 0.06 (95% CI 0.04 to 0.08) QALYs per person and was cost-saving with estimated discounted savings of US$1187 (95% CI 1168 to 1206) per person. The QALY gains would be realised largely from averting CVD events among high-risk individuals by treating them earlier with relatively lower treatment dosages than they would have received later in life.
The projected QALY gains were larger among men than women because larger shifts from the JNC8-recommended to MDPT-recommended treatments tended to intensify men’s blood pressure treatments due to their higher risk and higher benefit and, in turn, further reduce men’s MI and stroke risks (online supplementary appendix eFigures 7 and 8).
MDPT strategy versus Intensive JNC8 strategy
The Intensive JNC8 strategy tended to treat patients more intensively later in life than the MDPT strategy (figure 2). Over the course of life, individuals under the Intensive JNC8 strategy received 3.18 (95% CI 3.18 to 3.19) doses on average per person per day as compared with 2.34 (95% CI 2.33 to 2.34) doses under the MDPT strategy. Compared with the MDPT strategy, 63.3% of the simulated population received higher dosages over the course of life under the Intensive JNC8 strategy although the initial 10-year CVD risk of those people was significantly lower than that of people treated more intensively by the MDPT strategy (online supplementary appendix eTable 4). By treating based on individual risks, the MDPT strategy tended to treat patients more intensively earlier in life and less intensively at older ages (figure 2).
The Intensive JNC8 strategy was dominated by the MDPT strategy. Treated individuals under the Intensive JNC8 strategy experienced 0.04 (95% CI 0.02 to 0.06) fewer total discounted QALYs per person than those treated under the MDPT strategy, and at higher costs. By waiting to control blood pressure later in life under the Intensive JNC8 strategy, cumulative exposure to high blood pressure from young adulthood to middle age resulted in higher QALY loss due to CVD events (online supplementary appendix eTable 7).
Medication choices and SBP levels
Among Black populations, CCBs and ARBs were the most prescribed medications as the first and second medications in both strategies. In addition, thiazides and ACE-Is (or beta-blockers and thiazides for people with prior CVD history) were prescribed the most as the third and fourth medications, respectively, in the MDPT strategy (online supplementary appendix eFigure 7).
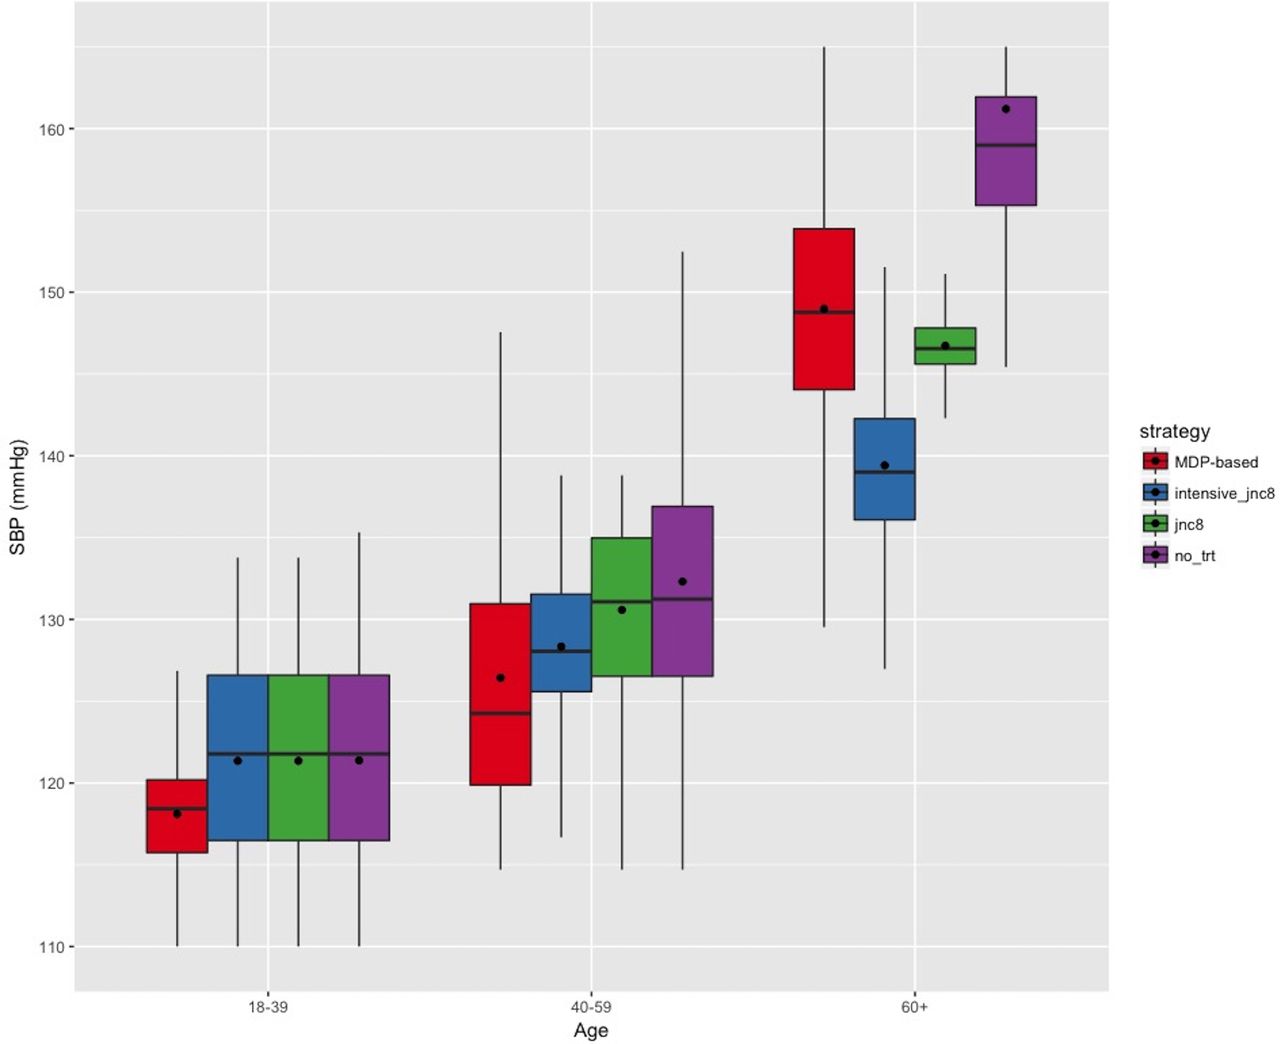
We measured individuals’ SBP levels achieved under each treatment strategy over the simulated period. SBP levels of individuals under the MDPT strategy remained the lowest among individuals aged less than 60 years, at an average of 118.1 mm Hg (95% CI 117.6 to 118.6) in patients aged 18–39 years old and 126.4 mm Hg (95% CI 125.6 to 127.2) in patients aged 40–59 years old (figure 3). For patients older than 60 years old, SBP levels were lowest under the Intensive JNC8 strategy, 139.4 mm Hg (95% CI 138.8 to 140.0) as compared with 148.9 mm Hg (95% CI 148.0 to 149.8) under the MDPT strategy.
Mean SBP levels of individuals achieved under each treatment strategy. JNC8, Eighth Joint National Committee; MDP, Markov decision process; SBP, systolic blood pressure; trt, treatment.
Results of sensitivity analyses
None of the sensitivity analyses substantially changed our fundamental finding of benefits and cost-savings from the MDPT strategy compared with the Intensive JNC8 and JNC8 strategies (online supplementary appendix eFigures 10 and 11). The QALY weight for the adverse event states in our base-case analysis was 0.999, which is a conservative estimate for serious adverse effects of treatment.3 36 When we varied adverse event state QALY weights from 0.98 to 0.999, the lowest estimated QALY gain from the MDPT strategy compared with the JNC8 strategy was 41.0 (95% CI 21.4 to 60.6) QALYs per 1000 persons (online supplementary appendix eFigure 10). When a QALY weight of 0.98 was assumed for the adverse event states, treated individuals under the Intensive JNC8 did not experience significantly different QALYs than JNC8. With lower QALY weights for adverse events, patients with a CVD history did not have substantially different dose levels under the MDPT strategy (online supplementary appendix eFigure 10), but patients without CVD history had lower dose levels than under Intensive JNC8 and JNC8.
Next, we varied MI and stroke QALY weights from 0.5 to 0.9 for either or both of the disease states. The QALY gains from the MDPT strategy compared with the JNC8 strategy ranged from 56.7 (95% CI: 36.4 to 75.6) to 59.0 (95% CI 39.4 to 78.6) QALYs per 1000 persons for MI and from 56.0 (95% CI 37.1 to 76.3) to 61.0 (95% CI 41.4 to 80.6) QALYs per 1000 persons for stroke (online supplementary appendix eFigure 10). Treatment dose levels were not significantly affected by varying QALY weights for adverse events, stroke or MI (online supplementary appendix eFigure 11).
Discussion
Personalising medical decisions will require considering an increasingly complex variety of individual-level covariates, treatment effect modifiers and risks and benefits of treatment alternatives. Personalising decisions is recommended by current CVD management guidelines, as with guidelines for many other conditions, but how to operationalise such guideline statements remains unclear because guidelines generally recommend therapy based on broad categories of features rather than the complex combinations of features that any individual would have.39 As a result, simple rules of thumb (such as specific blood pressure levels or medication of choice for all people with diabetes) are favoured by physicians due to the burden of performing complex risk/benefit calculations at each step of the treatment decision-making process.3 40Personalising decisions may therefore be made more optimal through the use of automated computational strategies to incorporate individual patient data into individualised treatment recommendations. While several studies have previously suggested that blood pressure therapy should involve calculations of patient risks and benefits, using a Markov simulation model, this is the first time—to our knowledge—that a systematic, comprehensive and automated calculation approach has been proposed to achieve this objective by incorporating patient heterogeneity in risk factors and responses to treatment (probabilistically) and recommending detailed treatment suggestions (doses and types of medication).3 4 From a clinical perspective, our analysis advances the current treatment guidelines beyond the decision of whether to treat high blood pressure because both type and dosage of medication are critical decision points.5 41
We developed an MDP-based model to optimise treatment of blood pressure medication and dose selection, based on currently best-available meta-analytic data and risk calculations. While there remains considerable uncertainty in any model-based treatment selection, we found that even when repeatedly sampling over uncertainty ranges of blood pressure treatment benefit and risk, a substantial improvement could be made over current blood pressure management guidelines not only for individuals but also for the overall population. Our study suggests that initiating blood pressure management earlier for young and middle-aged adults with prehypertension substantially reduces MI and/or stroke occurrences over the course of life; the cumulative QALY benefit from the MDP-based approach was primarily from long-term chronic outcomes of high blood pressure leading to long-term sequelae of MI and strokes. This is particularly notable in light of doubts that personalised medicine can improve population health.31 42 We open-sourced our code to permit replication and extension to other disease processes that similarly involve risk/benefit calculations among a large number of potential treatments with different treatment effects and side effect probabilities among different types of patients, as is currently the case with type 2 diabetes, cancer and HIV.43 44
As with any modelling exercise, our study is limited by the quality of its input data and assumptions. First, we modelled the effects of blood pressure treatment medication based on published data, assuming that the health benefits of medications were mediated through changes in blood pressure as per current physiological understanding. Second, we used data from NHANES, which are subject to the limitations of survey studies, including recall biases, acceptability biases and under-reporting that may lead to mis-estimation of baseline covariates and limits the analysis to the civilian (non-institutionalised) US population.45 Third, we did not incorporate compliance/adherence parameters in the model because our purpose in this model is to compare how a change in guidelines from the current guidelines to the MDP-based strategy would affect overall population-level outcomes under the ideal treatment condition. Adding in a compliance/adherence parameter would simply linearly scale the outcomes to the proportion of patients who adhere, unless we have further data from (not yet extant) randomised trials suggesting that patients would adhere differently to treatment regimens found using the MDP-based approach than to regimens identified under the current guidelines. We suggest that such randomised trials and real-world studies should be performed now that a proof-of-concept model is available, to gather empirical data comparing adherence rates and observed outcomes between the MDP-based and current guideline approaches. Fourth, although we performed uncertainty analyses by sampling from distributions around the input parameter data sources, we cannot capture all possible uncertainties in the model. We focused on MI and stroke because of high-quality, validated risk equations for predicting these outcomes and their risk reduction through therapy. Although congestive heart failure and kidney diseases may also be averted, we did not model them due to the lack of robust and validated risk equations; however, their impact is considered proportional to the impact on MI and stroke3 and, thus, should not affect our comparative effectiveness analysis. Ignoring these potential benefits makes our cost-effectiveness estimates conservative. Fifth, one of the largest ongoing debates in personalised medicine is the fact that model-based personalisation may offer incremental gains beyond large standardised guidelines, but at the risk of producing a ‘black box’. A larger discussion must take place in the literature about the benefits and risks of such model-based personalisation before such measures are considered for practice. A next logical step for research is to perform a head-to-head randomised pilot trial to compare usability, interpretability, patient and provider reactions and patient safety of current guidelines versus our personalised blood pressure treatment selection tool. We note that the result of a small gain in QALYs is expected in the case of blood pressure treatment because only a small subset of patients experience a CVD event; this gain, although small, is cost-saving from a societal perspective. Lastly, we chose MDP over other reinforcement learning approaches due to its simplicity and flexibility. Perfect knowledge about a patient’s states under MDP is a strong assumption, but we chose to use MDP since it is often tractable to solve (exact solution) and relatively easy to specify and because CVD health states are objectively observable by clinicians under nearly all circumstances (unlike with some other diseases).46–50 Partially observed MDPs (POMDPs) are more complex than MDPs and are often computationally intractable. The use of POMDP for determining personalised blood pressure treatment guidelines, which may yield a more realistic but less tractable model, is an area for future research.
The next logical step for analysis is to prospectively test the MDP-based model in clinical settings to identify safety, adoptability and impact on patient outcomes. Existing clinical guidelines are typically easy for clinicians to interpret because they involve univariate decisions. To make use of the MDP-based approach, clinicians would need to shift conceptually from a univariate to a multivariate decision process as well as accept computationally complex ‘black box’ results (as they do currently with some imaging and pathological diagnostic guidelines). An additional logical step for future research is to identify whether QALY values covary meaningfully among individuals as a function of their risk, age and prior treatment. Use of personalised QALYs would enable more personalised decision-making rather than assuming that QALY weights of CVD outcomes or serious adverse events are consistent across the population. For example, some persons may favour lower risk of side effects than CVD events if they are concerned about short-term suffering rather than long-term mortality (eg, if they are near the end of life).
While these remain important topics for future research, our current findings indicate that blood pressure treatment policies informed by a Markov decision process framework may improve patient outcomes compared with the use of standardised target-based guidelines, by accounting for individual patient covariates in treatment decision-making processes, and are likely to be cost-saving compared with current guidelines.
References
Footnotes
Contributors SEC, MLB and SB: study conception and design, analysis and interpretation of data, and critical revision of the manuscript. SEC and SB: statistical analysis, acquisition of data and drafting of the manuscript. SB obtained funding.
Funding Research reported in this publication was supported by the National Heart, Lung and Blood Institute and National Institute on Minority Health And Health Disparities of the National Institutes of Health under award numbers K08HL121056 and DP2MD010478.
Disclaimer The content is solely the responsibility of the authors and does not necessarily represent the official views of the National Institutes of Health.
Competing interests None declared.
Provenance and peer review Not commissioned; externally peer reviewed.
Data sharing statement No additional data are available.