Article Text

Abstract
Background There is considerable evidence of the favourable role of more physical activity (PA) in fighting against dementia. However, the shape of the dose–response relationship is still unclear.
Objective To quantitatively investigate the relationship between dementia and PA.
Design PubMed, EMBASE, Ovid and the Cochrane Library were searched for prospective studies published from 1 January 1995 to 15 October 2016. Two types of meta-analyses were performed with a focus on the dose–response relationship using two stage generalised least squares regression.
Results The primary analysis exhibited a dose–response trend for all-cause dementia (ACD), Alzheimer’s disease (AD) but not for vascular dementia (VD). In the dose–response analysis, either ACD (ptrend <0.005; pnon-linearity=0.87) or AD (p trend <0.005; pnon-linearity=0.10) exhibited a linear relationship with leisure time PA (LTPA) over the observed range (0–2000 kcal/week or 0–45 metabolic equivalent of task hours per week (MET-h/week)). Specifically, for every 500 kcal or 10 MET-h increase per week, there was, on average, 10% and 13% decrease in the risk of ACD and AD, respectively.
Conclusions We have reported, for the first time, the dose–response relationship between LTPA and dementia, further supporting the international PA guideline from the standpoint of dementia prevention.
- dementia
- physical Activity
- alzheimer
- dose-response
This is an Open Access article distributed in accordance with the Creative Commons Attribution Non Commercial (CC BY-NC 4.0) license, which permits others to distribute, remix, adapt, build upon this work non-commercially, and license their derivative works on different terms, provided the original work is properly cited and the use is non-commercial. See: http://creativecommons.org/licenses/by-nc/4.0/
Statistics from Altmetric.com
Strengths and limitations of this study
Except for meta-analyses of highest versus lowest category, a dose–response design was used based on prospective studies.
The pooled results showed good consistency and evidence of a linear dose–response gradient.
Restricted by the observed dose, it is necessary to further evaluate the association between dementia and leisure time physical activity over an expanded range.
We did not analyze other types of physical activity (PA), such as housework, occupational PA or commuting -related PA.
Introduction
Dementia is a common neurodegenerative disease and its prevention has increasingly become the focus of the field, which to the best of our knowledge is attributed to three main reasons: (1) no cure or effective therapy is available for dementia; (2) the situation has been publicly highlighted, especially by the World Alzheimer Report 2015, reporting that over 46 million people live with dementia and the number is estimated to double every 20 years; (3) several lines of evidence showed that improved cognition and lowered dementia risk might be achievable via self-managing modifiable risk factors.1–3 This hypothesis has been encouragingly supported by epidemiological findings that the prevalence or incidence of dementia in Europe and the USA has stabilised or may even be declining.4 5
Physical activity (PA) is a common modifiable risk factor and it has been indicated that PA is negatively associated with the risk of dementia,6–13 although some reported no association,14 15 probably due to the heterogeneous methodologies and categorisation. Several international guidelines concerning PA have been developed based on pre-existing epidemiological evidences concerning chronic non-communicable diseases.16 17 Guidelines from the USA and the WHO recommend that adults do at least 150 min of moderate intensity aerobic PA or 75 min of vigorous intensity aerobic PA or an equivalent combination every week, and to double it for additional benefits.16 Recently, ‘Healthy Japan 21’ has proposed a project named ‘+10 min of PA per day’, calling on adults to perform 60 min of moderate to vigorous PA every day.17 Nonetheless, we know little about the dose–response relationship between dementia and PA, and to what extent the amount of PA in guidelines is effective in lowering the risk of dementia.
Thus we conducted a dose–response meta-analysis to quantify the association between dementia and PA, with a specific focus on leisure time PA (LTPA) (eg, sports, exercises, recreational activities or activities excluding occupational and commuting activities).
Methods
Search strategy
According to the recommendations of the Meta-analysis Of Observational Studies in Epidemiology (MOOSE) Group and the PRISMA 2009 guidelines (see the online supplementary file 1, table 1),18 19 we searched PubMed, EMBASE, Ovid and the Cochrane Library from 1 January 1995 to 15 October2016. The 1995 cut-off was chosen to reflect possible changes in PA categorisation in analyses since publication of the 1995 US Centers for Disease Control and Prevention/American College of Sports Medicine guideline.20 We used the following key words, among others, for searching: physical activity, walking, exercise, exercise training, fitness, dementia, Alzheimer, prospective, cohort (see online supplementary file 1, table 2). No restrictions were imposed except that the language was limited to English. Bibliographies of eligible studies and relevant meta-analyses were hand-searched for potentially omitted studies (figure 1).
Supplementary file 1

Flowchart of studies included and excluded. DR, dose–response, LTPA, leisure time physical activity.
Selection criteria
The inclusion criteria were as follows: (1) the study is a prospective cohort or prospective nested case -control study; (2) the study investigated the association between dementia (all-cause dementia (ACD), Alzheimer’s disease (AD) or vascular dementia (VD)) and PA; (3) PA is categorised into ≥3 layers, which can be reflective of the dose–response trend; (4) the study reported multi-adjusted level-specific relative ratio (RR), 95% confidence interval (CI) and, for the dose–response analysis, the level-specific case number and person-years or sufficient data for driving these numbers. Studies were excluded if they failed to meet any criteria detailed above. Additionally, if multiple articles were published based on the same cohort, we chose that with the longer follow-up or a larger sample size. Two investigators independently made the inclusion decisions and any controversies were resolved by discussion.
Data extraction and quality evaluation
Using a standardised sheet, two investigators independently extracted the data for each study, including the first author, publication year, cohort name, region (eg, Northern America, Europe, Africa), sample source (eg, community or database), gender (men, women or combined), age and health condition at baseline, follow-up, case number, sample size and person-years stratified by PA, diagnostic criteria, method of assessing PA, PA type (eg, LTPA, occupational PA, walking or mixed PA), amount of PA, unit (eg, kcal/week, metabolic equivalent task-hours per week (MET-h/week)), duration (hours) of specific intensity of PA per week (h/week) and frequency (times/week)), adjusted confounders and multi-adjusted RR and 95% CI (see online supplementary file 2). The study was evaluated using the Newcastle–Ottawa Quality Assessment Scale, which allowed a total score of up to 9 points and only studies with ≥7 points were further included.
Supplementary file 2
Statistical analysis
Two types of meta-analyses were performed using the random effect model.21 First, summary RR and 95% CI for ‘highest versus lowest’ and ‘the second lowest versus lowest’ were calculated and compared to primarily evaluate whether a dose–response trend existed between dementia (ACD, AD and VD) and PA (irrespective of type). Next, a dose–response analysis was performed according to PA unit (MET-h/week and kcal/week) using two stage generalised least squares regression according to the method by Greenland and Longnecker22 and Orsini et al.23 More specifically, at the first stage, we examined a potential non-linear association between PA and dementia using study-specific restricted cubic spline models with four knots at fixed percentiles (5%, 35%, 65% and 95%) of the exposure distribution. At the second stage, the study specific estimates and the variance/covariance matrix (person years and cases) that had been estimated within each study were combined. The overall significance of the curve was examined by testing the joint effect of the spline transformations. A non-linear relationship was explored by testing the null hypothesis that the regression coefficients of the spline transformations were all equal to 0, as described in our previous study.24 However, we were only able to apply generalised least squares regression methods to assess LTPA as there were too few (≤2) studies eligible for quantitative estimates of other types.
Data transformations were performed as the reference category is supposed to be the least exposure and the PA unit unified in the dose–response analysis. For studies where the reference group was not the lowest category, we regarded the lowest as the reference and recalculated the effect size (RR and 95% CI) using the method by Orsini et al.25 Further, ‘kcal/week’ and ‘MET-h/week’ were viewed as analytic units, both of which are comprehensive indexes as they incorporate intensity, duration and frequency. ‘MET’ is a physiological index describing the energy cost of PA and is defined as caloric expenditure per kilogram of body weight per hour of activity (see the formula below).

To resolve the difference in PA units in different studies, we adopted the classification of Ainsworth et al 26 to categorise PA into low (1.6–2.9 METs), moderate (3–<6 METs) and vigorous (≥6 METs) intensity (we used here the mean value, eg 4.5 METs for moderate intensity), by which we converted the duration of specific intensity PA (h/week) to MET-h/week. On the other hand, 150 min of moderate intensity PA is estimated by Sattelmair et al 27 to be roughly equivalent to 550 kcal for both genders combined. Accordingly, we conducted mutual transformation between kcal/week (Y) and MET-h/week (X).

In one study by Tolppanen et al,13 LTPA was assessed with the question: ‘How often do you participate in leisure time physical activity that lasts at least 20–30 min and causes breathlessness and sweating?’ It had been reported that ‘exercise vigorous enough to work up a sweat’ is equivalent to 30 min of moderate to vigorous intensity PA,28 for which we used 7 METs as a proxy according to Sattelmair et al.27 Otherwise, for those included in the dose–response analysis, the median or mean PA level for each category was assigned to each corresponding RR. When unavailable, we assigned the midpoint of the upper and lower boundary in each category as the mean PA level. For studies with an open ended upper boundary (eg, >8090 kcal/week or ≥3 times), we multiplied the given upper boundary by 1.25 and used this value (10 113 kcal/week or 3.75 times in the example). For studies that reported PA by frequency (times/week),7 we converted the frequencies to hours per week by assigning a dose of 45 min per session,29 according to the estimated mean duration of activity per session from the HUNT study.30
The heterogeneity among studies was assessed by Q test and I2 statistic31 with a significance level of p<0.05. I2 values with cut-offs of 30% and 50% are considered to indicate low (<30%), moderate (30–50%) and high (>50%) heterogeneity, respectively. Publication bias was evaluated using the Egger test, and where statistically significant bias was found, the trim and fill method was used to adjust it. In addition, we further conducted multiple subgroup analyses to explore the source of heterogeneity and to assess the potential interaction of study characteristics, including age, sex, geographic region, Newcastle–Ottawa Quality Assessment Scale scores, follow-up rate and duration, diagnosis criteria, sample size, PA unit, adjusted confounders (apolipoprotein E4 (APOE4), body mass index (BMI) and cardiovascular condition) and PA type (mixed PA, LTPA and walking). All statistical analyses were conducted using Stata V,12.0 (StataCorp, College Station, Texas, USA), with two tailed p<0.05 for statistical significance.
Results
Figure 1 shows the procedure for literature searching. A total of 14 198 English papers were found after de-duplication; 13 905 were excluded after reviewing the titles and abstracts, leaving 293 papers, among which 283 were full text available and the other 10 abstracts were reviewed and were not found to meet the inclusion criteria. Another seven potential papers were further identified from the references of relevant reviews. After a quick screening of the full text articles, 49 were considered potentially eligible and were included for detailed evaluation, after which 34 were finally excluded (see online supplementary file 1, table 3) and a total of 16 studies (15 for ACD, 8 for AD and 4 for VD) were included for the primary analysis and five studies for the dose–response analysis (4 for ACD and 4 for AD).
Description of studies included
Fifteen studies (10 in Europe,8 10–14 32–35 4 in Northern America7 9 15 36 and 1 in Africa37) with 37 436 participants for ACD (table 1), 8 studies (4 in Europe8 10 14 34 and 4 in Northern America6 7 9 15) with 25 031 participants for AD (table 2) and 4 studies (2 in Europe10 34 and 2 in Northern America7 15) with 16 797 participants for VD were included in the primary analysis. During follow-up (3–31.6 years for ACD, 3.9–31.6 years for AD and 4–11.9 years for VD), at least 2665 (as case number was not given in two studies11 12), 1337 and 343 participants who were not suffering from dementia at baseline were diagnosed with ACD, AD and VD, respectively. Four studies (2 in Europe and 2 in Northern America) with 9149 participants for ACD and 4 studies (1 in Europe and 3 in Northern America) with 9144 participants for AD were included in the dose–response analysis. During follow-up (3.9–28.3 years for ACD and 3.9–5.5 years for AD), 1026 and 692 participants who were not suffering from dementia at baseline were diagnosed with ACD and AD, respectively.
Characteristics of studies included in the meta-analysis for all-cause dementia
Characteristics of studies included in the meta-analysis for Alzheimer’s disease
The quality of the studies included was globally acceptable. There was concern of selection bias in three studies,12 13 33 comparability in three studies7 10 37 and outcome in nine studies.6–8 11–13 33 34 37 (see online supplementary file 1, table 4).
Primary analysis and subgroup analysis
In the primary analysis, we observed a dose–response trend for ACD (figure 2A,B), AD (figure 2C,D) but not for VD (data not shown). Specifically, for either ACD or AD, higher levels of PA (RR 0.73, 95% CI 0.62 to 0.87, moderate heterogeneity for ACD; and RR 0.74, 95% CI 0.58 to 0.94, moderate heterogeneity for AD) would play a larger role in reducing dementia risk than lower levels of PA (RR 0.79, 95% CI, 0.66 to 0.93, high heterogeneity for ACD; and RR 0.80, 95% CI 0.69 to 0.94, low heterogeneity for AD) (figure 2). Only the primary analysis for ACD (n=15) was eligible for analysis for publication bias while the number of studies included in other analyses was small (n<10). No publication bias was revealed by intuitive judgement of funnel plot and contour enhanced funnel plot, and statistical test (Egger test, p=0.260).

Primary analysis for Alzheimer’s disease (AD) and all-cause dementia (ACD). The summary result showed a more significant decrement in ACD or AD risk for high amounts of physical activity (PA) (RR 0.75, 95% CI 0.63 to 0.89 for ACD (A) and RR 0.72, 95% CI 0.58 to 0.90 for AD (C)) than low amounts of PA (RR 0.78, 95% CI 0.66 to 0.93 for ACD (B) and RR 0.80, 95% CI 0.67 to 0.95 for AD (D)).
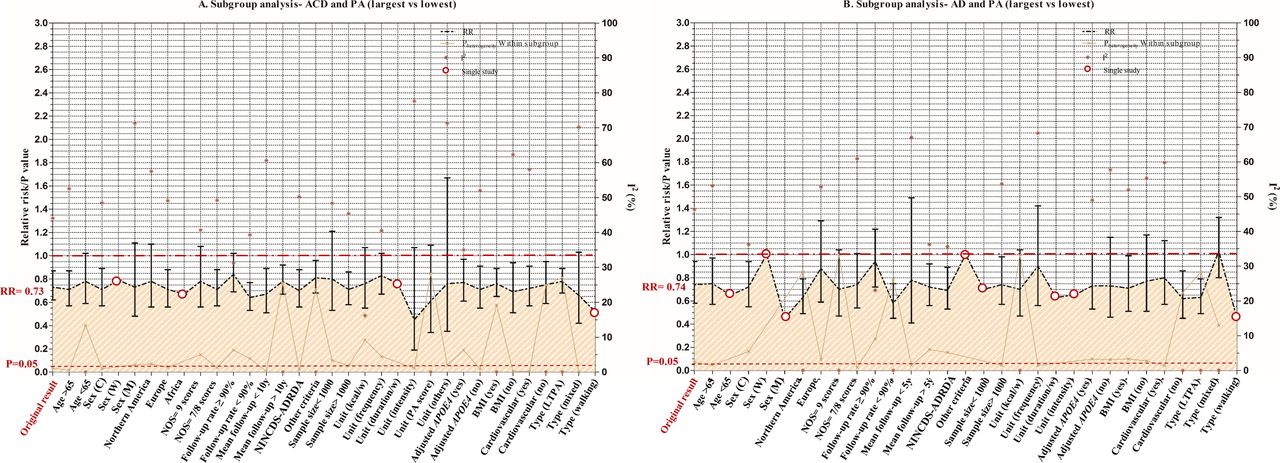
The constrained data precluded thorough subgroup analyses for the dose–response analysis. Instead, subgroup analyses were performed for the highest versus lowest to explore the source of heterogeneity (see online supplementary file 1, table 5) The inverse association between ACD or AD and PA was highly statistically significant in most subgroups (figure 3).

Subgroup analysis for all-cause dementia (ACD) (A) and Alzheimer’s disease (AD) (B). The inverse association of ACD or AD with physical activity (PA) was highly statistically significant in most subgroups.
For ACD, there was heterogeneity between subgroups by follow-up rate (p=0.029). The inverse association became non-significant when the follow-up rate was >90%, suggesting that loss to follow-up is an important influencing factor. Adjusting for APOE4, BMI and cardiovascular conditions did not influence the statistical significance. The inverse association of ACD was statistically significant for LTPA (RR 0.78, 95% CI 0.68 to 0.89, low heterogeneity) but not for mixed PA (RR 0.66, 95% CI 0.42 to 1.03, high heterogeneity) (see online supplementary file 1, table 5). For AD, there was heterogeneity between subgroups by follow-up rate (p=0.004), region (p=0.015) and PA type (p=0.006). The association of AD was also statistically significant only for LTPA (RR 0.63; 95% CI 0.49 to 0.79, low heterogeneity) but not for mixed PA (RR 1.03; 95% CI 0.80 to 1.32, low heterogeneity) (see online supplementary file 1, table 6).
Only the primary analysis for ACD (n=15; see online supplementary table 4) was eligible for analysis for publication bias while the number of studies included in other analyses was small (n<10). No publication bias was revealed by intuitive judgement of funnel plot (A) and contour enhanced funnel plot (B), and statistical test with the Egger test (C, p=0.260) (see online supplementary file-1, figure 1)
Dose–response analysis
Five studies were included in the dose–response analysis,6 7 13–15 among which four6 7 13 15 reported mean LTPA level that varied from 0 to 2000 kcal/week or 45 MET-h/week. One study14 reported mixed PA (including LTPA and walking) with the upper limit surpassing 10 000 kcal/week or 200 MET-h/week (see online supplementary file 2) Thus we first conducted the dose–response analysis of four studies to investigate the relationship of PA (irrespective of type) over a larger range (see online supplementary file 1, table 7) Next, we independently analysed the three studies that reported LTPA over a specific range of 0–2000 kcal/week or 0–45 MET-h/week.
By kcal/week, over 0–10 000 kcal/week, a significant linear relationship between ACD and PA was established (p for heterogeneity=0.09; p for non-linearity=0.2), with a 4% decrease (95% CI 0.94 to 0.99) of ACD risk per 500 kcal/week increment (see online supplementary file 1, figure 2A). Nevertheless, the relationship for AD appeared to be non-linear (p for heterogeneity=0.19; p for non-linearity=0.03), with the slope flattening at 1000 kcal/week (see online supplementary file 1, figure 2B). Otherwise, over 0–2000 kcal/week, either ACD (p for heterogeneity=0.1; p for non-linearity=0.87) or AD (p for heterogeneity=0.14; p for non-linearity=0.1) showed a linear relationship with LTPA. For every 500 kcal/week increase, the decrement in risk was 10% (95%CI 0.85 to 0.97) for ACD (figure 4A) and 13% (95%CI 0.79 to 0.96) for AD (figure 4C).

By kcal/week, over the observed range of 0–2000 kcal/week, either all-cause dementia (ACD) (p for heterogeneity=0.1; p for non-linearity=0.87) or Alzheimer’s disease (AD) (p for heterogeneity=0.14; p for non-linearity=0.1) showed a linear relationship with leisure time physical activity (LTPA). Per 500 kcal/week LTPA increase, the decrement in risk was 10% (95% CI 0.85 to 0.97) for ACD (A) and 13% (95% CI 0.79–0.96) for AD (C). By metabolic equivalent of task hours per week (MET-h), over the observed range of 0–45 MET-h/week of LTPA, a significant linear association for ACD (p for heterogeneity=0.11; p for non-linearity=0.86) or AD (p for heterogeneity=0.14; p for non-linearity=0.10) was identified, with the summary RR for each 10 MET-h/week increase of 0.91 (95% CI 0.85 to 0.97) (B) and 0.87 (95% CI 0.79 to 0.96) (D). Our findings are also supportive of the international physical activity (PA) guidelines (B,D). Filled circles are RRs corresponding to comparison categories in studies in Northern America; open circles are for studies in Europe. Size of circle is in proportion to sample size for each comparison group.
By MET-h, over 0–200 MET-h/week, it was indicated that a linear relationship existed between PA and ACD risk (p for heterogeneity=0.07; p for non-linearity=0.2) and a non-linear association between PA and AD risk (p for heterogeneity=0.19; p for non-linearity=0.03). The summary RR of ACD per 10 MET-h/week increase was 0.96 (95% CI 0.94 to 0.99) in the linearity analysis (see online supplementary file 1, figure 2C) while the curve of AD risk flattened at roughly 20 MET-h/week in the non-linearity analysis (see online supplementary file 1, figure 2D). On the other hand, over 0–45 MET-h/week of LTPA, a significant linear association for ACD (p for heterogeneity=0.11; p for non-linearity=0.86) or AD (p for heterogeneity=0.14; p for non-linearity=0.10) was identified, with the summary RR for each 10 MET-h/week increment of 0.91 (95% CI 0.85–0.97) (figure 4B) and 0.87 (95% CI 0.79–0.96) (figure 4D).
Further, we examined the influences of amount of PA recommended by some international institutions (USA, WHO and Japan), as described in the Introduction above. We found that individuals who met the minimum guideline recommended LTPA levels (so-called basic dose ≈11.25 MET-h/week) had a 10% lower risk of ACD (95% CI 0.83 to 0.96) (figure 4B) and a 14% lower risk of AD (95% CI 0.77 to 0.95) (figure 4D), and that those who met the advanced guideline (≈22.5 MET-h/week) had a 20% lower risk of ACD (95% CI 0.69–0.93) (figure 4B) and a 27% lower risk of AD (95% CI 0.59–0.91) (figure 4D) compared with those who had sedentary lifestyles.
Discussion
PA is one of the most feasible interventions that people can take as a preventative practice against dementia. Our study identified that LTPA over a specific range (0–2000 kcal/week or 0–45 MET-h/week) was associated with a risk of dementia and AD in an inverse linear dose–response manner, such that an increase in LTPA by 10 MET-h/week or 500 kcal/week was associated with a ~13% and ~ 10% decrease in the risk for AD and dementia, respectively. In accordance with our results, a recent systematic review and meta-analysis of longitudinal studies also found that PA confers more protection against Alzheimer’s dementia than for other types, such as ACD and VD.38 Our findings are meaningful given that: (1) for the first time a linear relationship between LTPA and dementia has been reported, (2) the results are supportive of the international PA guidelines from the standpoint of dementia prevention and (3) the results will be greatly favourable to future work on dementia prevention, especially for formulating prevention guidelines as well as constructing predicative tools for assessing dementia risk in the twilight years.
At the Alzheimer’s International Conference 2016, it was highlighted that aerobic activity played a significant role in protecting our cognition. There are several potential mechanisms by which PA might act on dementia risk. First, as a hub factor, PA may act by influencing other risk factors for dementia, such as BMI, cardiovascular conditions (coronary heart disease, hypertension and stroke), cancer, diabetes mellitus type 2 and depression.29 39–41 Second, animal experiments have suggested that PA might contribute to increased neurogenesis, angiogenesis, synaptic plasticity, better cardiovascular conditions and lessened cerebral accumulation of Aβ.42 Third, human studies have indicated that adhering to aerobic activity for over 6 months can increase the hippocampal volume and improve memory function.43 Fourth, a gene–environmental interaction for PA has been revealed, such that the association between PA and dementia might be modified by genetic components, such as APOE444 and BDNF gene.45
There are several limitations. First, although the association between PA and AD became non-linear when the range in the amount of PA was extended, linearity stabilised for ACD. Also, due to the restriction of the observed amount of LTPA, further investigations warrant quantitative association between dementia and LTPA over an extended range. Second, we did not analyse other types of PA, such as housework, occupational PA, walking or commuting, due to data restrictions. Third, estimating PA level with subjective methods (such as self-reported answers to questionnaire) is a potential source of measurement error. In the present study, all studies included used a subjective approach to assessing PA level. Although objective recording methods, such as actigraphy, have been applied in research, no such longitudinal study has used this technology to date. Fourth, we did not conduct the dose–response analyses by gender, region or other study characteristics due to the constrained number of eligible articles in the literature. Fifth, studies with binary variables of PA (see online supplementary file 1, table 3) were excluded in both types of meta-analyses as we aimed to explore the dose–response trend. However, we have made comparison with the results of meta-analyses including those studies.
Conclusions
Either dementia or AD exhibited a linear relationship with LTPA over the observed range (0–2000 kcal/week or 0–45 MET-h/week). For every 500 kcal or 10 MET-h increase per week, there was an approximate 10% and 13% decrease in the risk of ACD and AD, respectively. Our findings are also supportive of some international PA guidelines.
Acknowledgments
The authors thank Jeff and Long Cui for help with improving the language of the manuscript. The authors also express gratitude to Professor Peters for analysis of the publication bias.
References
Footnotes
Contributors WX and J-TY prepared the research protocol and drafted the manuscript. LT and J-TY reviewed the statistical analyses. H-FW, C-CT, YW, LT and J-TY made substantial contributions to the manuscript. All authors read and approved the final version of the manuscript.
Competing interests None declared.
Provenance and peer review Not commissioned; externally peer reviewed.
Data sharing statement Extra data can be accessed via the Dryad data repository at http://datadryad.org/ with the doi:10.5061/dryad.6mj52.