Article Text

Abstract
Objectives To calculate the prevalence of disabling chronic pain (DCP) and to offer a more representative and accurate estimation by applying different calibration techniques.
Settings 2011 Andalusian Health Survey, a cross-sectional population survey based on face-to-face home interviews.
Participants 6507 people aged 16 years or older and living in Andalusia, Spain.
Outcomes Design weights, linear calibration based on marginals and on crossings, and model-assisted calibration were used to estimate the prevalence and variance of DCP, for the whole sample and for the domains of sex and age groups (16–44; 45–64; +65).
Results Calibration variables were sex, age groups and educational level. In the whole sample, DCP prevalence calibration reduced by more than 5.2% and 8.2% the estimated prevalences and variances, respectively, obtained with the design weights. Regarding the domains, prevalence reductions are from 33% to 1%, and variance reductions are from 0.2% to 1%. Model-assisted calibration is the best technique to estimate DCP prevalence for the whole population and crossing calibration for their domains, although with almost no differences compared to marginal calibration.
Conclusions The validity and accuracy of estimations of DCP prevalence are improved by calibration adjustments. Model-assisted calibrated prevalence of DCP is 10.78% for the whole population, being at least 2-fold higher in women in all age groups. The results and methodology developed could be useful in clinical and population-based studies on chronic pain and disability.
- Chronic pain
- disability
- cross-sectional studies
- indirect estimation techniques
This is an Open Access article distributed in accordance with the Creative Commons Attribution Non Commercial (CC BY-NC 4.0) license, which permits others to distribute, remix, adapt, build upon this work non-commercially, and license their derivative works on different terms, provided the original work is properly cited and the use is non-commercial. See: http://creativecommons.org/licenses/by-nc/4.0/
Statistics from Altmetric.com
Strengths and limitations of this study
All the calibration approaches applied in our study adjusted estimations of disabling chronic pain prevalences as well as reduced the estimated variances.
The methodology developed could serve as a model to be applied in other epidemiological studies.
The source of data used, the Andalusian Health Survey, is a very complete, intensive and large population survey based on face-to-face interviews with more than 6500 adults.
Survey limitations detected in the present study include the need to add various traumatological, postsurgical and neuropathic conditions.
It would be preferable to gather direct data on chronic pain with a simple question and also information about the onset of chronic pain as well as its intensity.
Introduction
Estimations of the prevalence of chronic pain (CP) have varied widely among studies, mainly due to differences in the definition, study population, design, sample size and/or data-gathering procedure.1–4 Thus, recent calculations of CP prevalence among adults (+18 years) have ranged between 12% and 42% worldwide.2–8
When the CP causes disability (disabling chronic pain, DCP), deterioration of health is greater.9–13 The WHO includes disability-related activities of daily living limitations within the ‘International Classification of Functioning, Disability, and Health’ (ICF model).14 This biopsychosocial model considers disability as a state of impaired functioning associated with disease, disorder, lesion or other health conditions that is experienced as a deficiency, a limitation on activity or a restriction on participation in any area of life.
One of the most used techniques to make the estimation of prevalence more valid and accurate is calibration.15 This statistical method offers a general framework for weighting that provides a simple and practical approach for incorporating auxiliary information into the estimation. Calibration adjustments can be used to extrapolate the estimations of a survey, as in this study, with the weightings providing sample ‘estimates’ for the totals of the auxiliary variables that match known population totals for these variables.16 In this way, the usage of calibration estimators ensures that survey estimates are coherent with those already in the public domain, while simultaneously reducing sampling error and non-coverage or non-response bias.17 Several national statistical agencies have developed software designed to compute weightings, usually calibrated in accordance with the auxiliary information available in administrative records and other reliable sources.18
The objective of this study was to calculate the prevalence of DCP and to offer a more representative and accurate estimation by applying different calibration techniques.
Materials and methods
Design
The information source was the Andalusian Health Survey (EAS, Spanish acronym, fourth edition, 2011), a population-based cross-sectional survey,19 designed to evaluate the health of non-institutionalised adults (+16 years) in Andalusia (southern Spain) and their usage of health services.
Sample and data collection
A multistage stratified sample design was adopted. In total, 6507 valid personal face-to-face home interviews were conducted (p=q=0.5; confidence level=95%; precision=0.0149; design effect=1.525), with a response rate of 67.9%.
Variables
The dependent variable was DCP defined as individuals who declared being limited in their activity by any of the following CP: ‘migraine/headache/chronic cephalalgia/frequent headache’, ‘angina/chest pain’, ‘back pain, neck pain, shoulder pain, waist pain, cervical/low back pain or menstrual pain’. Two other categories were created in this variable: non-DCP (nDCP) and non-CP. The independent variables are described in box 1.
Independent variables* (auxiliary candidate variables to calibrate the disabling chronic pain prevalence)
Definition and comments
Sex and age (age groups: 16–44; 45–64;65+ years)
Number of chronic diseases, defined as individuals who declared (at home, face to face) that a doctor or a nurse had told them that they suffered from: cancer, diabetes, hypertension, high cholesterol, colitis and chronic intestinal disease/inflammatory bowel disease; stomach ulcer; chronic constipation; chronic lung disease; asthma; cardiac disorder; heart attack; fibromyalgia; chronic skin problems; chronic allergy; anaemia; poor circulation; varicose leg veins; haemorrhoids; stroke; depression or anxiety; other mental problems; hearing loss; cataract; arthritis or rheumatism; osteoporosis; cirrhosis; kidney disease; urinary incontinence; infertility; prostate disorder (men); or thyroid diseases. Chronic diseases in the chronic pain (CP)-dependent variable* were excluded.
Health-related quality of life (physical and mental component; SF-12).20
Question on self-rated health status in the past 12 months.1
Functional social support: total score and as confidant and affective dimensions.21
Demographic and economic characteristics: marital status, cohabitation, living alone at home, social class,22 educational level, employment status, economic difficulty to make ends meet, total revenues.
Sleep and rest during sleeping hours.
Limitation, disability or physical, sensory or learning disabilities for more than 6 months.
Healthy eating habits as:23 1.5 or more litres of water per day; milk, fruit, vegetables, fish, three or more times per week; bread and cereal, one or more times per week; legume, pasta, rice, potatoes, three or more times per week (without being daily) or less than once per week; meat, two or more times per week (without being daily); sausage, one or two times per week or never/almost never; eggs: one or two times per week. Sweets: less than once a week or never/almost never.
Suspected alcoholism,24 frequency of consumption of alcoholic beverages, tobacco consumption.
Body mass index (BMI) as a continuous variable and categorised as: low weight (BMI<18.5 kg/m2); normal weight (18.5 kg/m2≤BMI<25 kg/m2); overweight (25 kg/m2≤BMI<30 kg/m2); obesity (BMI≥30 kg/m2).25 Both size and weight were measured objectively.
Physical activity in the workplace and physical exercise in free time.
Environmental quality of the area of residence from responses to general self-assessment questions and items on noise, smell, air pollution, industry, green areas, delinquency/insecurity and heavy traffic.
The sum of the scores for these items was calculated and then categorised into tertiles (q33.34=18; q66.66=19). Factorial analysis was also performed using these variables.
Physical work conditions (working population): the sum of the scores for the seven items (Likert scale responses 1–4) was calculated and then categorised into tertiles (q33.34=20; q66.6=24).
Psychosocial-level occupational exposure26 (working population), considering two components: (1) psychological demands; and (2) active work and development possibilities, such as influence, skill and time control. For both components, the sum of the scores for the corresponding items (Likert scale responses 1–5) and then categorised into three tertiles (q33.34=10 years, q66.66=15, component 1; q33.34=26 years, q66.66=34, component 2).
Deprivation index (municipality of residence of the respondent) constructed from the Census 2011, in which the theoretical scores are distributed with a mean of 0 and SD of 1, with a higher score indicating a more deprived socioeconomic situation.27
Rurality index (municipality of residence of the respondent) constructed from the Census 2011 with a theoretical score range from −3.50 to 3.78; a higher score indicates a greater degree of rurality.28
*The dependent variable was disabling chronic pain (DCP) defined as individuals who declared being limited in their activity by any of the following chronic diseases in the survey that included the word ‘pain’: ‘migraine/headache/chronic cephalalgia/frequent headache’, ‘angina/chest pain’, ‘back pain, neck pain, shoulder pain, waist pain, cervical/low back pain or menstrual pain’. Two other categories were created in this variable: non-DCP and non-CP.
Statistical analysis
The following approaches were considered to estimate the prevalence of DCP according to sampling weights:
Horvitz-Thompson or direct estimation (original sampling weights),29
Calibration based on marginals (number of individuals in the population for each category of the calibration variables)
Calibration based on crossings (number of individuals in the population for each category created by crossing the calibration variables) and
Model-assisted calibration30 (implemented through the probability-predicted values from a logistic multivariate model).
Estimations on prevalence, population and variance were calculated for all those calibration approaches considering the χ2 (lineal) and ratio distance (both obtained similar results). Those estimations were performed for the whole sample and for the domains of sex and age groups (16–44; 45–64; +65). To obtain the calibrated DCP prevalence in the correspondent domain, we used the same calibrated weights for the whole sample but the sum extends only to the domain sample; and to obtain the variance estimations, we considered the residuals in the sample for the correspondent domain,31 replacing them in the variance estimator by ‘extended residuals’.32
Figure 1 shows the process followed to select the auxiliary variables. Thus, we first developed a multivariate multinomial logistic regression model to identify possible auxiliary variables associated with DCP (box 1). Hence, from this ‘general model’, the following 11 variables were first identified as candidate calibration variables (p<0.001; R2Nagelkerke=0.27): gender (p<0.001); tobacco consumption (p=0.074); physical activity (p=0.001); physical limitations (p=0.016); hours of sleep (0.017); age (p<0.001); physical (p<0.001) and mental (p<0.001) quality of life, and their interaction with age (p<0.001 and p=0.001, respectively); environmental conditions (p=0.002); emotional social support (p=0.028); and number of chronic diseases (p<0.001).

Questions to be satisfied by the calibration variables.
Among these variables, only sex and age could be obtained from reliable records,33 this being the second required condition of a calibration variable; hence, these would be the initial auxiliary variables to calibrate prevalence. The remaining variables entered in the final model could not be selected as auxiliary variables because there was not a better source than the EAS. In addition, the variables physical and mental quality of life, environmental conditions, or number of chronic diseases were also obtained from the Spanish National Health Survey,34 although not with the same definition or categorisation, the third condition required for calibration; hence, they also could not be considered as calibration variables.
Besides the previous general model, to identify more potential auxiliary variables, we also created one multinomial logistic model for each independent variable not included previously in the general model, except sex and age which were included again. Those independent variables were: self-rated health status, confidant social support, marital status, cohabitation, living alone at home, social class, educational level, employment status, economic difficulty to make ends meet, total revenues, rest during sleeping hours, healthy eating habits, alcohol, body mass index, physical work conditions, psychosocial-level occupational exposure, deprivation and rurality index (box 1). Therefore, on the basis of those models, we identified two more variables with statistical significance <0.1 that also had population record data and the same definitions: educational level (p=0.056) and employment status (p<0.001). Other variables based on data available from population records35 showed statistical significance >0.1 and were therefore not considered for calibration.
Note that calibration conditions 1–3 (figure 1) can be applied in a different order depending on the features of the data sources and study needs.
The fourth calibration condition had to be met by approach 2 (marginal calibration). It was to check whether there were at least two observations for every category of the auxiliary variable. For approaches 3 and 4 (crossing and model-assisted calibration), a check for each category was created by crossing the auxiliary variables with the study variable (condition 6). So, in our study, 36 categories were obtained by crossing DCP, sex, age groups and educational level, and 70 categories by crossing DCP, sex, age and employment status. Hence, only sex, age groups and educational level had a sufficient number of observations.
The last but not the least important conditions are questions 5 and 7, and their selection depends on the calibration approach adopted. Independently, they are necessary to find out which subset of auxiliary variables obtains the highest variance reduction in the study variable (DCP) with the fewest number of (auxiliary) variables.
Thus, after applying all the conditions, the calibration variables to estimate the prevalence of DCP were: sex, age groups and educational level.
For the three CP categories (DCP, nDCP and non-CP), the general logistic model was adjusted by the calibration variables. This showed no statistically significant differences between the nDCP and non-CP categories.36 Therefore, for the calibration of the prevalence of DCP according to the model-assisted approach, a binary logistic model was selected which considered DCP as a dependent dichotomous variable (DCP category vs nDCP or non-CP) and the calibration variables as the independent ones. It was based on data from 99.8% of the study sample (n=6494), had a high significance (p<0.001; R Nagelkerke 2=0.15) and included (p<0.001) gender, age groups and educational level. Second-order interactions were not statistically significant (p>0.45). Therefore, the model-assisted calibration was implemented through the probability-predicted values from that model.
Simple bar graphs were created. The significance level was established at 0.05, and R software was used for the multivariate logistic models. The ‘sampling’,35 R package was used for the sample design and calibration weightings in all analyses, and ‘samplingVarEst’37 package for the variance estimations.
Results
Bias
Figure 2 shows the bias, in terms of relative variations, of direct population estimations for the calibration variables with respect to their census values.33 Thus, when educational level was included in the crossing to obtain the population estimations, deviations were more than twofold higher in primary schooling and lower categories for the subpopulation aged between 16 and 64 years, being much higher in women. This bias was the opposite for secondary schooling, increasing with the age groups, although to a lesser extent than primary schooling.

Observed biases of the calibration variables.
Calibrated prevalence
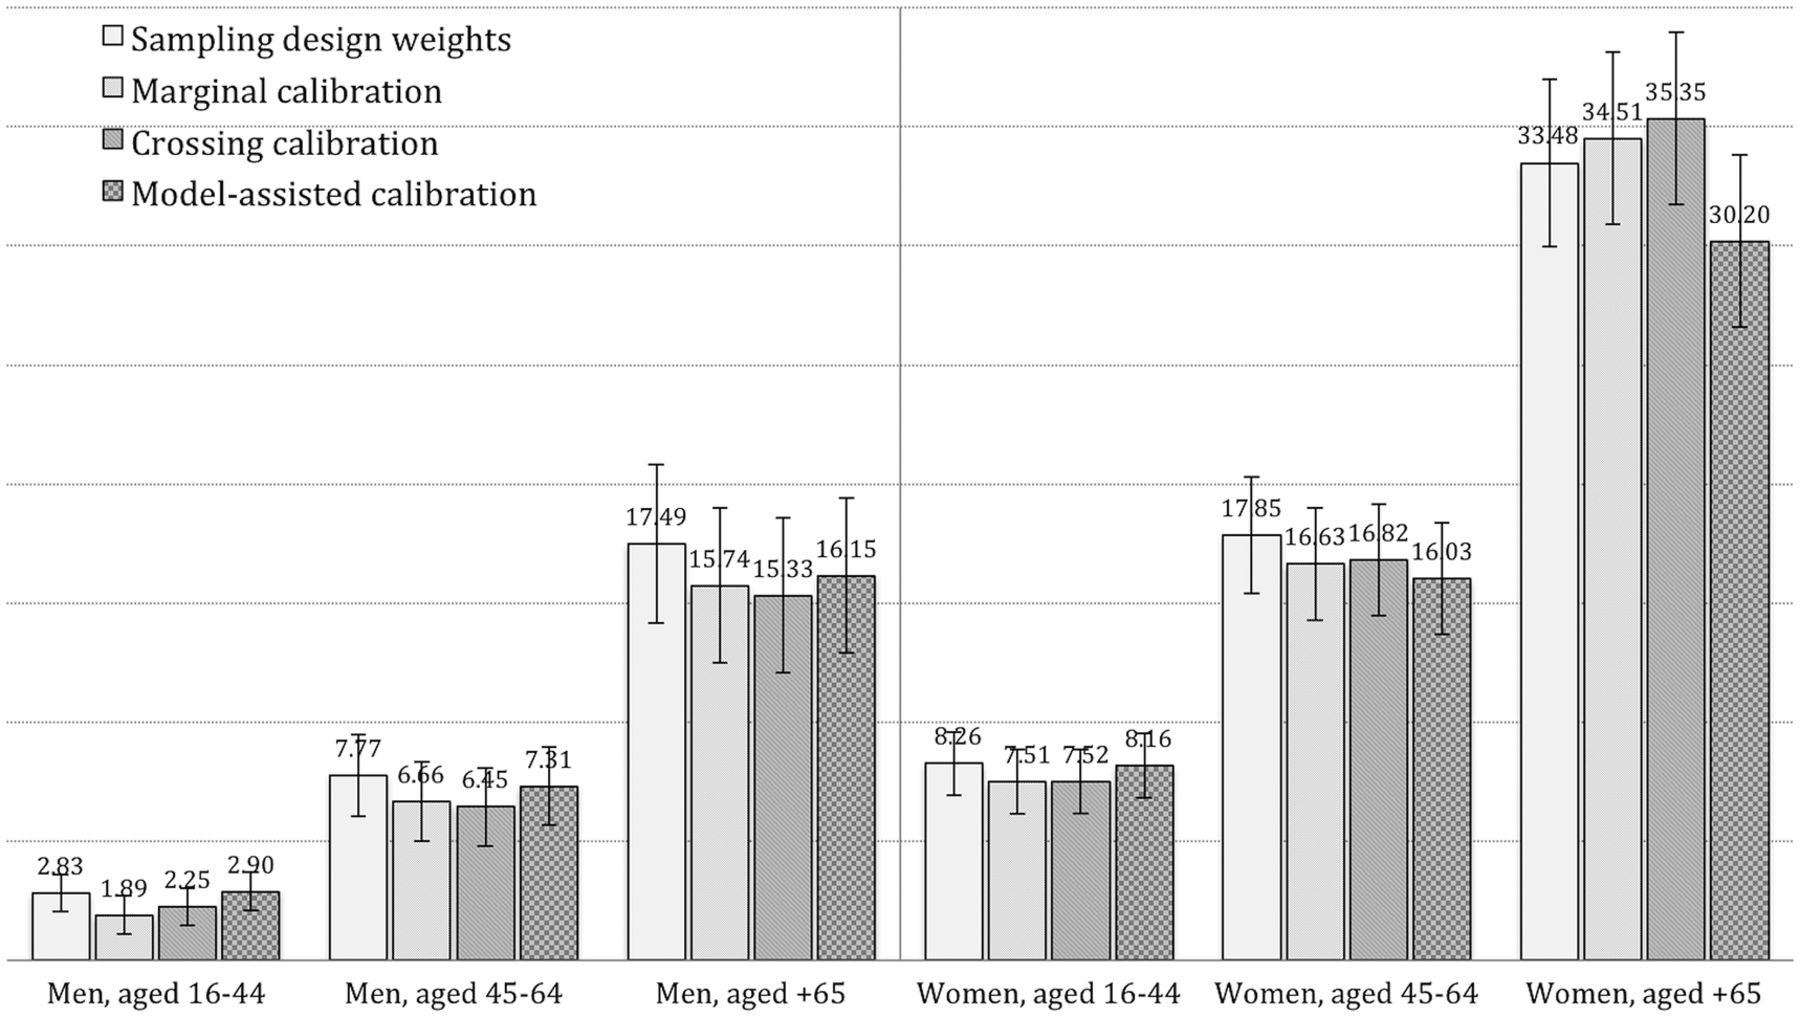
The prevalence of DCP was 11.51% with the original sampling weights, 10.76% with linear calibration based on marginals, 10.91% with linear calibration based on crossings and 10.78% with model-assisted calibration (supplementary material figure I). With respect to the domains of sex and age group, and regardless of the estimation approach, DCP was significantly more frequent in women versus men in all age groups (p<0.001), and this gender difference was greater in younger age groups (figure 3). Consequently, DCP prevalence was threefold higher in women versus men up to the age of 45 years, and twofold higher in older age groups. It is even higher in women compared with men in older age groups.

Calibrated prevalence of disabling chronic pain according to different approaches and domains of sex and age groups.
supplementary figure I
Changes after calibrating
All DCP prevalence calibrations reduced all the direct estimations for the whole sample by more than 5.2% (supplementary material figure II). Regarding the population estimations, the marginal linear calibration and the assisted model calibration reduced the estimated population with DCP by more than 50 000 individuals. Model-assisted calibration achieved the greatest variance reduction (8.28%), with almost no differences compared with the rest of the calibration approaches.
supplementary figure II
Regarding the domains, except for 3 out of the 18 categories of domains and calibration approaches, all domains obtained results similar to the whole sample, in the sense that all calibration techniques, compared with the direct estimation, produced lower prevalence estimations (figure 4). Those reductions in DCP prevalence were from 33% for the domain of adult men up to the age of 44, to 1% for women of the same age. With respect to the variance reductions, all calibration approaches obtained almost the same slight reductions in their estimations (range 0.25–1%). Taking this into account, the crossing calibration approach achieved the highest variance reductions in almost all the domains.

Percentage reductions in prevalence estimations, in the domains of sex and age groups, after calibration.
Discussion
All calibration approaches applied in our study to adjust estimations of DCP prevalence, reduced it in the whole sample and in almost all the domains. Thus, without calibration, the estimations would have been overestimated because of differences between the sample and the study population (figure 2). This could mean that, in the EAS, every other condition with a similar relationship to the one we observed between DCP and the calibration variables would also be overestimated. Regarding the sampling errors, calibration techniques also reduced the estimated variances in the whole sample and in all the domains. There were no statistically significant differences in the prevalence estimations (neither total nor domains). That may be due to the fact that the sample design of the EAS has been checked over the years (there are five editions of the survey) so that it properly represents population. However, any calibration approach used produces better estimations in the sense of adjusting the sample to the study population and reducing the sampling error. Thus, the most accurate DCP prevalence for the whole sample was obtained using model-assisted calibration, and crossing calibration for the domains, although they showed almost no differences between them. Since the domain membership is not incorporated into the sampling design (unplanned domains), the domain sample sizes are random. This introduces an increase in the domain estimator variances. To tackle this, we applied the technique of ‘extended residuals’.26
In this study, three auxiliary variables (sex, age and education) met the calibration conditions (figure 1). The possibility of including more auxiliary variables would not necessarily yield higher estimation precision. In fact, for marginal calibration, it was possible to include the auxiliary variable employment status, excluded in the other two calibration approaches due to insufficient samples in the crossings, and a slightly higher variance was found than that obtained for calibration with the three calibration variables. Consequently, the number of auxiliary variables has to be controlled. Excessive segmentation of the auxiliary information could reduce its quality, as well as its accuracy in the estimations in more segmented categories, and could even impede an effective calibration.
With respect to the different calibration approaches used, only the results for the χ2 distance are presented in this study. The reason was because those estimations for the raking distance were practically the same for marginal calibration and were exactly the same for crossing and model-assisted calibration. Although negative calibrated weights might occur using χ2 distance, all in our study were positive (the minimum weights obtained were 0.12878 for marginal calibration, 0.30422 for crossing calibration and 0.87844 for model-assisted calibration). Marginal calibration (approach 2) permits the incorporation of more auxiliary variables in the construction of the new sampling weights, because it only requires the total marginal population for each auxiliary variable,16 while the crossing and model-assisted methods require the total marginal populations for each subpopulation resulting from crossing auxiliary variables. Depending on the calibration method, it is also necessary to have at least two sample elements in each marginal or crossing category, and, in the case of model-assisted calibration, also in the crossing with the study variable. Both requirements can markedly limit crossing calibration or model-assisted techniques, especially when the study population, sample or study variable prevalence is reduced. Thus, if the study population is small, there may be confidentiality concerns with regard to the population record from which auxiliary variables are extracted. On the other hand, if the sample or prevalence is low, there can be problems of an inadequate sample for certain crossing categories.
Another limitation of model-assisted calibration is that the new weights obtained could only be applied in estimations for the study variable, because they were calculated according to the probabilities obtained from the adjusted model. However, the remaining calibration techniques would serve for other study variables,31 with the only condition being a significant association with the auxiliary variables.
In addition to the above requirements or limitations, the calculation of the new calibrated sample weights requires that there are no important sample losses in calibration variables, and there should be no significant differences between valid and lost samples. In our study, 7 of the 6505 participants were lost due to calibration variables, leaving 99.9% of the total sample. There was no non-response problem in our study as DCP had only four missing values. Nevertheless, non-response is a frequent difficulty in surveys, and calibration is a useful approach to meet this challenge.17
An alternative technique for adjusting weightings is the pseudoempirical likelihood method.38 Although calibration and pseudoempirical likelihood methods are asymptotically equivalents, calibration is much easier to explain to users than pseudoempirical likelihood.
A further strength of the study is the source of data (EAS), a very complete, intensive and large population survey based on face-to-face home interviews with more than 6500 adults. This sample size allows precise and reliable estimations to be made. Survey limitations detected in this study include the need to add muscle and joint pain in the lower and upper extremities (except shoulders), as well as various traumatological, postsurgical and neuropathic conditions. In addition, it would be preferable to gather direct data on CP with a simple question and also information about the onset of CP, as well as its intensity.39 All of these changes have been introduced in the 2016 edition of the EAS, enabling analysis of possible biases.
With regard to the measurement of DCP, it is necessary to reach a consensus of its definition.40 Our proposal is based on the medical or healthcare professional diagnosis of CP, following the criteria of the Andalusian Health Strategy for the care of people in pain,34 the International Association for the Study of Pain41 and the WHO.14 They define disability as an umbrella term, covering impairments, activity limitations and participation restrictions (http://www.who.int/topics/disabilities/en/). That definition, compared with other studies,9–13 does not consider pain intensity.
In summary, model-assisted calibration is the best technique to estimate DCP prevalence for the whole population, and crossing calibration for their domains, although the three calibration approaches studied showed almost no differences compared with marginal calibration in terms of variance reductions. According to those results, the calibrated prevalence of DCP is 10.78% for Andalusia (CI 10.03% to 11.52%); 740 266 people (CI 689 134 to 791 397), being 2.25% and 7.52% for men and women aged 16–44, respectively, 6.45% and 16.82% aged 45–64, 15.33% and 35.35% aged+65. We recommend that more studies with better diagnostic tests, knowledge and interventions orientated towards people living with DCP are carried out. This article reports on the prevalence of DCP, applying calibration methodology to enhance the validity and accuracy of estimations. While linear calibration has already been applied in another population-based survey by the authors of this study,16 this is the first time that a calibration technique has been applied to the EAS. Furthermore, to the best of our knowledge, this is the first time that model-assisted calibration has been applied to any population-based health survey. These calibration approaches are being increasingly adopted in social sciences, especially in studies with small samples or with coverage or non-response problems. The results obtained may be useful for cross-disciplinary comparisons of CP and disability in clinical and population-based studies, and the methodology developed could serve as a model to be applied in other epidemiological studies.
References
Footnotes
Contributors AC-L conceived the original idea with the participation of MR and MC-B. AC-L designed the analysis plan alongside MR. Statistical analysis was conducted by AC-L. AC-L developed the first version of the manuscript. All authors participated in the writing of subsequent versions and approved the final article.
Funding The Andalusian Health Survey, the source of information in this study, is funded by the Ministry of Health of the Andalusian Government, Seville, Spain. This study was partially supported by Ministerio de Educación, Cultura y Deporte (grant number MTM2015-63609-R, Spain) and by Allergan Inc.
Competing interests None declared.
Patient consent Obtained.
Ethics approval The General Secretariat of Quality and Public Health in the Health Ministry of the Andalusian Regional Government.
Provenance and peer review Not commissioned; externally peer reviewed.
Data sharing statement Other tables, analyses, statistics and R code not included in the present article are available on demand.