Article Text

Abstract
Objectives To compare the ability of standard versus enhanced models to predict future high-cost patients, especially those who move from a lower to the upper decile of per capita healthcare expenditures within 1 year—that is, ‘cost bloomers’.
Design We developed alternative models to predict being in the upper decile of healthcare expenditures in year 2 of a sample, based on data from year 1. Our 6 alternative models ranged from a standard cost-prediction model with 4 variables (ie, traditional model features), to our largest enhanced model with 1053 non-traditional model features. To quantify any increases in predictive power that enhanced models achieved over standard tools, we compared the prospective predictive performance of each model.
Participants and Setting We used the population of Western Denmark between 2004 and 2011 (2 146 801 individuals) to predict future high-cost patients and characterise high-cost patient subgroups. Using the most recent 2-year period (2010–2011) for model evaluation, our whole-population model used a cohort of 1 557 950 individuals with a full year of active residency in year 1 (2010). Our cost-bloom model excluded the 155 795 individuals who were already high cost at the population level in year 1, resulting in 1 402 155 individuals for prediction of cost bloomers in year 2 (2011).
Primary outcome measures Using unseen data from a future year, we evaluated each model's prospective predictive performance by calculating the ratio of predicted high-cost patient expenditures to the actual high-cost patient expenditures in Year 2—that is, cost capture.
Results Our best enhanced model achieved a 21% and 30% improvement in cost capture over a standard diagnosis-based model for predicting population-level high-cost patients and cost bloomers, respectively.
Conclusions In combination with modern statistical learning methods for analysing large data sets, models enhanced with a large and diverse set of features led to better performance—especially for predicting future cost bloomers.
- predictive analytics
- high-cost patients
This is an Open Access article distributed in accordance with the Creative Commons Attribution Non Commercial (CC BY-NC 4.0) license, which permits others to distribute, remix, adapt, build upon this work non-commercially, and license their derivative works on different terms, provided the original work is properly cited and the use is non-commercial. See: http://creativecommons.org/licenses/by-nc/4.0/
Statistics from Altmetric.com
Strengths and limitations of this study
We conducted a population-based study of high-cost patients, using Danish National Health Service and Civil Registration System data sources linked at the individual level and covering all residents of Western Denmark from 2004 to the end of 2011.
We demonstrated that pairing large population health data sets and modern statistical learning methods can improve prediction of future high-cost patients, compared to standard tools that are widely used in the USA and internationally.
We developed a novel framework for predicting future cost bloomers, who account for majority of high-cost patients in the USA and in Denmark every year.
Accurate prediction of cost bloomers is only the first step in a process that must be coupled with evidence-based interventions, in order to achieve the ultimate effect we seek—improvements in healthcare value.
Given differences between residents, insurance status (or lack thereof), follow-up times and other national health systems characteristics, our findings may not be generalisable to other national health systems.
Introduction
A small fraction of individuals account for the bulk of population healthcare expenditures in the USA, Denmark and other industrialised countries.1–4 Although many high-cost patients show consecutive high-cost years, the majority experience a ‘cost bloom’, or a surge in healthcare costs that propels them from a lower to the upper decile of population-level healthcare expenditures between consecutive years.4
Proactively identifying and managing care for high-cost patients—especially cost bloomers, who may disproportionately benefit from interventions to mitigate future high-cost years—can be an effective way to simultaneously improve quality and reduce population health costs.5–16 However, since the Centers for Medicare and Services (CMS) commissioned the Society of Actuaries to compare leading prediction tools more than 10 years ago, scant progress has been made in improving cost-prediction tools.17 ,18 To the extent that they fail to make accurate predictions of cost blooms, standard models leave healthcare organisations held accountable for the total cost of care, to unfair performance assessments and/or financial penalties.18–21 Overcoming these and other challenges associated with the management and care of high-cost patients is essential to achieving a higher value healthcare system.
We sought to create more accurate models for predicting high-cost patients, especially cost bloomers, who are more challenging for standard tools to predict accurately.22–24 Also, we wished to gain new insights into the antecedents of high-cost years that distinguish cost bloomers from persistent high-cost patients, who have two or more consecutive high-cost years. Our hypothesis was that technological advances in the last decade allow improvement in prediction ability over current approaches. Recent progress in statistical methods for analysing large data sets has been driven by development of new learning algorithms and by the ongoing explosion in the availability of large observational data sets and low-cost computation.25–27 Paired with large and diverse health data sets available at the population level, modern statistical learning methods may present new opportunities to advance methods underlying healthcare cost-prediction tools.5 ,28 ,29
Drawing from individual-level data for the entire population of Western Denmark from 2004 to 2011, we analysed high-cost spending trends and evaluated the prospective predictive performance of six alternative models designed for the commonly executed prediction of high-cost patients and for our novel cost-bloom prediction task. Our models ranged in size from a baseline logistic regression model with four variables (ie, features) to a very large enhanced prediction model with over 1000 non-traditional cost-prediction features. For our larger models, we used elastic-net penalised logistic regression, which is a modern statistical learning method designed to address some of the issues associated with applying a standard stepwise regression procedure to select a best-fitting model from a plethora of choices.25 ,26 ,30 ,31
Materials and methods
Participants and setting
Our longitudinal population-based study draws from the entire population of Western Denmark from 2004 to 2011 (2 146 801 individuals), which is representative of Denmark more broadly. The Danish National Health Service provides tax-supported healthcare for all Danish citizens.
Our prediction study considered only those individuals with a full year of active Danish residency in year 1, to predict high-cost patients in year 2. Our whole-population high-cost analysis used all residents who satisfied our Danish residency criteria. Similar to previous studies, we defined a ‘high-cost’ patient as an individual in a sample who is in the upper decile of annual healthcare expenditures.11 ,32–34 For prediction of the cost bloomers, our cost-bloom analysis additionally excluded individuals who already had a high-cost status in year 1, who thus could not show a cost bloom.
In addition to our prediction study, we performed a descriptive analysis of multiyear expenditure trends and high-cost patient characteristics. For the whole population, we conducted an 8-year trend analysis of individuals with one or more high-cost years, based on data from 2004 to 2011. For high-cost patients in 2011, we performed a 3-year trend analysis, using expenditure data from 2009 to 2011, and examined 2010 data to characterise meaningful distinctions among persistent and newly high-cost patients. Specifically, we repurposed the demographic, healthcare cost and diagnostic features from our models to compare the age distribution, mortality rate and the chronic condition to profile of persistent high-cost patients and cost bloomers.
Patient involvement
We analysed deidentified population healthcare data. Thus patients were not involved in the development of the research question, the outcome measures or the study design.
Data sources
We obtained demographic information from the Danish Civil Registration System, including age, gender and residency status, as well as geographic district of residence and social relationship data.35–39 The Danish registries used in our study are described in more detail in the supplementary data.
supplementary data
The Primary and Specialist Care Files and the Danish National Patient Registry were the sources of our healthcare utilisation data.40 The Primary and Specialist Care Files specified each visit type (ie, primary care or specialist), the total cost of each visit, and whether a visit occurred during weekday business hours or during one of the two off-hours time periods. The Danish National Patient Registry provided ICD-10 diagnostic codes (adopted in 1994) assigned to each patient in the inpatient hospital setting or at a hospital outpatient clinic, NOMESCO codes for surgeries and procedures associated with inpatient visits, and healthcare costs.41 Our source of prescription data was the Health Service Prescription Database. For each drug prescribed to a patient, this Database provided Anatomical Therapeutic Chemical (ATC) class information and the cost.36 ,42
The Department of Clinical Epidemiology at Aarhus University, Denmark, provided data for our study. The Danish Data Protection Agency (Record 2013-41-1924) approved this investigation.
Alternative prediction models
Healthcare cost-prediction tools can be broadly categorised as diagnosis-based (eg, Ambulatory Care Groups (ACGs) and Diagnostic Cost Groups (DCGs)), pharmacy-based (eg, MedicaidRx and RxGroups), or diagnosis and pharmacy-based (eg, Episode Risk Groups (ERGs) and Impact Pro).36 Detailed descriptions of standard tools and their features can be found in a number of reviews of health risk assessment.7 ,18 ,20 ,21 ,24 Standard diagnosis-based tools are the most widely used type of cost-prediction model in the USA and internationally. They consist of traditional cost-prediction features such as a diagnostic risk score, adjusted for age and gender, and use regression-based learning methods.7 ,18 ,20 ,24
Table 1 provides an overview of the types and number of traditional and non-traditional model variables—that is, model features—that were used to create high-cost patient prediction models. Our approach to creating enhanced models was to create a richer and more informative individual-level profile for high-cost patient prediction. We built on previous work in healthcare cost prediction, involving the development of enhanced prediction models and their evaluation.7 ,14 ,32–34 ,43 ,44 Our custom features were based on those available in our Danish population health data set.
Year 1 model features for high-cost patient prediction are shown by data source, feature type (ie, traditional/non-traditional) and feature category
Overall, we developed 1053 non-traditional features. We used data from the clinical registries and medical coding systems to transform our diagnosis-based risk scores into component disease groups and chronic and non-chronic indicators by organ system, as well as to represent sparse drug and procedural information in succinct and meaningful categories, and to incorporate cost information by setting. We constructed new features to capture utilisation patterns, including the number of off-hours primary care visits, total length of inpatient stays, and utilisation statistics such as the quarterly moving average of ED visits and linked data from the Danish Civil Registration System (CRS). As shown in table 1, the CRS allowed us to assign a social relationship status to each resident that was fixed (eg, ‘Married’ for all years) or dynamic (eg, ‘Married-Widowed’ for widowed in the year prior to prediction).
We created a total of six alternative prediction models: two standard models with traditional features and four enhanced models with traditional and non-traditional features. Table 2 provides a description of each model's feature types, logistic regression method and the number of traditional and non-traditional features. We developed our standard models based on their description in the literature.20 ,24 ,32 Standard model 1, our baseline model, is representative of a standard diagnosis-based cost-prediction model that includes age, gender, diagnostic risk score and chronic condition risk score. We estimated disease risk scores for each resident, based on the Agency for Healthcare Research and Quality (AHRQ) Clinical Classification Software (CCS) and Chronic Condition Indicator (CCI) coding systems.32 ,45 ,46 Building on the baseline model, standard model 2 is representative of a diagnosis and pharmacy-based prediction tool and included inpatient and outpatient specialist costs and drug costs as features.
Description of alternative standard and enhanced high-cost patient prediction models, presenting the feature types included, the statistical method used for prediction and the number of traditional, non-traditional and total model features
Our simplest enhanced model, enhanced model 1, builds on standard model 2 with the addition of primary care costs. Enhanced model 2 extends enhanced model 1 with an additional 71 social relationship features. To quantify the performance of an enhanced model in lieu of cost data, we used our full feature set and excluded all cost features (25 in total) to create enhanced model 3. Finally, all 1059 traditional and non-traditional healthcare utilisation, diagnostic, prescription and civil registry-derived features were used to create enhanced model 4.
With inclusion of many features, regression problems require statistical model selection to identify a parsimonious model. For enhanced models 2 through 4, ranging from 77 to 1059 cost-prediction features, we used elastic-net penalised logistic regression, which addresses some of the issues associated with applying a standard stepwise regression procedure to select a best-fitting model from a plethora of choices.26 ,30 ,47 Penalised regression is a prominent statistical learning methods for analysing large high-dimensional data sets and has been successfully used in scientific and business applications. For our larger enhanced models, the main advantage penalised logistic regression offered over a standard approach was the ability to simultaneously conduct feature selection and model fitting.25 ,29 ,31 A detailed description of stepwise and penalised regression can be found in the work of Taylor and Tibshirani.31
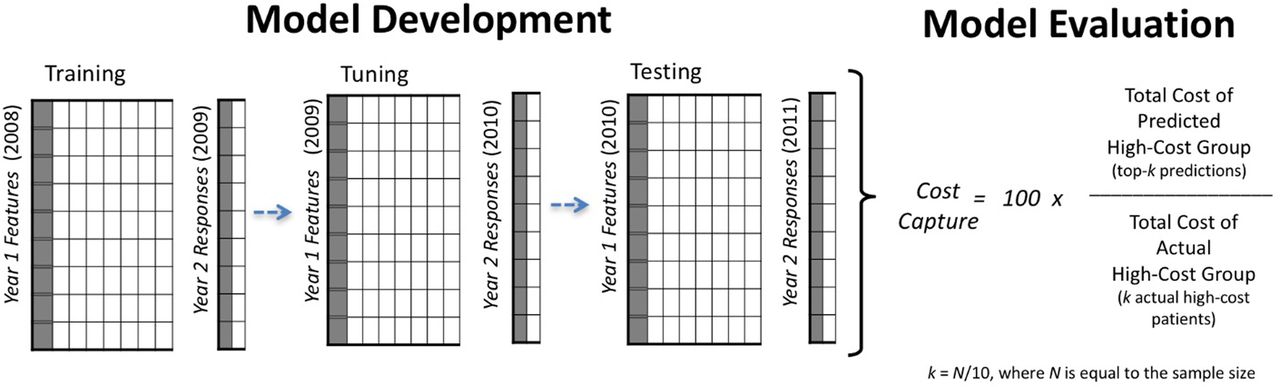
An overview of our model development and evaluation framework appears in figure 1. For our penalised regression models, the process involved three steps: step 1: training on 2008 data to predict high-cost patients for the year 2009; step 2: tuning on 2009 data to predict high-cost patients for the year 2010 and step 3: testing our model from step 2 on unseen data from 2010 to predict high-cost patients in 2011 (ie, prospective model validation). We learnt the initial parameters for each model in the training step, commonly called model calibration in the health risk-assessment literature. For penalised logistic regression models, tuning was used to refine the final model based on the 2010 classification error of predicted to actual high-cost patients. Since standard regression models cannot be refined by tuning—as there are no free parameters to set beyond the initial parameters learnt in training—the tuning step was not performed. For standard regression models, the process involved two steps: step 1: training on 2009 data to predict high-cost patients for year 2010; and step 2 testing on the model fitted in step 1 using 2010 data for prediction of high-cost patients in 2011.

Overview of our model development and evaluation framework. Three independent panel data sets were used for training (model fitting), tuning and testing steps. To evaluate alternative models, we calculated the ratio of predicted high-cost patient expenditures to actual high-cost patient expenditures in year 2.
Model evaluation
Using unseen data from the most recent 2-year period in our data set (2010–2011), we evaluated models by calculating the ratio of predicted high-cost patient expenditures to the actual high-cost patient expenditures in year 2—that is, cost capture. Cost capture has been reported in previous studies and is based on the ‘predictive ratio’, commonly used to evaluate cost-prediction models in the health risk-assessment literature and in actuarial reports.11 ,20 ,24
The formula for cost capture is shown in figure 1. Given a model with a prediction sample of 10 000 individuals, cost capture is calculated from year 2 data by: step 1: estimating the size of the upper decile, k, where k=N/10, and N is the sample size, step 2: identifying the predicted high-cost group by selecting the 1000 (k=10 000/10) individuals predicted to be high-cost in 1 year with the highest probability (ie, the top-k predictions), step 3: aggregating the year 2 expenditures accrued by the 1000 individuals in the predicted high-cost group and the 1000 individuals in the actual high-cost group and step 5: dividing the year 2 healthcare expenditures of the predicted high-cost group by that of the actual high-cost group's.
We report the area under the receiver operating characteristic curve (AUC) as a secondary outcome for comparing our population-level models with prior studies that do not report cost capture or a comparable measure. However, given the highly skewed nature of per capita spending in the upper decile it is important to consider relative costliness. For example, the upper decile accounts for 65% and the upper centile accounts for 22% of US healthcare spending. From a cost-prediction perspective, it is better to correctly predict one high-cost patient who accrued $350 000 than three high-cost patients with $35,000. The main limitation of AUC as a sole evaluation metric for high-cost patient prediction is that, unlike cost capture and standard predictive ratios, is does not impose a penalty proportional to the misclassified individual's future costliness, which is key for performance characterisation.
Results
Our 8-year trend analysis of 2 146 801 individuals showed that 314 989 had one or more years of high-cost spending from 2004 to 2011. Within this group, figure 2 shows the per cent of patients (y-axis) by their total high-cost years (x-axis) and their longest duration of consecutive high-cost persistence (saturation scale). The majority (51%) showed only one high-cost year. Among the individuals with multiple high-cost years, many did not experience them consecutively. However, the more consecutive high-cost years a patient experienced, the more likely they were to remain high-cost the following year.

High-cost persistence in Western Denmark (N=2 146 801). Among the 314 989 individuals with any high-cost years, the bars show the per cent of high-cost patients by total high-cost years; colour saturation increases proportionally to the longest duration of consecutive high-cost years for each individual from 2004 to 2011.
Our 3-year trend analysis of high-cost patients in our evaluation year, 2011, included 155 795 high-cost patients, who collectively accrued 73% of Western Denmark's total healthcare expenditures in 2011. Among the high-cost group, 68% (105 904 individuals) were cost bloomers in 2011 and half (77 897 individuals) did not have a high-cost year in either 2009 or 2010. The remaining 32% (49 855 individuals) of high-cost patients in 2011 also had a high-cost year in 2010; in this group, 21% (10 470 individuals) had a third year of high-cost persistence in 2009.
Using year 1 features to examine differences between the cost bloomers and the persistent high-cost patients, our analysis revealed that cost bloomers in 2011 were more likely to have zero inpatient hospital costs than persistent high-cost patients (47% vs 7%). We also found that relative to persistent high-cost patients, cost bloomers showed more than four times fewer chronic conditions and were less likely to be diagnosed with chronic conditions related to the circulatory system, neoplasms or the respiratory system. Figure 3 illustrates the proportion of AHRQ CCI chronic condition indicators among cost bloomers and persistent high-cost patients in 2010.
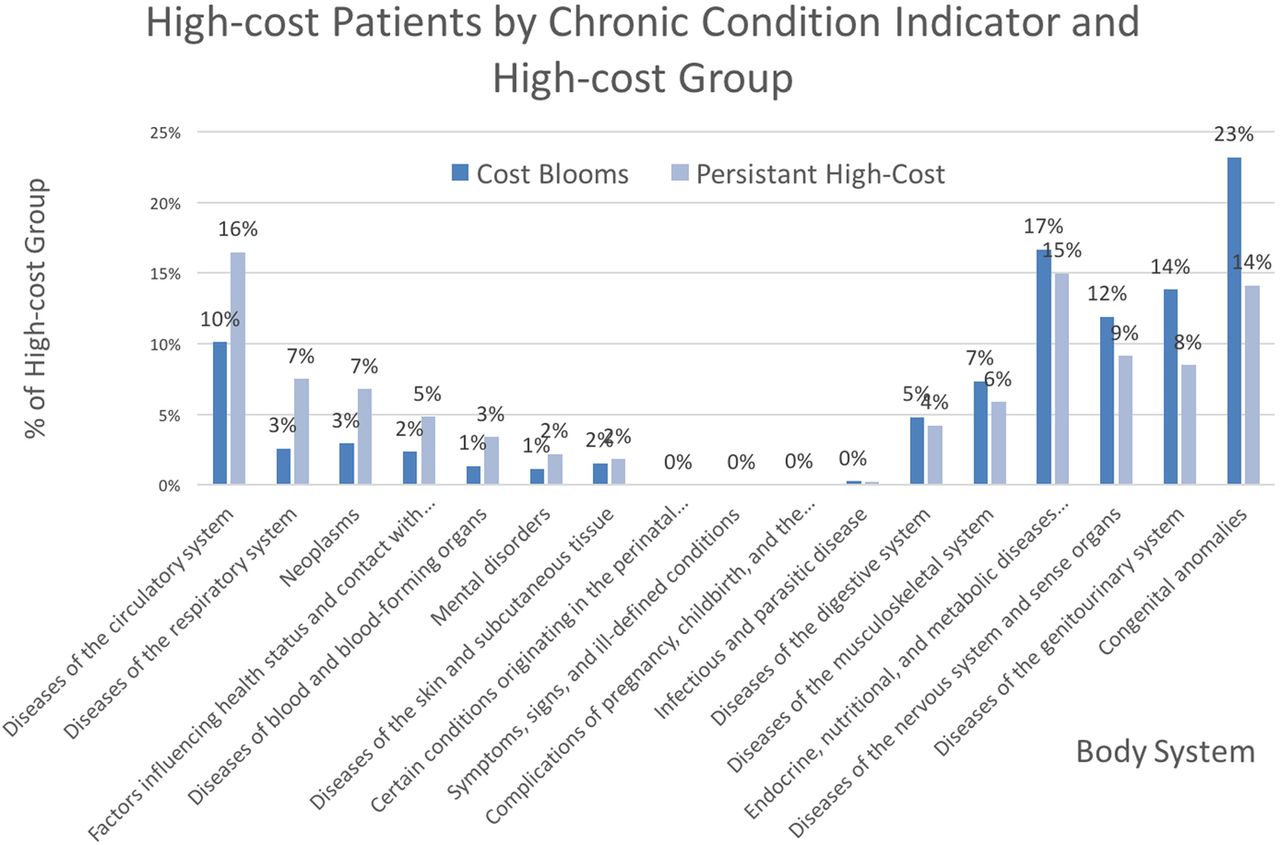
Proportion of chronic condition indicators among persistent high-cost patients (N=49 855) and cost bloomers (N=105 904). Bars show the per cent of patients with each indicator in the prior year, 2010; colour identifies the high-cost group.
Finally, we found that cost bloomers in 2011 were on average younger (55 vs 59 years) and had a lower median age than persistent high-cost patients (58 vs 62). Figure 4 shows the age distribution among high-cost patients by high-cost status. Cost bloomers had lower 1-year mortality rates (5% vs 9%) and 2-year mortality rates (8% vs 16%).

Age distribution of 2011 high-cost patients by high-cost status (N=155 756). Lines show the per cent of patients by age; colour distinguishes persistent high-cost or cost-bloom status. Persistent high-cost patients and cost bloomers had mean and median interquartile age ranges of 30 and 34, respectively.
Prediction performance
Our whole-population analysis included 1 557 950 individuals with a full year of active residency in 2010. After excluding the 155 795 individuals who already had high-cost status at the whole-population level in 2010, our cost-bloom model included 1 402 155 individuals.
We compare the performance of our alternative models for prediction of high-cost patients (155 795 individuals) at the population level and cost bloomers (140 216 individuals) in table 3. Our best-performing model captured 60% of the costs attributed to high-cost patients at the whole-population level and 49% of costs attributed to cost bloomers. Overall, we observed a 21% and 30% improvement in cost capture over baseline for population-level high-cost and cost-bloom prediction, respectively.
Comparison of alternative models for predicting future high-cost patients at the population level and cost bloomers
Focusing on the cost-blooming population, in figure 5, we show the per cent increase in predictive performance that each model achieved over our baseline model, standard model 1, with a total of four features. With the addition of two standard cost-prediction features, patient and outpatient specialist costs and drug costs, standard model 2 achieved a 17% increase over the baseline. Predictive power continued to increase to 21% over the baseline with the addition of the first non-traditional feature, primary care costs, in enhanced model 1, and again to 23% in enhanced model 2, which also included 71 social relationship status features. Enhanced model 3 used all available features, with the exception of 25 features derived from cost data, and showed a 24% increase in predictive power over the baseline. Our full feature set of 1059 features, enhanced model 4, achieved a 30% increase over the baseline model and was consistently our best model, independent of prediction task.

Performance of alternative cost-bloom prediction models by cost capture and relative improvement over the baseline. Bars show cost capture for each model; lines show the per cent increases in predictive power. More details on each model are provided in table 2.
Discussion
Our study makes three key contributions. Taken together, they provide future directions for improving prediction of high-cost patients, who drive the majority of population healthcare spending in the USA, Denmark and other industrialised countries.
First, we provide additional evidence for the importance of accurately identifying cost bloomers, which is underscored by their prevalence among high-cost patients, and their potential for intervention. Similar to the USA, we found that cost bloomers represented the majority of all high-cost patients. Compared to individuals with more persistent high-cost years, we found that cost bloomers were younger, showed less morbidity, lower mortality and, based on their year 1 data, had fewer chronic conditions on average; also, cost bloomers were less likely to be diagnosed with the types of chronic condition indicators commonly associated with high healthcare costs—for example, diseases of the circulatory system and neoplasms.
Second, we demonstrate the ability of modern statistical learning methods and diverse population healthcare data to advance methods underlying healthcare cost-prediction tools. Our framework for the development and evaluation of enhanced models can be described as a machine learning approach to prediction. Machine learning is a field at the intersection of computer science and statistics, with a fast growing literature on statistical learning methods for analysing large and complex data sets.12 ,27 ,29 ,48 A typical prediction framework involves the use of a training data, in which the outcome and feature measurements for a set of objects are used to build a prediction model, or ‘learner’, which will enable prediction of the outcome for new unseen objects. A good learner is one that accurately predicts the outcome of interest.25 The notable improvement our best model achieved over standard tools suggests that data-intensive machine learning methods warrant further study.
Our third contribution is an enhanced model for prediction of cost blooms, which produced a 30% improvement in cost capture over a standard diagnosis-based model. Since our cost bloom prediction task is novel, we have no external model comparison. However, prior studies have been conducted on the traditional high-cost patient prediction task at the population level.11 ,32 ,33 ,34 ,43 Using an enhanced model that was developed using the AHRQ's Medical Expenditure Panel Survey (MEPS) data set, the top performance on a nationally representative data set was reported by Fleishman et al, showing an AUC of 0.84.
While our best population level model also achieved an AUC of 0.84, there are key distinctions. For example, Fleishman et al's AUC measure is not a prospective measure of predictive performance like the AUC reported in our work. Retrospective measures of model fit, such as reported by Fleishman et al, are known to be overly optimistic relative to predictions based on out-of-sample data.25 Also, in contrast to our population health data sources, which serve a secondary purpose for research, Fleishman et al used primary study data. Although the MEPS enables rich longitudinal data to be collected for research purposes, it consists of multiple face-to-face interviews conducted with participants and their family members over a 2-year period. Such an extensive primary data collection process can be resource prohibitive for providers to administer for their entire patient population. Finally, our best model showed higher positive predictive value (PPV) (33% vs 29%).
There are several policy and practice implications for our work. More accurate cost-prediction tools can be used by providers to proactively identify patients at high risk of a cost bloom. However, many providers lack access to the type of comprehensive healthcare and cost data available in Denmark. In the USA, recent legislation in support of data-sharing among Accountable Care Organizations and the growth of population registries will facilitate individual-level linkages across settings and providers; however, this now remains impossible for most practices. To provide utility in a setting where only some of our feature categories are available for prediction of cost bloomers, we demonstrated that our simplest enhanced model achieved a 21% increase in predictive performance over the baseline (see figure 5) with only seven model features. Also, we found that our full feature set without cost features resulted in a 24% increase over the baseline model, suggesting the benefit of our modelling approach for providers who cannot link cost information.
The generalisability of our findings to other national health systems is a limitation of our study. Similar to the USA, the bulk of Denmark's annual health cost is driven by hospital-based services and annual healthcare costs are highly concentrated among a small fraction of the population. Since the distribution of national health costs, medical visits and disease profiles in Denmark is consistent with that of other industrialised countries (see Figures e1–e4 in supplementary data), our findings should be relevant in other similar settings. However, we acknowledge that there are differences among residents, insurance status (or lack thereof), follow-up times and other national health system characteristics. In the absence of access to a comparably large sample, representative of the US population, for studying high-cost patients, a future direction for our work is the external validation of our models using private insurance market data from the USA.
Finally, the ability to accurately predict future high-cost patients is an important first step to improving the value of their care. However, high-performing models are only as beneficial as the evidence-based practices in place for managing the care of future high-cost patients. Our diverse set of cost-prediction features resulted in improvements over standard models and allowed us to characterise some distinctions between persistent high-cost patients and cost bloomers; however, our approach to prediction emphasises performance over interpretability—that is, a key limitation of our models is that they are not designed to provide a meaningful ‘explanation’ of why someone will bloom. Accurate prediction is the first step, but to inform the development of interventions or polices related to compensation for the care and management of patients who are likely to experience a cost bloom in the near future, additional analyses to characterise more specific disease profiles and their healthcare utilisation patterns are warranted.
Conclusions
We carried out the commonly performed prediction of high-cost patients at the population level and described a new framework for predicting cost bloomers. We demonstrate that diverse population health data, in conjunction with modern statistical learning methods for analysing large data sets, can improve prediction of future high-cost patients over standard diagnosis-based tools, especially for our cost-bloom prediction task. Our best-performing enhanced model captured 60% of high-cost patient expenditures and 49% of cost bloomer expenditures. It also achieved 21% and 30% improvements in cost capture over a standard diagnosis-based claims model for predicting future high-cost patients and cost bloomers, respectively. We expect our study to inform providers and payers, who need better strategies to address the differential risks posed by the small fraction of patients who account for the bulk of population healthcare spending.
Acknowledgments
The authors thank Rita Hammond, Johnathan Chen, Ken Jung, Alejandro Schuler and the Stanford Stats for Good workgroup for their helpful discussions and feedback on our manuscript. The authors would like to thank the residents of Western Denmark for participating in our study.
References
Footnotes
Twitter Follow Suzanne Tamang @suzanntee
Contributors AM, HTS and NHS had the original idea for the study. ST, LP, LM and LJ contributed to the design of the study and ST is the guaranteer. AM and HTS facilitated the data use agreement. LP provided ST with cleaned and deidentified study data. ST preformed the descriptive analyses and developed the data matrices for the prediction study. ST, JB, LM and LJ conducted the prediction study. All authors reviewed the manuscript. ST, LM, J-RB, LJ and NHS reviewed the analysis. ST and NHS declare that they had full access to all of the data in the study, can take responsibility for the integrity of the data and the accuracy of the data analysis and controlled the decision to publish. The authors grant an exclusive international license to the publisher.
Funding This study has been supported by the Aarhus University Research Foundation, the Frederick E. Terman Fellowship and a Stanford Biomedical Training Grant from the National Library of Medicine (LM-07033).
Competing interests None declared.
Ethics approval Danish Data Protection Agency (Record 2013-41-1924).
Provenance and peer review Not commissioned; externally peer reviewed.
Data sharing statement No additional data are available.
Transparency statement This statement affirms that our manuscript is an honest, accurate and transparent account of the study being reported; that no important aspects of the study have been omitted and that any discrepancies from the study as planned have been explained.