Article Text

Abstract
Objective To assess the influence of the 3.11 triple disaster (earthquake, tsunami and nuclear accident) on the emergency medical service (EMS) system in Fukushima.
Methods Total EMS time (from EMS call to arrival at a hospital) was assessed in the EMS system of Soma district, located 10–40 km north of the nuclear plant, from 11 March to 31 December 2011. We defined the affected period as when total EMS time was significantly extended after the disasters compared with the historical control data from 1 January 2009 to 10 March 2011. To identify risk factors associated with the extension of total EMS time after the disasters, we investigated trends in 3 time segments of total EMS time; response time, defined as time from an EMS call to arrival at the location, on-scene time, defined as time from arrival at the location to departure, and transport time, defined as time from departure from the location to arrival at a hospital.
Results For the affected period from week 0 to week 11, the median total EMS time was 36 (IQR 27–52) minutes, while that in the predisaster control period was 31 (IQR 24–40) min. The percentage of transports exceeding 60 min in total EMS time increased from 8.2% (584/7087) in the control period to 22.2% (151/679) in the affected period. Among the 3 time segments, there was the most change in transport time (standardised mean difference: 0.41 vs 0.13–0.17).
Conclusions EMS transport was significantly delayed for ∼3 months, from week 1 to 11 after the 3.11 triple disaster. This delay may be attributed to malfunctioning emergency hospitals after the triple disaster.
- ACCIDENT & EMERGENCY MEDICINE
- PUBLIC HEALTH
- Fukushima Nuclear Accident
- Emergency Medical Services
- Disaster Medicine
This is an Open Access article distributed in accordance with the Creative Commons Attribution Non Commercial (CC BY-NC 4.0) license, which permits others to distribute, remix, adapt, build upon this work non-commercially, and license their derivative works on different terms, provided the original work is properly cited and the use is non-commercial. See: http://creativecommons.org/licenses/by-nc/4.0/
Statistics from Altmetric.com
- ACCIDENT & EMERGENCY MEDICINE
- PUBLIC HEALTH
- Fukushima Nuclear Accident
- Emergency Medical Services
- Disaster Medicine
Strengths and limitations of this study
This is the first study to evaluate the influence of the 3.11 triple disaster (earthquake, tsunami and nuclear accident) on the emergency medical service (EMS) system in Fukushima.
This study suggests that delays in EMS transports after nuclear disasters may be attributed to closures of hospitals providing emergency care, while EMS systems themselves can be functionally maintained.
This study is limited in that the EMS database lacked information concerning vital signs, mental status, mortality or outcome, the severity of patient status or the outcome of EMS transport could not be assessed.
Further, there may be a small scope for generalisability of these findings, as this study was focused on a rare and complex disaster (earthquake, tsunami and nuclear accident).
Introduction
Establishment and maintenance of emergency medical services (EMS), including rapid transport, is crucial for timely care and a rapid diagnosis. Timely care has been demonstrated to improve outcomes, especially in time-sensitive diseases, including cardiopulmonary arrest (CPA), ST-elevated myocardial infarction, major trauma and stroke.1–4 Adequate numbers of EMS transport vehicles and personnel, and capacity of emergency departments (EDs) to accept EMS patients are indispensable for effective EMS systems. Further, functionality of EMS systems appears to largely depend on a proportionate number of calls (demand) and ability to respond (supply).
EMS systems are disrupted on unusual circumstances, including a large-scale traffic accidents, and natural and man-made disasters.5–7 Following disasters, there is often a significant increase in the number of people sustaining serious injuries, which can subsequently result in an increased demand for EMS. Yet, at the same time as demand for care increases, rapid transport may be interrupted with roads or hospitals closed or damaged by disasters.8 In a worst-case scenarios, hospitals may completely suspend their entire ED service after large disasters.9 In these situations, EMS may be forced to take responsibility for triage and initial care of casualties, whether hospitals are functional or not.10–12
Nuclear accidents could also be a cause to perturb EMS systems. In previous reports, the number of patients demanding EMS care due to acute radiation exposure has been low because acute radiation exposure is usually limited to nuclear power plant workers who deal with radioactive materials unintentionally or without appropriate knowledge.13–15 However, in the aftermath of nuclear disasters, EMS transport may be impacted by the mass evacuation of medical staff to prevent radiation exposure. A shortage of medical personnel in emergency care was indeed seen after the nuclear accident at Three Mile Island in 1979, when out of more than 70 doctors, only 6 remained in the hospital near the damaged nuclear power plant.16 However, there is currently little information on the functioning of EMS systems after nuclear disasters.
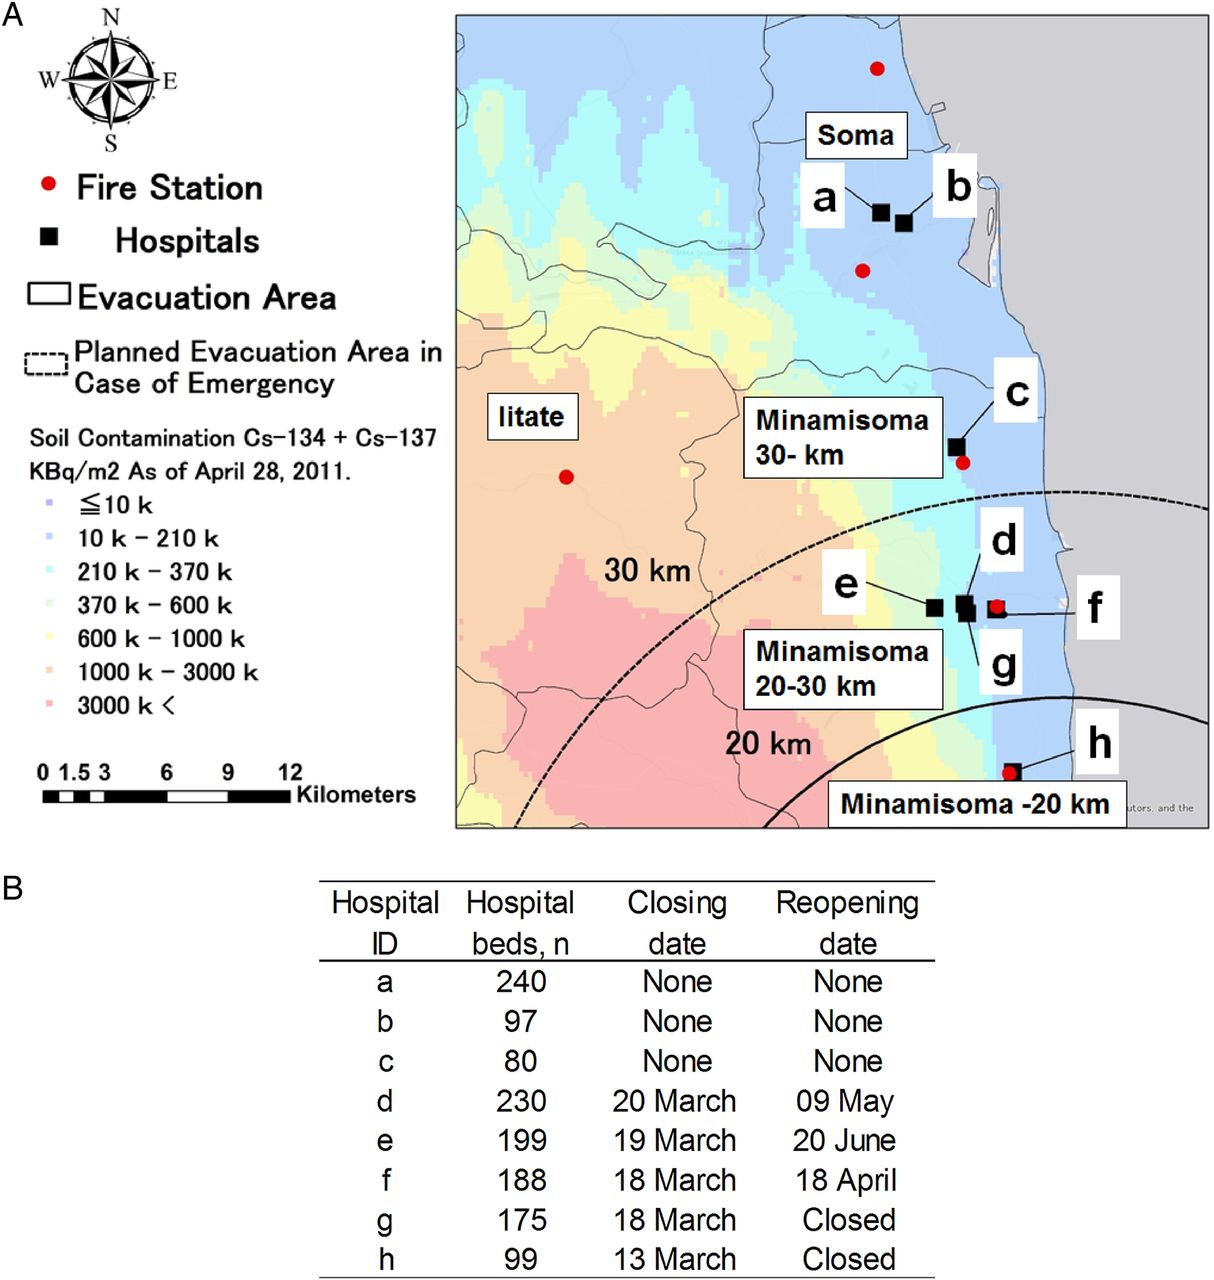
The 2011 accident at the Fukushima Daiichi Nuclear Power Plant in Japan was one of the worst nuclear disasters ever seen in a developed country. Soma district in Fukushima, located from 10 to 40 km north of the plant, was damaged by the triple disaster (earthquake, tsunami and nuclear accident), with particularly severe impacts of the nuclear accident. A Nuclear Emergency Situation was declared, and a mandatory evacuation order was issued within the 20 km radius of the plant on 12 March 2011, with a voluntary evacuation zone additionally put into place 20–30 km from the power plant (figure 1A).17 The population of Soma district decreased from nearly 100 000 to 40 000 after the evacuation orders.18 Though no hospital facilities were severely damaged by the earthquake or tsunami, five of the eight hospitals with EDs in the district were closed (figure 1B).

(A) Five regions of the study area according to evacuation orders by the government after the nuclear accident; (1) Minamisoma, within 20 km of the plant; the area under mandatory evacuation orders after 12 March 2011, (2) Minamisoma, 20–30 km from the plant; designated as a voluntary evacuation area from 15 March to 22 April 2011, (3) Minamisoma, further than 30 km from the plant; under no evacuation orders, (4) Iitate; a rural mountain area located 25–45 km northwest of the nuclear plant, under mandatory evacuation orders after 11 April 2011 and (5) Soma; an area located more than 40 km to the north from the plant, under no evacuation orders. (B) The periods of hospital closures. Each letter corresponds to the hospital ID in (A). Source: Esri, HERE, DeLorme, MapmyIndia, © OpenStreetMap contributors, and the GIS user community.
Measurement of elapsed time of EMS transport is a useful way to evaluate the effects of unusual events on the functionality of EMS systems.10 ,19 ,20 The purpose of this study is to assess the influence of the 3.11 triple disaster on EMS systems. We investigated total EMS time (time from EMS call to arrival at a hospital) within EMS systems of Soma district for 9 months after the disasters, compared with a predisaster control period of 2 years and 3 months.
Methods
Design and setting
A retrospective study approved by the Ethics Board of the Minamisoma Municipal General Hospital was undertaken, using cases of patients transported by EMS in Soma district from 11 March to 31 December 2011. To determine the influence of the disasters on the EMS system, EMS data from this period were compared with the historical control data from 1 January 2009 to 10 March 2011 in this district. Soma district constitutes of four municipalities: Iitate Village, Minamisoma City, Soma City and Shinchi Town, of which populations as of 1 March 2011, were 6132, 70 752, 37 721 and 8178, respectively. These areas were served by eight hospitals with EDs and five fire stations with EMS depots. Five of the eight hospitals were closed within 10 days of the disasters (figure 1B). However, none of 152 EMS personnel in the fire stations evacuated. The study areas were divided into five regions according to evacuation orders by the government after the nuclear accident: (1) Minamisoma, within 20 km of the plant; the area under mandatory evacuation orders after 12 March 2011, (2) Minamisoma, 20–30 km from the plant; designated as a voluntary evacuation area from 15 March to 22 April 2011, (3) Minamisoma, further than 30 km from the plant; under no evacuation orders, (4) Iitate; a rural mountain area located 25–45 km northwest of the nuclear plant, under mandatory evacuation orders from 11 April 2011 and (5) Soma; an area located more than 40 km to the north from the plant, under no evacuation orders (figure 1A).
Data collection
EMS data from 1 January 2009 to 31 December 2011 were collected from the EMS transport records of the Soma Regional Fire Department. The transport records contained clinical and spatiotemporal data. Clinical data included age, sex and reasons of EMS call, main symptoms or symptoms, temporal data including time of the day, day of the week and geospatial data at the scene of EMS calls, fire stations and hospitals. Two independent reviewers (TM and MT) classified the main symptoms into 14 categories as follows: injuries due to the disasters, CPA, injuries unrelated to the disasters, chest pains, disturbance of consciousness (DOC), neurological symptoms, fevers, shortness of breath (SOB), general weakness, abdominal pains, unspecific pain, overdose/toxic exposure and self-harm based on past EMS studies.21 ,22 The total EMS time was defined from an EMS call to arrival at a hospital, and it was divided in three categories: response time, on-scene time and transport time.23 The definition of each segment was as follows; a response time was defined as time from an EMS call to arrival of an EMS vehicle at the patient's location; an on-scene time was defined as time from arrival at the patient's location to departure from it and a transport time was defined as time from departure from the patient's location to arrival at a hospital (excluding time for a triage at the EDs) (figure 2A). We converted geospatial data into longitude and latitude using Google maps,24 and calculated the actual network distance across roads from the fire station to the patient's location and from the patient's location to the hospital with ArcGIS 9.2 (ESRI; Redlands, California, USA).

(A) Definition of three time segments of total emergency medical service (EMS) time. (B)Description of the time course of study period: the duration during which total median EMS time had been significantly affected by the disasters, starting from week 0, 11–17 March 2011.
Statistical analysis
This study comprises two end points. The first is to investigate the extent of disruption on Soma district EMS transport services after the triple disaster as measured by the length of total EMS time. The second is to identify potential determinants contributing to this damage by identifying risk factors for prolonged EMS time during the affected period.
Primary analysis
The length of total EMS time was examined in every week, from the week of the earthquake (11–17 March 2011) defined as week 0. Data from each week from 11 March 2011 to 31 December 2011 were compared with the same week of the control period using a Mann-Whitney U non-parametric test.25 The affected period was defined as the duration during which total median EMS time had been significantly affected by the disasters, starting from week 0 (figure 2B). In order to assess the influence of the impact of the disasters on these variables, Student's t-tests were used to compare the distributions of clinical or spatiotemporal variables of EMS transports between the control and affected period.
Secondary analysis
A Poisson regression model was used to identify risk factors for prolonged EMS time during the affected period. The total EMS time in minutes was used as the dependent variable. Because of the properties of the Poisson regression, all results represent multiplicative changes in the total EMS time in minutes for a 1-unit change in the covariates. All clinical and spatiotemporal variables were included in the model. p Values of <0.05 were considered statistically significant.
Results
The initial data set included 2648 EMS call records between 11 March and 31 December 2011. Of the 2648 records, 334 were excluded because they were not transports to hospitals or they were transports between hospitals, and the remaining 2314 transports were studied. After excluding 94 transports of 2314 with missing or incomplete data of EMS time, the remaining 2240 transports were used for EMS time analysis. For the control period, of the initial 8384 records between 1 January 2009 and 10 March 2011, 7107 transports were included in this study. Of the 7107 transports, 7087 transports with adequate information of EMS time were used as control data for the EMS time analysis. There were no seasonal changes in the number of EMS transports or in the length of total EMS times per week during the control period (p=0.48 and 0.06 by the Kruskal-Wallis test, respectively).
Figure 3 shows trends in the number of EMS transports and total EMS time of the 2314 patients during the study period. A robust peak (n=182) was seen in the number of transported patients per week within the first week after the earthquake occurred on 11 March 2011, designated as ‘week 0’ in figures 2B and 3. Nearly half of these patients (83/182) were transported to during the first 2 days. The main reasons for transports in week 0 included injuries related to earthquake or tsunami (n=56), DOC (n=23), injuries unrelated to the disasters (n=14), abdominal pain (n=14), general weakness (n=13) and neurological symptoms (n=13). After week 0, the number of EMS transports decreased to a similar or lower level compared with the control period.
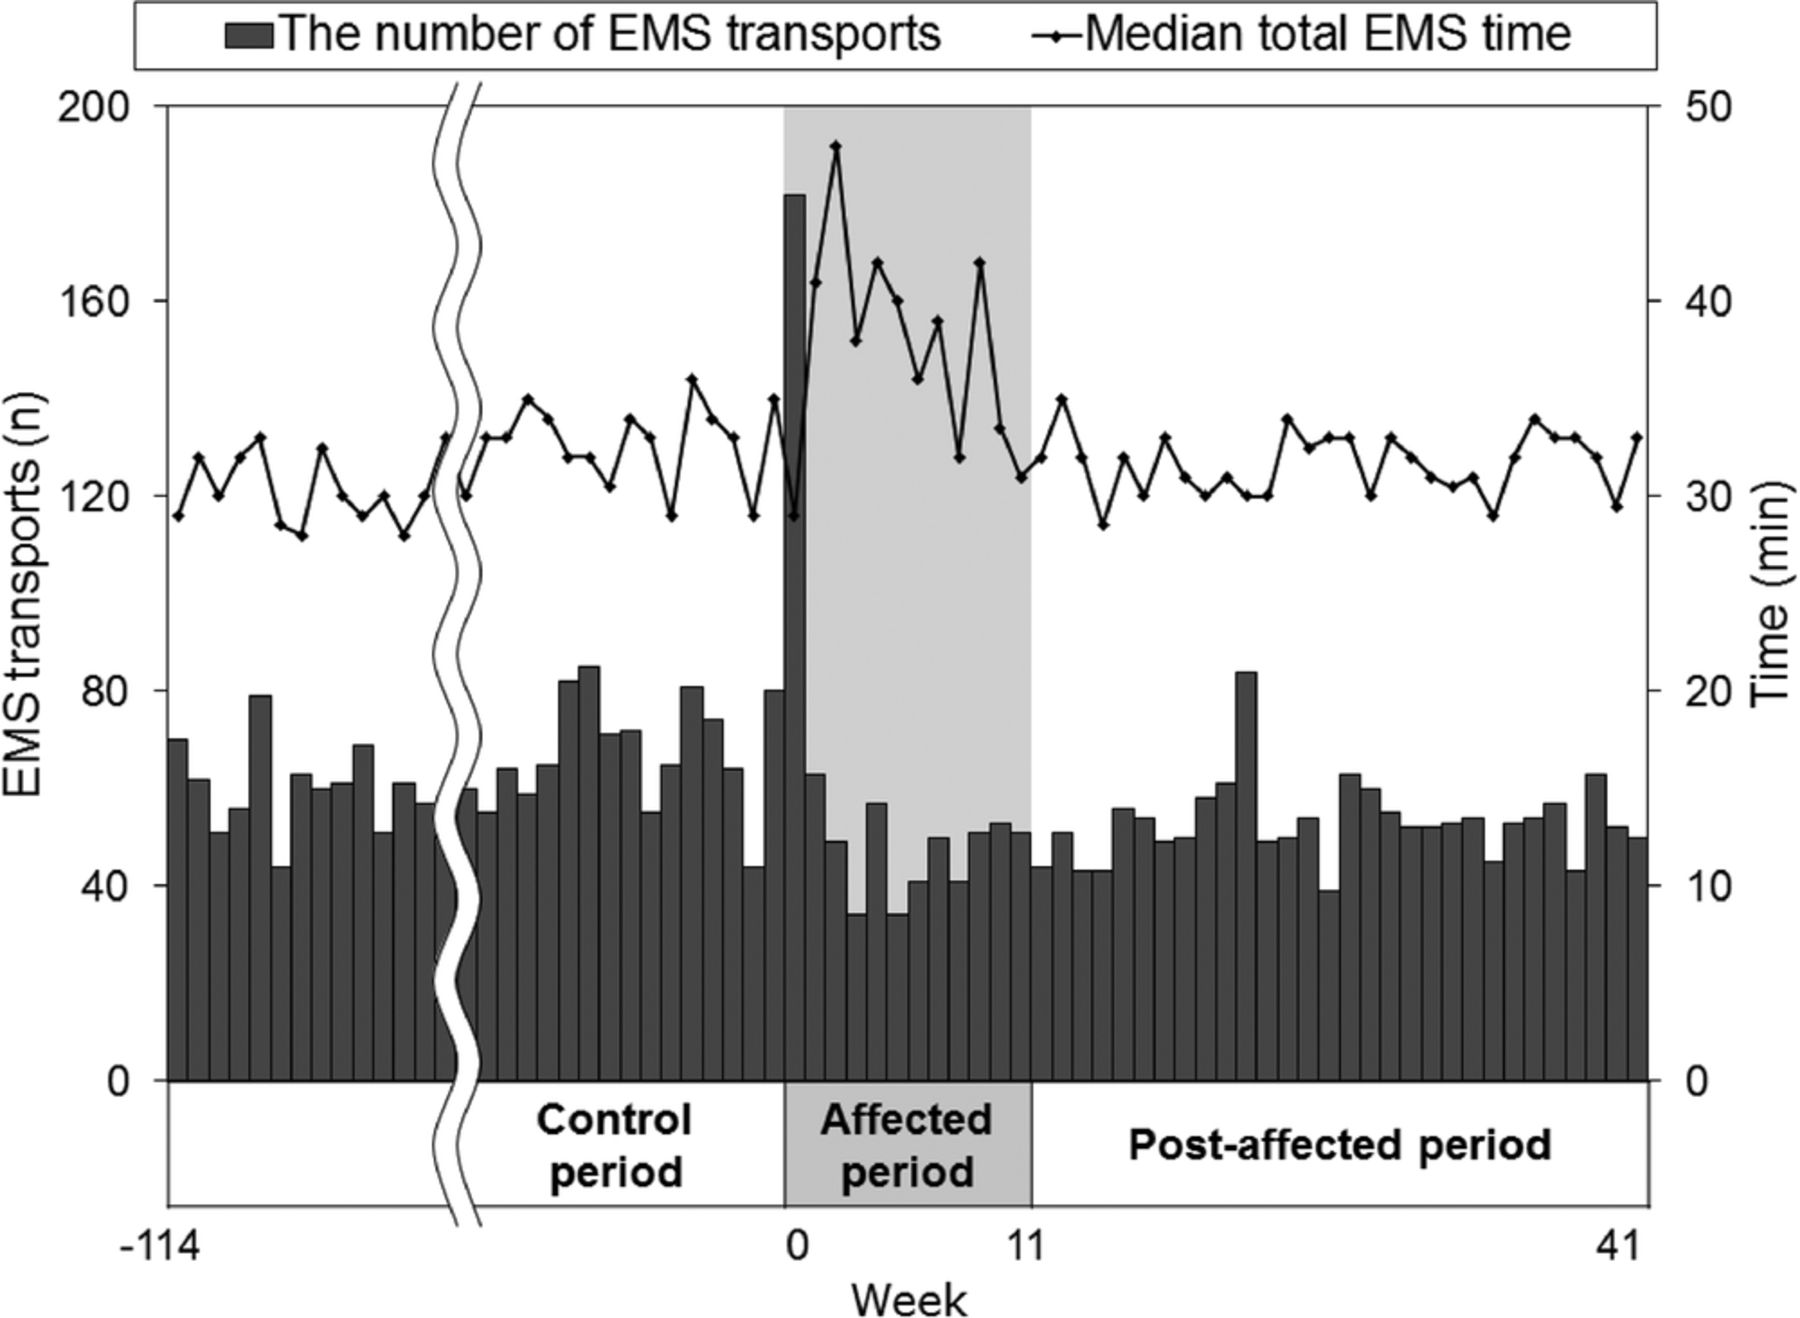
Trends in the number of emergency medical service (EMS) transports and median total EMS time. The week of the earthquake (11–17 March 2011) is defined as week 0.
The median total EMS time peaked at 48 min in week 2. Statistically extended total EMS time continued up to week 11 compared with the same durations of the control period (see online supplementary table S1). The affected period was identified from week 0 to 11 and 706 of 2314 transports in this period were further studied.
Table 1 shows the characteristics of EMS transport of the control and affected period. The average number of EMS transports per week was 62 and 59 in the control and affected periods, respectively. The number of transported children aged between 0 and 14 per week decreased from 3.5 to 1.9. The number of transports from areas within 20 km of the nuclear plant per week additionally decreased, from 7.0 to 1.4. As for destination areas, the number of transports to areas within 20 km (1.2 vs 0.3) and from 20 to 30 km of the nuclear plant (30.8 vs 13.6) decreased in the affected period from the control period. Notably, no participant claimed radiation exposure as a reason for EMS calls.
Characteristics of emergency medical service transports in the control and affected period
Table 2 shows the comparison of elapsed EMS time between the control and affected period. The median lengths of the total EMS times were prolonged to 36 (IQR 27–52) min in the affected period from 31 (IQR 24–40) min in the control period. As a result, the percentage of transports exceeding 60 min in total EMS time increased from 8.2% (584/7087) in the control period to 22.2% (151/679) in the affected period. Figure 4 shows the density curve for distributions of total EMS time and the three time segments during the control and the affected period. While means and medians of all three time segments had significantly increased during the affected period compared with the control period, the extension of change was the largest in transport time of the three time segments (table 2, standardised mean difference: 0.41 vs 0.13–17).
Comparison of emergency medical services time between the control and affected period

The dense curves of total emergency medical service time and three time segments; response time, on-scene time and transport time during the control and affected period.
A multivariate analysis was used to illustrate the patient group with prolonged total EMS time in the control and affected period (table 3). The total EMS time was associated with the distance from the fire station to the scene of EMS call and the distance from the scene of EMS call to the hospital in the control and affected period (relative ratio of total EMS time (RR): 1.02 per kilometre for all). In addition, the extension of total EMS time was, in the control and affected period, associated with EMS transports at night (from 18:00 to 6:00, RR: 1.06–1.14 and 1.06–1.07) and EMS calls from Iitate, the mountainous area far from emergency hospitals (RR: 1.07 and 1.15). Conversely, in the control and affected periods, reduced total EMS time was associated with EMS transports of children aged 0–14 (RR: 0.89 and 0.79), of females (RR: 0.99 and 0.97), from the area within 20 km from the nuclear plant (RR: 0.83) and transports due to CPA (RR: 0.89) or due to self-harm (RR: 0.86). Although 10 of 14 reasons for EMS calls were associated with the total EMS time in the control period, this proportion dropped to 5 of 15 in the affected period, with the added category of disaster-related calls.
Multivariate Poisson regression model for total emergency medical services time in the control and affected period
Discussion
This study is the first study to assess an EMS system in Fukushima after the triple disaster. The results of this study indicate that the median total EMS time was prolonged from week 1 to 11 after the triple disaster and recovered to the predisaster control level from week 12.
It is possible that the extension of EMS time from the week 1 to 11 was related to prolonged transport distance from the scene of EMS calls to the hospitals. This hypothesis is supported by several findings. First, results of the multivariable model indicate that the effect of the distance for EMS transport per kilometre on total EMS time was similar in the affected period to that in the control period (RR: 1.02 vs 1.02). Second, the largest change of the three time segments was seen in transport times (table 2), suggesting that the extension of EMS time can be mainly attributed to prolonged transport distance from the scene to the hospitals. Third, the number of the transports per week to hospitals outside Soma district significantly increased, from 5.7 (9.1%) to 16.7 (28.4%), while those to hospitals within 30 km from the nuclear plant in Minamisoma City significantly decreased (32.0 vs 13.9, table 1).
As to the reason for distance prolongation, we presume that hospital closures had been a main cause as the affected period was chronologically consistent with the duration of hospital closures, from the timing of the closings of five hospitals in weeks 0 and 1 (figure 1B) until the timing of the reopening of three hospitals in weeks 5, 8 and 14 (see online supplementary figure S1). There were two kinds of hospital closures in Soma district. First, one of the five hospitals was located in the mandatory evacuation area, and forced to evacuate on 12 March 2011. Second, the other four closed hospitals were located in the voluntary evacuation area and it is true that multiple reasons could have led to their closure. However, our discussion with hospital administrators suggest that the main cause of hospital closures in the study area was due to a lack of human resources and material resources, including food and drugs in these hospitals. For instance, Minamisoma Municipal General Hospital, with the most bed in Soma district, has closed after 71 of the 239 staff voluntarily evacuated following the nuclear accident without mandatory evacuation orders.26 Voluntary evacuation of hospital staff after a disaster was similarly reported after the Three Mile Island accident or Chi-Chi earthquake.16 ,27 In all, four emergency hospitals located in the voluntary evacuation area and one in the mandatory evacuation area were closed by week 1 (figure 1B). As the hospitals with EDs in Soma district did not suffer from physical damage to the hospital buildings, we presume that the hospital closures were related to staffing issues rather than damage to physical infrastructure. It is of note that EMS staff had continued working even in the evacuation areas, which may highlight a different response to a disaster between hospital and EMS staff. Past studies have indicated that EMS staff may be more likely than other medical staff to take risks for people in need.28 ,29 It can be hypothesised that hospitals could be more vulnerable to staff shortages than EMS after disasters.
supplementary figure
The relationship of total EMS time and the timing of closing and reopening of hospitals. Each letter corresponds to the hospital ID in figure 1.
Interestingly, this study suggests that the extension of EMS times was not limited to evacuation areas. In the affected period, total EMS time was prolonged in all area of Soma district, not only the 30 km from the nuclear plant where hospital closures occurred. The multivariate analysis suggests that the influence of the call location on total EMS time was similar in the affected period to that in the control period, which indicates that EMS transports from within 30 km from the plant were not delayed more than other areas (table 3).
It is worth nothing that mass casualties from the disaster did not disrupt the EMS system in Soma district in this study. The number of EMS transports was 2.9 higher than that before the disasters in week 0. Approximately one-third of these patients were transported due to injuries from the earthquake and tsunami (57/182), while no patient was transported due to acute radiation exposure. In spite of the increased number of transports, total EMS time was not prolonged in week 0. In past disasters, it has been reported that mass casualties can extend total EMS time.30 ,31 This suggests that the number of casualties of the triple disaster did not overcome the capacity of the EMS systems in Soma district.
Limitations
Since the EMS database lacks information concerning vital signs, mental status, mortality or outcome, the severity of patient status or the outcome of EMS transport could not be assessed. In addition, due to lack of data on the population of Soma district from March to May 2011, the relationship between EMS transports and population immediately after the disasters could not be evaluated.
This study was unable to assess transports within a 10 km radius of the nuclear plant because Soma Regional Fire Department did not cover this area. As a result, the areas investigated in this study were restricted to places with relatively low radiation levels, and the results of this study may not be applicable to areas significantly contaminated in radiation-release accidents.
Conclusion
This study shows that the elapsed time in EMS transport was significantly prolonged from week 1 to 11. These delays were likely attributable to the closure of hospitals with EDs after the nuclear disaster.
Acknowledgments
The authors are grateful to all of the staff in emergency departments or hospitals in Soma district who have managed patients in the aftermath of the disasters.
References
Footnotes
Contributors TM, MT, MK and TO developed the concept and designed the study. SO, KT and SK supervised the data collection. TM, MT, YS, SF and CL collected and managed the data, including quality control. SN and TF provided statistical advice on study design and analysed the data. TM drafted the manuscript and all authors contributed substantially to its revision. TM takes responsibility for the paper as a whole.
Funding This research received no specific grant from any funding agency in the public, commercial or not-for-profit sectors.
Competing interests None declared.
Provenance and peer review Not commissioned; externally peer reviewed.
Data sharing statement No additional data are available.