Article Text

Abstract
Objectives This research studies the impact of influenza epidemic in the slum and non-slum areas of Delhi, the National Capital Territory of India, by taking proper account of slum demographics and residents’ activities, using a highly resolved social contact network of the 13.8 million residents of Delhi.
Methods An SEIR model is used to simulate the spread of influenza on two different synthetic social contact networks of Delhi, one where slums and non-slums are treated the same in terms of their demographics and daily sets of activities and the other, where slum and non-slum regions have different attributes.
Results Differences between the epidemic outcomes on the two networks are large. Time-to-peak infection is overestimated by several weeks, and the cumulative infection rate and peak infection rate are underestimated by 10–50%, when slum attributes are ignored.
Conclusions Slum populations have a significant effect on influenza transmission in urban areas. Improper specification of slums in large urban regions results in underestimation of infections in the entire population and hence will lead to misguided interventions by policy planners.
- INFECTIOUS DISEASES
This is an Open Access article distributed in accordance with the Creative Commons Attribution Non Commercial (CC BY-NC 4.0) license, which permits others to distribute, remix, adapt, build upon this work non-commercially, and license their derivative works on different terms, provided the original work is properly cited and the use is non-commercial. See: http://creativecommons.org/licenses/by-nc/4.0/
Statistics from Altmetric.com
Strengths and limitations of this study
A detailed social network has been used for the first time to study epidemics on slums and the larger urban population in which they reside.
Omitting the effect of slums will lead to misguided interventions by policy planners.
With over a billion people living in slums, the results have broader impact.
Owing to lack of space, the effect of interventions will be discussed in a follow-on paper.
Introduction
Slums are characterised by overcrowding, lack of clean water, poor sanitation and poor medical facilities. This combined with low vaccination rates, poor education and self-medication, result in high vulnerability to infections. Diseases like cholera, malaria, dengue, Ebola and HIV are common in slums across the world.1–3 According to the United Nations,4 the global number of slum residents is more than 1 billion, which is over one-third of the world's urban population and a seventh of all humanity, and this number is estimated to double to about 2 billion by 2030.
India has about one-third of the global slum population. A study of eight cities in India finds that in Delhi, 48% of households in slums have five or more people sleeping per room, compared with 19% of non-slum households.5 The overcrowded living conditions facilitate the spread of infectious diseases, especially airborne infections like influenza.6 ,7
In general, high-density areas in developed and developing countries are associated with poverty and higher incidence of diseases. In the US, counties in 14 states show correlation between higher census tract-level poverty with higher influenza-related hospitalisation.8 ,9 Yousey-Hindes and Hadler10 find mean annual incidence of paediatric influenza-based hospitalisation in high-poverty and high-density areas to be at least three times higher in New Haven, Connecticut whereas Kumar et al11 detect a steeper, earlier influenza rate increase in high-poverty census tracts in New Haven.
Thus, it is not surprising that understanding and improving the health and lives of slum dwellers has been identified as one of the most pressing developmental challenges of the 21st century.6 ,12 This research takes a step in this direction by quantifying the effect of slum population attributes (including residents' activity patterns) on the spread of influenza. Our methods also address several of the challenges cited in Pellis et al13 including developing more realistic heterogeneous populations and determining their effects on epidemic outcomes in and outside slums.
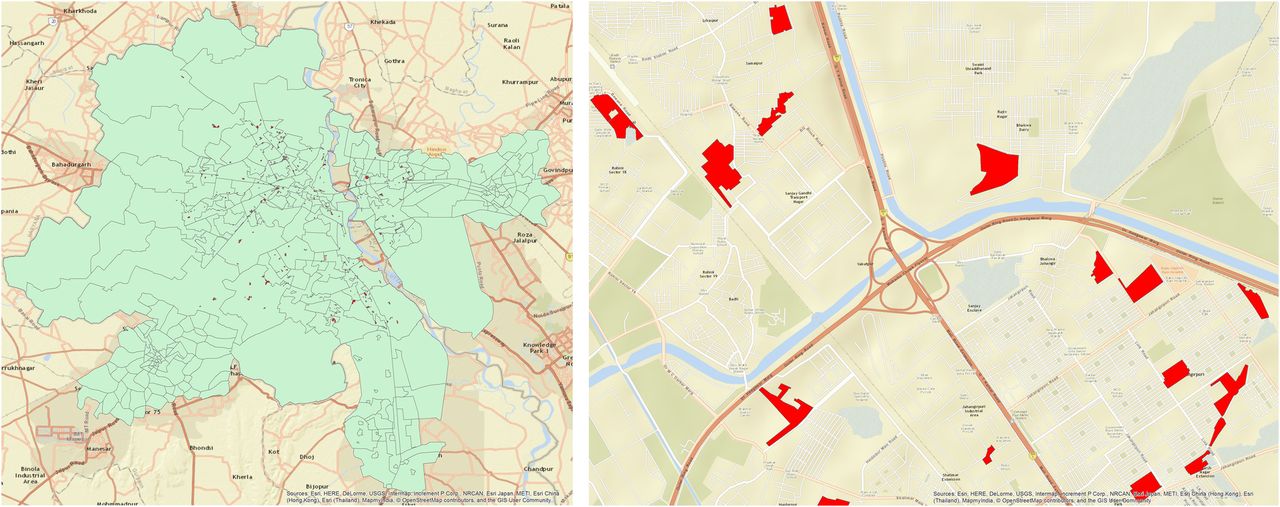
The focus of this research is the slum population of Delhi, the National Capital Territory of India. See figure 1 for maps of Delhi and a zoom-in of some slum zones (regions). Spread and control of influenza on a synthetic social network of Delhi has been studied in Xia et al14 but it did not model the special attributes of the slum population such as larger household size and different types of daily activity schedules. Both slum and non-slums residents were treated in the same manner. For our study, this is the baseline population, and to the best of our knowledge, the resulting social network is a state-of-the-art representation of daily contacts/interactions of human agents in Delhi, India. However, our study also uses a second network constructed as part of this research: a highly refined social network of Delhi, which accounts for slum demographics and activities. There are 298 geographic slum regions in Delhi, containing about 13% of Delhi population. A slum region is defined in India Census as a residential area where dwellings are unfit for human habitation due to overcrowding, lack of ventilation, light or sanitation, or a combination of factors that are detrimental to safety and health. Agent-based simulations, where each individual is represented as an agent, are conducted for both social networks of Delhi, that is, the original one in Xia et al14 and the refined one. The goals are to understand how epidemic dynamics differ between slum and non-slum populations, and how these dynamics differ from those in a networked population that ignores the effects of slums, and later use this understanding to design appropriate interventions.

Left: Map showing the geographic extent of Delhi, India (in green background) that is modelled in this work. Right: Zoom-in view to show the irregular shapes and locations of some of the 298 slum zones (in red). The population and social contact network are discussed in the Methods section.
To the best of our knowledge, there have been no epidemic simulations of realistic, large urban areas (eg, with several millions of people) that include the effects of slums (their geographic locations, compositions, unique home characteristics, and agent-resolved activity patterns) on infectious disease dynamics. However, many researchers have pointed out the importance of studying slums; for example, see Desai et al,3 Firdaus,15 Go et al,16 Sur et al,17 Riley et al18 and Sclar et al.12
Methods
Population generation: We start with a pre-existing Delhi synthetic population,14 developed from LandScan and census data for Delhi, a daily set of activities of individuals, their demographics and the locations of activities collected through surveys by MapMyIndia.com. New data produced in this study include ground survey data on Delhi slum residents' demographics and daily activity sets collected by Indiamart.com. We developed the survey instruments and our commercial partners in India gathered the data. Data on the geographic extents of slum zones in Delhi, in the form of spatial polygons, were obtained from MapMechanic.com. The geographic extent of Delhi and representative slum zone locations and sizes are provided in figure 1. Note the irregular shape of Delhi and the slum zones in figure 1, as well as the locations of slum zones.
The population generation process—augmented for the slums and slum residents—assigns slum-specific characteristics, demographics and activities to the individuals whose homes are in those regions. In particular, those who live in slums are those whose home locations are in slum zones. These home locations have (latitude, longitude) coordinates as attributes, and hence homes can be identified as being inside or outside of slums. Since each human agent is assigned a home (and hence home location), each person can be identified as a slum or non-slum resident according to whether the person's home is located in a slum zone using data such as those shown in figure 1. Thus, the number of individuals is the same in the population without slums and the population with slums. The slum population constitutes about 13% (1.8 million) of the entire Delhi population of 13.8 million people. Over half (186) of the slum zones have fewer than 5000 people; 59 zones have between 5000 and 10 000; and the remainder (53) of the zones has between 10 000 and 49 490 people. See online supplementary figures S1–S3 for distributions of age, populations of the 298 slum zones and household size, respectively.
supplementary data
For slum and non-slum individuals, we divided activities into the following six categories: home, work, shopping, school (for youths), college (for older adolescents and adults) and other. We combine all these data sets to produce a highly resolved, geolocated and contextualised population of Delhi with slums integrated in it, using the methodology described in refs. 19 and 20. More details on the survey datasets and population generation methodology are provided in the online supplementary information.
Resulting networks: Social contact networks are generated from populations as follows. Each person has a home location and a set of daily activities that includes one or more of work, shopping, school, college and other. Each activity means that an individual ‘visits’ a particular location for the activity, with a start and an end time. When two people visit the same location, and their visit times overlap, they interact, meaning that disease or virus may be transmitted from an infectious person u to a susceptible one v. This means that a network representation of the population has an undirected edge {u,v}. This is precisely how the social contact network is formed. Each edge in the network is labelled with the activities of two individuals in the interaction, and the duration of the interaction. The duration of interaction is used in the epidemic computations below. Each individual has attributes from the population generation process that include age, gender and household ID. But now, the activities of a person that result in interactions with others are encoded as the network edges.
The original social contact network of Delhi, called Network 1, treats the slum regions like any other region in Delhi in terms of household sizes, assignment of demographics and individual activities. The enhanced Delhi network, called Network 2, produced as part of this work, includes 298 slum geographic regions (zones) in Delhi. We provide selected comparisons between the two networks, with additional data.
First, a major difference between Networks 1 and 2 is that Network 2 has more home-related contacts because the average non-slum household size is 5.2 whereas in the slum regions it is 15.5. Second, there is a 15% increase in number of daily activities in the slum network: 33 890 156 individual activities per day in Network 1 versus 39 077 861 activities in Network 2. According to the activity survey, slum individuals have more varied activities than non-slum individuals (see online supplementary figure S4, category ‘other’). The increased number of activities of slum individuals translates into ∼10% increase in average interactions (degree) and average density of ties among individuals (clustering coefficient): 30.4 and 0.680, respectively, for Network 1 versus 33.4 and 0.733, respectively, for Network 2.
Looking in more detail at the different types of interactions (eg, a contact between slum and non-slum persons is called a ‘slum–non-slum’ contact), we observe the interplay between the number of contacts of different types and the durations of contacts. The effect of the contact durations is significant because the probability of disease transmission between an infected person and a susceptible one is an exponential function of contact duration. Using the average duration of a slum–non-slum contact as a baseline, we observe that the average durations of slum–slum and non-slum–non-slum contacts are 2.5 times and 3.2 times greater than baseline, respectively (see online supplementary figure S5, the last set of bars under x-axis value of ‘all’). These last two values are non-intuitive because there are more people in a slum house than in a non-slum house. Consequently, one would expect the average contact duration between two slum people to be greater than that for two non-slum people. However, non-slum residents have longer contact durations at work (see online supplementary figure S6, category work). We will see in the results below that the lesser contact duration between two slum individuals compared with two non-slum individuals is more than offset by the larger average number of contacts of slum individuals compared with non-slum people, that is, 67.4 vs 28.3 (see online supplementary figure S7). This latter difference is a result of the greater variety of activities of slum people. The online supplementary information addresses these and other features and differences among Delhi subpopulations.
Disease model: We use an SEIR model where each of the 13.8 million individuals can be in one of four states at any given time: Susceptible (S), Exposed (E), Infectious (I) and Removed or Recovered (R). We seed the epidemic in a susceptible population with 20 initial infections that are randomly chosen. Results are not sensitive to the number of initial infections; that is, varying the number of index cases did not change the outcomes of our experiments. An infectious node u spreads the disease to each susceptible neighbour v independently with a certain probability, referred to as the transmission probability.
The transmission probability is a function of the duration of contact. This probability is selected to simulate mild, strong and catastrophic influenza. For the Delhi contact network, the transmissibility values corresponding to mild, strong and catastrophic influenza are calibrated to be 0.0000215, 0.000027 and 0.00003, respectively.21 (Transmissibility is a multiplier on the contact duration of an interaction; the greater the transmissibility, the greater the transmission probability, for the same duration of contact.) Mild, strong and catastrophic transmission rates correspond to R0 equal to 1.05, 1.26 and 1.40 for Network 1 and 1.123, 1.39 and 1.54 for Network 2, respectively.14 ,22 The incubation period follows the distribution: 1 day (30%)/2 days (50%)/3 days (20%) and infectious period follows: 3 days (30%)/4 days (40%)/5 days (20%)/6 days (10%).20 ,23
If a susceptible node becomes exposed, it stays exposed for the incubation period and then switches to an infectious state for the infected duration, after which it is recovered or removed. Note that this state transition is irreversible and is the only possible disease progression. We refer to Newman,24 Dimitrov and Meyers25 for more details on stochastic models for epidemics. For every experiment, 25 runs are simulated and their mean results are reported; in the text, the full range of results is given to address variance. Each simulation run consists of seeding 20 individuals with influenza chosen uniformly at random, from a specified set of individuals (slum residents, non-slum residents, or the entire population). From these initially infected individuals, disease propagates across edges to infect susceptible agents. The details of the simulation parameters are provided in online supplementary table S1.
We used EpiFast, a fast discrete event simulator for disease propagation over a contact network.26 It is implemented in C++/Message Passing Interface (MPI) and uses a parallel algorithm, which enables scaling on distributed memory systems. EpiFast uses a disaggregated, agent-based model, which can represent each interaction between pairs of individuals and hence is used for studies of disease transmission.14 Disaggregated models require neither partitions of the population nor assumptions about large-scale regularity of interactions, as do compartmental models.
We have covered the population generation process, the network generation process, the influenza transmission model and simulations. It is evident that there are heterogeneities in all aspects of this work. Agent-based models are well-suited to capture spatial irregularities in slum zone geometries and locations, among individual-level characteristics including activities and demographics of slum and non-slum residents, and in connectivity patterns among individuals in the social networks. Other types of models, including differential equation-based (ie, uniform mixing),27 compartmental28 and patch models,29 where counts of agents in each state are maintained, do not have the ability to model individual traits at the level of granularity that agent-based models provide. For example, in the work by Pandey et al28 on the spread of Ebola, counts of people in different states (eg, infectious) is broken down into compartments such as those in the general community, in hospitals, and those that are healthcare workers.
Results
We start with a comparative analysis of epidemic dynamics on Networks 1 and 2 to understand the impact of integrating slums on epidemic measures. The latter parts mainly focus on Network 2. We also examine the effect of seeding the infections in slum versus non-slum regions on epidemic outcomes. In comparisons between the two networks, we use the same initially infected agents across corresponding diffusion instances between Networks 1 and 2, for better comparisons of results.
Epidemics on Network 1 vs Network 2
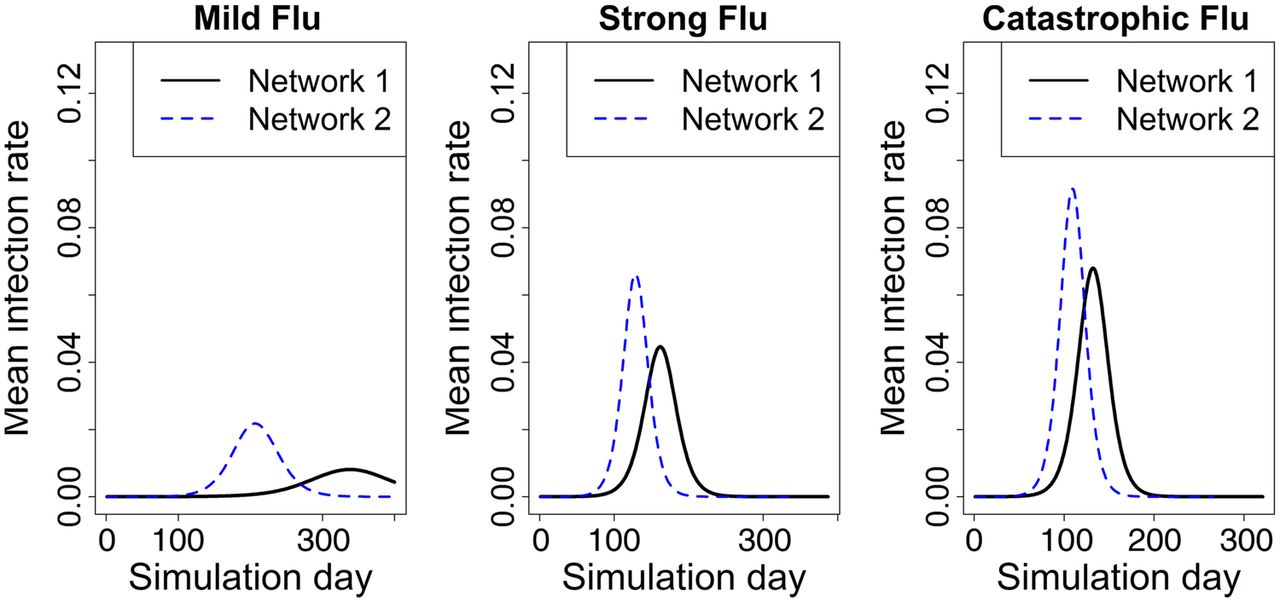
Figure 2 shows the mean epidemic curves, that is, the number of new infections per day, for the two networks under mild, strong and catastrophic influenza cases. Note that estimates of cumulative infection rate, peak infection rate and time to peak will be highly underestimated when Network 1 is used.

Average epidemic curves for two networks under different transmission probabilities. Epidemic starts with 20 random seed infections in each network. The mean infection rate is based on 25 replicates. Network 2 incorporates slum-specific features, while Network 1 does not.
We used two-sample Student's t-test to test the difference between the two networks under the same transmission rate for time to peak infection, peak infection rate and cumulative infection rate. All tests are statistically significant with p values smaller than 2.2e-16. The 95% CIs are also calculated. In case of Network 1, mild influenza does not cause an epidemic whereas for Network 2 it does. The time to peak infection is 131 (95% CI 120 to 141) days earlier on average in Network 2 for mild influenza, 34 (95% CI 31 to 37) days earlier for strong influenza and 23 (95% CI 21 to 25) days earlier for catastrophic influenza, compared with Network 1. Network 1 takes much longer to reach the peak of the infection—on the order of a few to many weeks—compared with Network 2 for all transmission probabilities, with differences being starker for mild influenza. This means that the speed of virus transmission is much faster in the actual population (with slums) than what policy planners would expect in a slum-free population.
Similarly, the peak infection rate is underestimated by a significant fraction under every influenza model in Network 1, as shown in figure 2. The peak infection rate is 162.6% (95% CI 161.8% to 163.4%) greater on average in Network 2 for mild influenza, 47.6% (95% CI 47.4% to 47.8%) greater for strong influenza, and 33.2% (95% CI 33.2% to 33.4%) greater for catastrophic influenza, compared with those in Network 1. The cumulative infection rate (or attack rate) is also underestimated. Under the same transmission rate, the cumulative infection rate is 78.5% (95% CI 73.4% to 80.7%) greater on average in Network 2 for mild influenza, 16.1% (95% CI 16.1% to 16.2%) greater for strong influenza, and 11.0% (95% CI 11.0% to 11.1%) greater for catastrophic influenza, compared with those in Network 1.
Figure 3 shows the cumulative infection rates for different subgroups (slum, age and gender) in the two networks. An agent can be part of many of these subgroups; for example, a woman aged 34 who resides in a slum. The figure caption describes the details of the subgroups listed on the x-axis.

Cumulative infection rates for different subgroups in the two networks. ‘Total’ refers to the entire population of Delhi. ‘Slum’ and ‘Nonslum’ refer to slum and non-slum regions, respectively. ‘Male’ and ‘Female’ denote the total number of males and females in Delhi, respectively. The age subgroups are denoted from ‘AG1’ to ‘AG9’, where ‘AG1’ refers to all individuals between age 0 and age 10 in Delhi, ‘AG2’ refers to individuals between age 11 and age 20 and so on.
The cumulative infection rate in the slum, as shown by Network 2, is higher by more than 20 percentage points compared with non-slums, under all influenza models. Network 1 makes no distinction between slum and non-slum regions, and thus both regions face the same infection rate in Network 1. Subpopulations by gender and age also show higher infection rates in Network 2. The difference in subpopulation-level infection rate between the two networks drops as the transmission rate increases from mild to catastrophic. A similar result was reported in Kumar et al.11 This outcome can be explained by the fact that when viral transmission is very high, as in the case of catastrophic influenza, the higher contact rates and other characteristics of 13% of individuals in the network do not matter as much. The high transmission rate dominates the impact arising from changes in the network structure. Females, young children and the oldest adults encounter relatively higher infection rates under all scenarios in both networks. Online supplementary figures S8 and S9 show differences in contact rates encountered by men and women at home and outside home, and with children, respectively. The higher contact rates of females with children and with others explain the incidence of higher infection rates among females.
Effect of seeding infections in slum versus non-slum regions
Rapid urbanisation is increasing the rise of urban slums and squatter settlements, especially in developing countries, and these areas are easy targets for seeding of epidemic-prone diseases such as influenza and Ebola.30 For example, West Point slum in Liberia was a focal point in the Ebola epidemic31 and in 2012 a cholera outbreak in the coastal slums of West Africa killed hundreds and infected more than 25 000 people.2
To understand the effect of seeding infections in slum versus non-slum areas, we randomly selected 20 individuals for seeding infections in (1) slum regions only; (2) non-slum regions only and (3) total Delhi population. For each case we simulated all three influenza models to check the robustness of the results across transmission rates.
Figure 4 shows the epidemic curves for the entire Delhi population under different seeding conditions and three different transmission probabilities, for Network 2. The simulation results indicate that initial seeding conditions make no difference on the overall infection rate of the entire population. Nor does it alter the peak infection rates. However, it does alter the time at which the infections peak. In particular, seeding in the slums results in faster spread of the influenza contagion. For strong influenza, average time to peak occurs at day 118 (range 114–125) when seeding is carried out in slums, whereas it is 131 (range 124–144) when seeding is carried out in non-slums and 128 (range 117–135) when seeding is randomly carried out in the entire population.

Epidemic curves under different seeding conditions. Epidemics were seeded by randomly selecting 20 individuals in (1) slum regions only; (2) non-slum regions only and (3) total Delhi population, in Network 2. The three panels show mean infection rate over 25 replicates under mild, strong and catastrophic influenza models.
Demographics and network structure impact infection rates in slums
In order to design effective interventions, it is important to examine which slum-specific attributes help explain changes in cumulative infection rates. We use a regression model to study the relationship between infection rate and slum-specific features using a simple linear regression model. There are a total of 298 slum zones in Delhi. For each zone, we calculated the cumulative infection rate, for each influenza type, that is, mild, strong and catastrophic, to be used as the response variable in the regression.
For slum-specific variables, we calculated for each slum zone: slum-zone population, average degree for each activity type (ie, home, work, shopping, other, school, college), average degree for all activities in total, number of edges in each slum-zone, network density (the total number of edges within a slum zone divided by the maximum possible number of edges) in each slum-zone, average degree within slum-zones for each of the six activity types and in total, average degree of nodes connected to non-slums for activity types 2–6 and total and average household sizes in each slum zone. Next we identified the mutually correlated variables, which were average degree for home, average degree for shopping, average degree within slum for home, and all average degree connected in non-slum. We removed the correlated variables and then conducted variable selection using a bidirectional elimination method (using R function ‘both’), which is a combination of forward and backward elimination, testing at each step for variables to be included or excluded in the model using Akaike Information Criterion (AIC).
According to AIC, the average number of contacts within a slum zone and the average household size of slums are significant for all influenza models. Table 1 reports the estimates of regression coefficients as well as other statistics in detail. A companion paper will use this information to design effective interventions in slum-specific regions to control the spread of influenza in the Delhi population.
Linear regression model estimates for mild, strong and catastrophic influenza for slum zones
Discussion
Even though slum regions contain only 13% of the total population of Delhi, omitting their effects underestimates the cumulative infection rates, the time to peak infection and the peak infection rates. These results are robust under all influenza models considered here. The speed and the size of virus transmission is faster and underestimated in the actual population (with slums modelled in Network 2) than what policy planners would expect in a slum-free population (Network 1).
Our results show that (1) if slums' attributes are not appropriately integrated in the population, estimates of epidemic measures such as epidemic size, its peak value and time to peak are underestimated (by magnitudes of 10–50% or more; eg, for strong influenza, accounting for slums increases the peak infection rate by 47.6%); (2) infection rates by subpopulation show that the slum subpopulation has infection rates that are 20 percentage points higher than those in the non-slum subpopulation; and females and young children encounter higher infection rates in the overall population; and (3) the epidemic size and peak infection rate are independent of where the infection is seeded, that is, slum or non-slum. However, the time-to-peak infection changes with seed locations. Average time-to-peak infection is 118 (range 114–125) days when infection is seeded in slum regions compared with an average of 131 (range 124–144) days when it is seeded in non-slum regions. The averages are based on 25 runs for each case and ranges show the minimum and maximum time-to-peak values across 25 runs. The qualitative aspects of these results are important because they may extend to other cities and countries, and possibly to other infectious diseases.
We also show that initial conditions in terms of seeding locations have no significant impact on the total attack rate and peak infection rate. However, seeding in slums results in faster initial spread of the disease contagion. Among all subpopulations, slums are most vulnerable to the spread of influenza. Thus, special attention and appropriate interventions should be applied to slums in order to control the spread of virus in slum areas and also in the entire region. Furthermore, these results may be useful in analysing epidemics in other countries and regions with slum populations.
This research demonstrates the need to model slum populations who are more vulnerable to infectious diseases due to large family size, crowded environment and higher mixing rates within and outside slum regions. Ignoring the influence of slum characteristics on their urban environment underestimates the speed of an outbreak and its extent and hence leads to misguided interventions by public health officials and policy planners. Moreover, since the models show that time to peak infection decreases by weeks when slum regions are modelled appropriately, policy planners have significantly less time to react to an outbreak. Finally, the results may have even broader impact for policy planners since over a billion people in the world live in slums. Consequently, these results may be useful for policymaking in several countries, and possibly for other infectious diseases.
Model limitations
This model does not consider differences in susceptibility that might occur due to age, pre-existing conditions, and comorbidities. The entire population is assumed to be susceptible at the beginning of the simulation, except for the index cases. In reality, the infants, older people, hospital workers, etc, may be more susceptible than others.
References
Footnotes
Contributors CK, AM, AV and HM designed and conceived the study. SC, YC, DX, MK and JC built the social network, carried out the experiments and simulations. JC, SC and AV performed the data analysis. JC, SC, YC, MK, CK, AM, HM, AV and DX helped with reviewing the results, and writing of the paper.
Funding This work has been partially supported by the National Institutes of Health (NIH) (grant number 1R01GM109718), NIH Models of Infectious Disease Agent Study (MIDAS) (grant number 2U01GM070694-11 and 3U01FM070694-09S1), National Science Foundation (NSF) Interface between Computer Science and Economics and Social Science (ICES) (grant number CCF-1216000), Network Science and Engineering (NSF NetSE) (grant number CNS-1011769), NSF Research Traineeship (grant number NRT-DESE-154362), Defense Threat Reduction Agency (DTRA) (grant number HDTRA1-11-1-0016), and DTRA Comprehensive National Incident Management System contract (grant number HDTRA1-11-D-0016-0001).
Competing interests None declared.
Ethics approval Virginia Tech Institutional Review Board reviewed and approved the survey protocol.
Provenance and peer review Not commissioned; externally peer reviewed.
Data sharing statement Data pertaining to epidemic curves, regression analysis and statistical analysis can be obtained by contacting the corresponding author through email.