Article Text

Abstract
Objective Many published meta-analyses are underpowered. We explored the role of trial sequential analysis (TSA) in assessing the reliability of conclusions in underpowered meta-analyses.
Methods We screened The Cochrane Database of Systematic Reviews and selected 100 meta-analyses with a binary outcome, a negative result and sufficient power. We defined a negative result as one where the 95% CI for the effect included 1.00, a positive result as one where the 95% CI did not include 1.00, and sufficient power as the required information size for 80% power, 5% type 1 error, relative risk reduction of 10% or number needed to treat of 100, and control event proportion and heterogeneity taken from the included studies. We re-conducted the meta-analyses, using conventional cumulative techniques, to measure how many false positives would have occurred if these meta-analyses had been updated after each new trial. For each false positive, we performed TSA, using three different approaches.
Results We screened 4736 systematic reviews to find 100 meta-analyses that fulfilled our inclusion criteria. Using conventional cumulative meta-analysis, false positives were present in seven of the meta-analyses (7%, 95% CI 3% to 14%), occurring more than once in three. The total number of false positives was 14 and TSA prevented 13 of these (93%, 95% CI 68% to 98%). In a post hoc analysis, we found that Cochrane meta-analyses that are negative are 1.67 times more likely to be updated (95% CI 0.92 to 2.68) than those that are positive.
Conclusions We found false positives in 7% (95% CI 3% to 14%) of the included meta-analyses. Owing to limitations of external validity and to the decreased likelihood of updating positive meta-analyses, the true proportion of false positives in meta-analysis is probably higher. TSA prevented 93% of the false positives (95% CI 68% to 98%).
- STATISTICS & RESEARCH METHODS
- PUBLIC HEALTH
- EPIDEMIOLOGY
This is an Open Access article distributed in accordance with the Creative Commons Attribution Non Commercial (CC BY-NC 4.0) license, which permits others to distribute, remix, adapt, build upon this work non-commercially, and license their derivative works on different terms, provided the original work is properly cited and the use is non-commercial. See: http://creativecommons.org/licenses/by-nc/4.0/
Statistics from Altmetric.com
Strengths and limitations of this study
This is an empirical review exploring the quantity of early type 1 errors in cumulative Cochrane meta-analyses of binary outcomes which become negative when sufficiently powered.
Addressing random error (ie, play of chance) alone, without consideration of systematic errors (ie, bias).
We defined a negative result as one where the 95% CI for the relative risk of the intervention in the meta-analysis included 1.00 (p ≥0.05).
Published meta-analyses that are sufficiently powered and have a negative result are extremely rare.
Empirical investigation of random error in systematic review and meta-analysis is an important research agenda that has so far been largely ignored.
Trial sequential analysis was able to control the majority of the false positive meta-analyses.
Introduction
The majority of published Cochrane meta-analyses are underpowered.1 From simulation studies, we know that random errors frequently cause overestimation of treatment effect when meta-analyses are small.2 When meta-analyses are repeatedly updated over time, the risk of random errors is further increased.3 This increased error is analogous to the increased risk of error present when interim analyses are performed in a single trial. In a single trial, it has long been accepted that adjustments are required for the increased random error caused by sparse data and repetitive testing4 and monitoring boundaries, incorporating the sample size calculation, are commonly used to control the risk of random error at desired levels and to allow us to make inferential conclusions.5–7
The risk of type 1 errors in underpowered meta-analyses that are subject to continuous updating is higher than the conventional probability of 5%. This increased risk has been demonstrated by theoretical arguments,8 ,9 evidence from simulation studies,2 ,3 ,10–12 and evidence from empirical work.13 Given that so many published Cochrane meta-analyses are underpowered and subject to continued updating, this increased risk of error is concerning. As much as we would like our conclusions to be definitive, good clinical decisions require accurate estimation of uncertainty. It is better for meta-analysts to communicate greater error more accurately than to infer less error inaccurately.
Several techniques can control the increased random error risk in the context of sparse data and repeated updates in cumulative meta-analysis. Examples include trial sequential analysis (TSA),14–17 a semi-Bayes procedure,18 sequential meta-analysis using Whitehead's triangular test19 and the law of the iterated logarithm.10 There is, however, a lack of consensus about the necessity to use these techniques.8 ,20–22
Empirical work so far has suggested that TSA provides robust protection of type 1 error in real life meta-analyses.16 We aimed to expand this exploration. For the purpose of this study, we define a negative result of a meta-analysis as one with a 95% CI for the effect that includes 1.00 (consistent with a p value ≥0.05). We define a positive result of a meta-analysis as one with a 95% CI of the effect that does not include 1.00 (consistent with a p value <0.05). And we define sufficient power as reaching or surpassing the required information size (RIS) for 80% power, 5% type 1 error, using a relative risk reduction (RRR) of 10% or a number needed to treat of 100 for effect size and with the control event proportion and heterogeneity taken from the included studies.
Objectives
This study aimed to explore how TSA can contribute in the assessment of type I errors in underpowered meta-analyses. The theoretical goal of TSA is to protect against the effects of type I (and type II) random errors when data are sparse and are repetitively tested.15 ,17 ,23 In the present study, we focus only on type I errors.
Methods
Eligibility criteria and information sources
We screened all systematic reviews published in The Cochrane Database of Systematic Reviews,24 starting at the time of our search, October 2013, and going back to January 2010. We selected meta-analyses that had a binary outcome, sufficient power and a negative conclusion. We focused in the present study on the risk of random type I error, and did not include an assessment of systematic error (bias) in our selection of these meta-analyses.
Our inclusion criteria were:
The outcome was binary.
Sufficient power—defined for this study as reaching or surpassing the RIS for 80% power, 5% type 1 error, using a RRR of 10% or a number needed to treat of 100 for effect size, and with the control event proportion and heterogeneity taken from the included studies (described in more detail below).
A negative result—defined for this study as a result of the meta-analysis when the 95% CI for the effect included 1.00 (consistent with a p value ≥0.05).
Study selection
On first screening, we selected negative meta-analyses that had sufficient power using parameter estimates informed by the Cochrane systematic review. We used a two-sided trial sequential monitoring boundary type. We calculated the event proportion in the control group as an unweighted mean of the proportion with the outcome in the control groups of all the included trials. We then calculated the RIS and the monitoring boundaries for a relative risk reduction (RRR) of:
10% RRR, or
RRR equivalent to a number-needed-to treat (NNT) of 100 participants (using the above definition of event proportion in the control group).
Type 1 error: 5%.
Power: 80%.
Heterogeneity adjustment: using the inconsistency (I2) quoted in the Cochrane analysis.
When a systematic review contained more than one meta-analysis fulfilling the above criteria, we selected the first eligible meta-analysis presented in the ‘Data and analysis’ section (thus prioritising the ‘most primary outcome’ meta-analyses for inclusion). Starting with the most recent published Cochrane review, we selected the first 50 meta-analyses that reached the RIS able to refute a RRR of 10% and the first 50 meta-analyses that reached the RIS able to refute a NNT of 100 participants.
Trial sequential analysis
TSA is a methodology that combines conventional meta-analysis techniques with monitoring boundaries that create thresholds for declaring significance. A RIS is estimated,17 ,23 using a control event proportion, a specified intervention effect, chosen risks of type 1 and type 2 errors, and an estimation of heterogeneity.23 Thresholds are then constructed for statistical significance using an α-spending function, known from interim-analyses of single trials,6 varying the threshold for statistical significance such that it is more conservative when the data are sparse and becomes progressively more lenient as the accrued information gets closer to the RIS.6
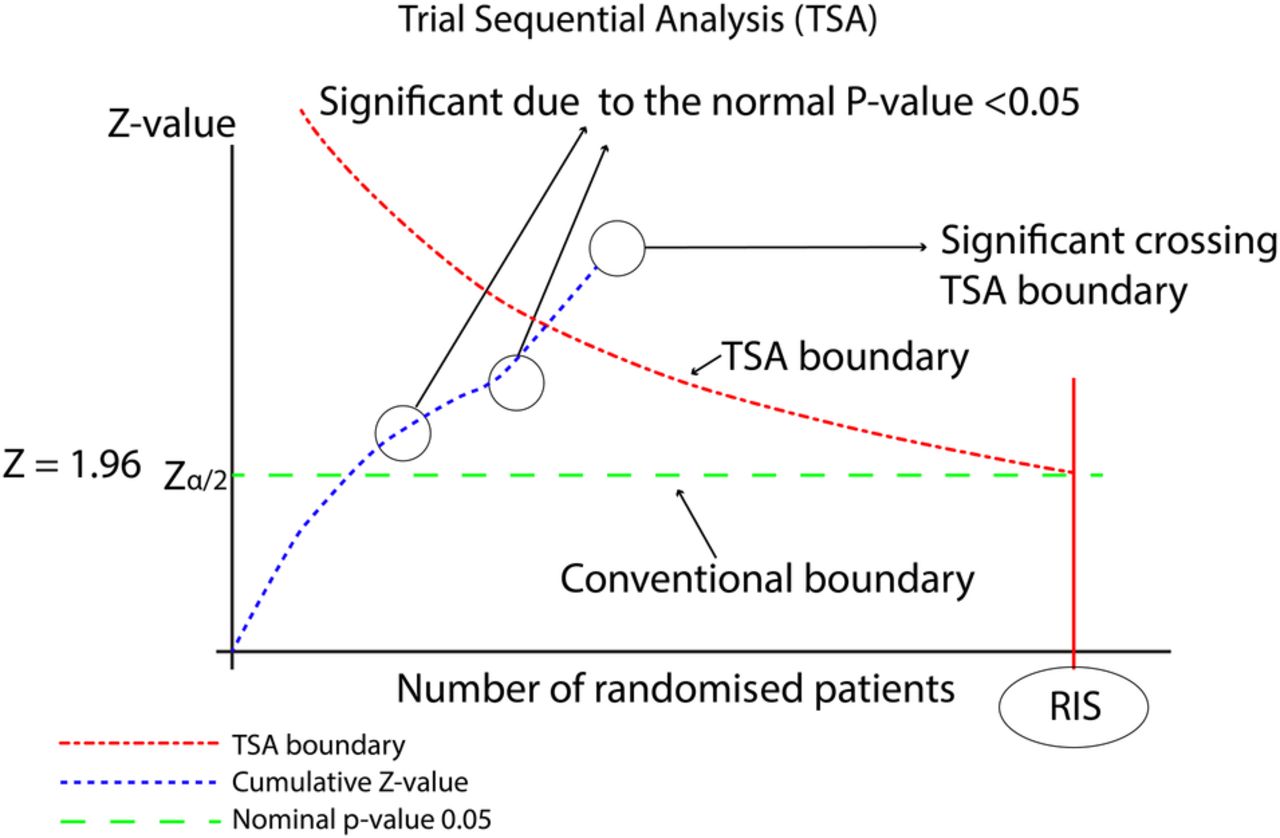
Figure 1 demonstrates one side of a TSA, the one dealing with potential superiority of the experimental intervention. The accumulating number of patients and RIS are shown on the x-axis. The Z values are shown on the y-axis. The Z values represent a statistical summary of the findings of the data and can be used to calculate CIs and p value. The Z values calculated from the accumulating data are plotted and compared with thresholds for significance. These thresholds can be translated into TSA-adjusted CIs allowing estimation of random error.23

Demonstration of TSA. RIS, required information size; TSA, trial sequential analyses.
We used the individual trial data for each selected meta-analysis to calculate an RIS21 using diversity (D2) to estimate heterogeneity.25 We selected for inclusion meta-analyses that had surpassed either the RIS or an associated futility boundary.
The cumulative meta-analyses
We used the TSA software to re-conduct each selected Cochrane meta-analysis.21 We used relative risk as the effect measure and the DerSimonian and Laird random-effects model.26 We constructed two-sided conventional naïve monitoring boundaries for a type 1 error of 5%. The boundaries are two straight lines, with a constant Z value of ±1.96, consistent with a p value of 0.05 and a 95% CI, reflecting the conventional threshold of statistical significance. See figure 1 for a visual demonstration of these thresholds. We added each trial to the cumulative meta-analysis according to the year it was published. If more than one trial was published in the same year, we added the trials according to alphabetical order of the last name of the first author. This approach allowed us to visualise how the cumulative meta-analysis would have evolved had it been updated after every new trial.
If a cumulative meta-analysis Z value crossed the conventional boundary for significance before reaching the RIS, we classified this crossing as a ‘false positive’. This classification was based on our knowledge that the full meta-analysis was negative, that is, that it showed a lack of a 10% RRR. Had a conventional meta-analysis been performed at the time of the false-positive result, the underpowered meta-analysis would have produced a summary measure with a 95% CI excluding no effect. A 95% confidence interval excluding no effect (RR=1.00) is often interpreted as a convincing demonstration of benefit. Using the information at the end of the cumulative meta-analysis, showing a negative effect, it is therefore reasonable to define such an earlier interim result as a ‘false positive’.
For trials with zero events in either or both treatments groups, we conducted the analyses using several continuity adjustments techniques (constant, reciprocal and empirical), varying the value added to each cell (from 0.005 to 0.5) and varying whether or not trials with zero events in both groups were included. We only classified a finding as a false positive if the result remained a false positive for all permutations of continuity adjustment technique and quantity.27
Cumulative sequential analyses
For the cumulative meta-analyses with false-positive findings, we assessed whether TSA conducted at the equivalent time would have identified these findings as false. This procedure mimicked how prospective cumulative meta-analyses could have been performed using TSA had they been conducted at the time of publication of each new trial. We did the analyses using three different TSA approaches. For all approaches, we used the same meta-analytic model that we used for the conventional meta-analysis, using relative risk as the effect measure, the DerSimonian-Laird random effects model, and included all permutations for zero event handling.
To construct the first TSA approach, we used the parameters that we had used for selection: the proportion of events in the control group as an unweighted mean of the proportion of events in the control groups of all the included trials in the final meta-analysis, the criterion used for inclusion (RRR 10% or for the NNT to be 100 participants) as the estimate of effect, and the D2 present in the final meta-analysis.28 With this approach, our goal was to represent a ‘credible parameters TSA approach’. We considered the parameter estimates that actually did exist in the final cumulative meta-analysis as a reasonable mimic of credible and reasonable choices for the clinical question at the time of the false positive.
For the second and third TSA approaches, we used parameter estimates from the trials included when the false positive occurred and the D2 estimated from the trials included up until that point. We used an unweighted mean of the proportion of events in the control groups at that time as the estimate of the proportion of events in the control group. For the second approach, we used the RRR consistent with the conventional 95% confidence limit closest to null at the time of the false positive as the parameter estimate of effect. For the third approach, we used the point estimate at the time of the false positive as the parameter estimate of effect. These approaches represented ‘existing data TSA approaches’, where parameter estimates for the TSA approach are chosen from the trials that have been included up until that point in time.
Calculation of the proportion of false-positive findings
We calculated the proportion of included meta-analyses that produced one or more false positives using a conventional statistical significance level. We assessed how many of these false positives, during the data/trial accumulation, would have been controlled using the three TSA approaches.
Assessment of the association between a significant conclusion in Cochrane meta-analyses and the probability of that meta-analysis being updated
We performed a post hoc investigation to explore whether our selected population of systematic reviews were typical of all Cochrane systematic reviews. In particular, we investigated whether a Cochrane meta-analysis with a non-significant summary measure is associated with an increased probability of that meta-analysis being updated, and whether, as a consequence, our selected population of systematic reviews represent, by virtue of them being very large and therefore likely to have been updated, a population of reviews that are more likely to have had non-significant results in the past. That is, we hypothesised that early meta-analyses with statistically significant results that may be false positives, are less likely to be updated, and hence less likely to be included in the population we selected.
For the post hoc analysis, we searched The Cochrane Database of Systematic Reviews for the years 2007, 2006, and 2005.24 We chose 2007 as a starting year as we felt that this gave a reasonable time period to allow for an update to take place, and we included 3 years in order to get a reasonably sized population to explore our post hoc hypothesis. We selected the first meta-analysis presented in the Data and Analysis section of the review and recorded whether it was statistically significant or not. We then checked all subsequent versions of that review until the end of December 2013 and recorded whether that meta-analysis had been updated. We calculated the relative risk of a meta-analysis being updated if its summary measure had a CI including 1.00, implying no statistical significance, relative to if it did not include 1.00, implying statistical significance.
Results
Selection of meta-analyses for inclusion based on a RRR of 10%
We screened 2846 Cochrane systematic reviews in order to identify 50 that had a meta-analysis that fulfilled our criteria for being negative and sufficiently powered for a RRR of 10%. This search was conducted in October 2013 and extended back to April 2009. Only 1.8% (95% CI 1.3% to 2.3%) of the reviews screened were eligible.
Selection of meta-analyses for inclusion based on a NNT of 100 participants
We screened 1890 Cochrane systematic reviews in order to identify 50 that had meta-analyses that fulfilled our criteria for being negative and sufficiently powered for a NNT of 100 participants. This search was conducted in October 2013 and extended back to February 2012. Only 2.6% (95% CI 2.0% to 3.5%) of the reviews screened were eligible.
Characteristics of the selected meta-analyses
Online supplementary appendix 1 and appendix 2 show summaries of the meta-analyses that were selected using each criterion.
supplementary appendix
supplementary appendix
Cumulative meta-analyses
When using the constant conventional naïve statistical thresholds, false positives were present in 7 of the 100 meta-analyses (7%, 95% CI 3% to 14%). In one meta-analysis,29 false positives occurred six times. In two meta-analyses,30 ,31 false positives occurred twice. In total, we identified 14 false positive meta-analytic results. In the RRR 10% group, one or more false positives were present in 5 of the 50 meta-analyses (10%, 95% CI 4% to 23%). In the NNT 100 participants group, one or more false positives were present in 2 of the 50 meta-analyses (4%, 95% CI 1% to 15%). Table 1 describes the meta-analyses that produced the false positives.
Characteristics of the meta-analyses that produced early false positives in conventional meta-analyses
Cumulative sequential meta-analyses
Of the 14 times that the conventional thresholds were crossed, at least one of the TSA approaches prevented the false positive 13/14 times (93%, 95% CI 68% to 98%). Table 2 summarises the results of the TSAs for the meta-analyses that produced early false positive meta-analyses. The three TSA approaches are described in table 2, with the RRR used for the estimate of effect for each TSA approach, and whether the TSA approach controlled the type 1 error. With TSA approach 1, the credible variable TSA approach, 13/14 (93%) false positives were prevented. With TSA approach 2, the existing data TSA approach using the conventional 95% confidence limit closest to the null, 12/14 (86%) false positives were prevented. With TSA approach 3, existing data TSA approach using the point estimate of the intervention effect of the meta-analysis, 11/14 (79%) false positives were prevented.
Summary of the results of the three TSA approaches for the meta-analyses with early false-positive results
The association between an unadjusted CI including one and the probability of further updates
The search of the Cochrane database for all systematic reviews published between 2005 and 2007 produced 488 systematic reviews. A total of 187 of these reviews contained at least one meta-analysis. Selecting the first meta-analysis presented in the Data and Analyses section, 94/187 had a 95% CI including 1.00 (50%, 95% CI 43% to 58%) and 93/187 had a 95% CI not including 1.00 (50%, 95% CI 42% to 57%). Twenty-seven of 94 (29%, 95% CI 20% to 39%) of the non-significant meta-analyses compared with 16/93 (17%, 95% CI 11% to 28%) of the significant meta-analyses were subsequently updated before December 2013. Therefore, a Cochrane systematic review published in the years 2005–2007 was 1.67 times more likely to be updated (95% CI 0.92 to 2.68) when the 95% CI of the summary measure included 1.00 compared with when it did not.
Discussion
Type 1 errors, due to random errors, systematic errors and fraud, are common in underpowered meta-analyses.21 TSA is a methodology that intends to control the risk of random error. In this study, we aimed to explore how TSA could help improve the reliability of conclusions in real-life Cochrane meta-analyses. We identified a population of Cochrane meta-analyses of binary outcomes that had a conclusion that the assessed intervention had no effect on a binary outcome and fulfilled our definition of having sufficient power. We re-conducted conventional cumulative meta-analyses on this population of meta-analyses to identify how many false positives would have occurred had they been updated after each new trial was published. Seven per cent (95% CI 3% to 14%) of the meta-analyses produced at least one false positive and we identified a total of 14 false positives meta-analytic results of binary outcomes in these seven reviews. We conducted TSA on these meta-analyses with false-positive findings. We found that using approach one (the credible or plausible approach) or all of the TSA approaches prevented the false positive in 93% (95% CI 68% to 98%) of the cases.
Limitations
As with all investigations of methodology in real-life situations, there were notable limitations in this study. Our primary concern is the nature of the population of meta-analyses that we included. We wanted to find a population of Cochrane systematic review meta-analyses for which there was adequate power to answer the clinical question and where the final conclusion was one of negligible clinical effect. We selected meta-analyses that fulfilled an RIS for a defined set of parameter estimates. We found that such meta-analyses are very rare in Cochrane systematic reviews. Using the RRR of 10% as the anticipated parameter estimate for effect size, only 1.8% (95% CI 1.3% to 2.3%) were sufficiently powered. Using NNT of 100, the proportion was 2.6% (95% CI 2.0 to 3.5%). It is a striking finding of this study that published Cochrane systematic reviews with sufficient power and a negative result are so rare.
The rarity of these meta-analyses caused us to question whether the population that we selected were typical of an average Cochrane meta-analysis. There are many potential factors that may make this rare population of meta-analyses atypical. In particular, we hypothesised that a summary measure with a CI not including 1.00, implying statistical significance, reduced the probability of subsequent updating and that our selected population therefore represented meta-analyses that were less likely to have had statistically significant results early on. If this hypothesis were true, then any false positives present in early Cochrane meta-analyses would be less likely to reach a reasonable diversity-adjusted RIS and less likely to be included in our study. To test our hypothesis, we reviewed all the Cochrane systematic reviews from 2005, 2006 and 2007 and found that meta-analyses with CIs including 1.00 are 1.67 times more likely to be updated (95% CI 0.92 to 2.68). While this observation did not reach statistical significance, it does not contradict our hypothesis and therefore suggest that the proportion of underpowered Cochrane meta-analyses with false positives may be higher than what we observed in this study because early false positive meta-analyses have a much lower chance of eventually reaching the RIS.
The definition of what constitutes a negative study and sufficient power are further limitations in this study. We deliberately set out clear definitions for these eligibility criteria in order to create an objective template with which to try to assess the issue of random type 1 error. However, it is impossible to truly generalise both about what constitutes a negative study and what constitutes sufficient power. Each meta-analysis, and its associated clinical question, has its own factors that need to be considered. Moreover, for each of these factors, subjective judgement can also play a part. We needed to select generalised definitions so that we could conduct the study and try to answer our hypothesis. We chose parameters for the definition that we felt were reasonable for an ‘average’ meta-analysis and its associated clinical question.
Similar challenges exist for the choice of parameters to construct monitoring boundaries when performing TSA, with similar philosophical barriers to creating any single, correct model. TSA monitoring boundaries are constructed based on a calculated RIS for a given clinical question, with the boundary becoming more lenient the closer the meta-analysis is to the RIS. As with sample size calculations, the RIS depends on an effect size estimate, the proportion in the control group with the outcome, type 1 error and type 2 error. RIS also incorporates an estimate of heterogeneity. The boundaries hold true for the value of the parameters that are used. In our study, we used three different approaches to estimate the effect size, in an attempt to explore and demonstrate the non-linearity of this modelling. Our rationale was that a TSA exploration at any point should consider variations in these parameters. Our inclusion of these three approaches demonstrates the inherent variability in hypothesis testing in frequentist statistics and the resulting limitation to making definitive conclusions about the risks of type 1 error.
A further limitation was that we did not incorporate an assessment of risk of systematic error (bias) in the selection process. Therefore, the results of the TSA analyses could be regarded as assessing the risk of random error under the assumption that all included trials had low risk of bias and no fraud. The omission of a full bias assessment represents a major limitation in our investigation. In order to define an early crossing of a conventional threshold as a false positive, logic holds that the final conclusion must be that the intervention has no effect. If there were trials included in the final meta-analysis which had inflated effect estimates due to bias (which there undoubtedly were), this classification, of these meta-analyses as being ones where the question was reasonably answered, is not valid. Unfortunately, if we had undertaken a formal assessment of risk of bias, given the rarity of the meta-analyses we sought, it is unlikely that we would have found sufficient meta-analyses to conduct any investigation. Consequently, at this stage, we selected existing meta-analysis as described and concede this currently unavoidable limitation of the potential effect of systematic error.
The issue of systematic error is also worthy of note with regard to our evaluation of the early false positives. We used TSA in order to assess the risk of random error, isolating our examination in order to focus on this component. In real life, however, all sources of error would contribute to the consideration of a finding of statistical significance early in a meta-analysis and an assessment of risk of systematic error is paramount. For example, in Moberley et al,32 a false positive was produced after the first trial and none of the three TSA boundaries prevented this false positive. Consideration of systematic error reveals that this first trial was assessed by the Cochrane authors as being at high risk of bias.32 This assessment would have led to uncertainty in the reliability of this conclusion independent of the risk of random error. Assessment of bias is an important part of assessing any statistically significant result in a meta-analysis and needs to accompany any assessment of risk of random error, especially if random error seems controlled. For example, in our present study, where TSA approaches prevented the vast majority of false positive findings, a stringent bias assessment would have prevented those where the TSA-adjusted CI failed to do so.
Conclusions
A growing body of evidence shows that statistically significant results in early meta-analyses have high proportions of type I errors.2 ,3 ,10 ,11 ,13 ,14 ,16 ,17 In our present study, we found false positives in 7% (95% CI 3% to 14%) of a population of sufficiently powered and negative Cochrane meta-analyses assessing a binary outcome. Owing to the rarity of these meta-analyses and the decreased likelihood of updating positive meta-analyses, it is likely that the true proportion of false positive is higher than 7%. TSA prevented the false positives 93% of the time (95% CI 68% to 98%) and TSA using credible (or plausible) parameters seems preferable.
References
Footnotes
Contributors GI conducted the study, wrote the first draft of the manuscript. GI and JW carried out data analysis. KT, CG and JW contributed to the writing of the manuscript.
Funding This research received no specific grant from any funding agency in the public, commercial or not-for-profits sectors.
Competing interests KT, CG and JW developed the TSA methodology. All authors were involved in the production of the TSA Manual.21
Provenance and peer review Not commissioned; externally peer reviewed.
Data sharing statement All of the data used in this research is provided within this publication, its appendices, and the publications referenced in the online supplementary appendices.