Article Text

Abstract
Objectives Several studies identified a heterogeneous impact of heat on mortality in hot and cool regions during a fixed period, whereas less evidence is available for changes in risk over time due to climate change in these regions. We compared changes in risk during periods without (1996–2000) and with (2008–2012) heatwave warning forecasts in regions of South Korea with different climates.
Methods Study areas were categorised into 3 clusters based on the spatial clustering of cooling degree days in the period 1993–2012: hottest cluster (cluster H), moderate cluster (cluster M) and cool cluster (cluster C). The risk was estimated according to increases in the daily all-cause, cardiovascular and respiratory mortality per 1°C change in daily temperature above the threshold, using a generalised additive model.
Results The risk of all types of mortality increased in cluster H in 2008–2012, compared with 1996–2000, whereas the risks in all-combined regions and cooler clusters decreased. Temporal increases in mortality risk were larger for some vulnerable subgroups, including younger adults (<75 years), those with a lower education and blue-collar workers, in cluster H as well as all-combined regions. Different patterns of risk change among clusters might be attributable to large increases in heatwave frequency or duration during study periods and the degree of urbanisation in cluster H.
Conclusions People living in hotter regions or with a lower socioeconomic status are at higher risk following an increasing trend of heat-related mortality risks. Continuous efforts are needed to understand factors which affect changes in heat-related mortality risks.
- EPIDEMIOLOGY
- PUBLIC HEALTH
- OCCUPATIONAL & INDUSTRIAL MEDICINE
This is an Open Access article distributed in accordance with the Creative Commons Attribution Non Commercial (CC BY-NC 4.0) license, which permits others to distribute, remix, adapt, build upon this work non-commercially, and license their derivative works on different terms, provided the original work is properly cited and the use is non-commercial. See: http://creativecommons.org/licenses/by-nc/4.0/
Statistics from Altmetric.com
Strengths and limitations of this study
We examined the impact of heat on mortality using data which cover the whole country.
Target study regions were defined by statistically meaningful differences in climate characteristics using spatial statistics.
We compared heat-related mortality between before and after introduction of the heatwave early warning system.
We examined patterns of temporal changes in heat-related mortality risks among regions with different climate characteristics and found that risk changes are affected by regional climate.
Adjustment for air pollutants was available for limited periods but this did not affect the accuracy of risk estimation.
Introduction
An increase in environmental temperature is significantly related to daily excess mortality. Many studies have found that high temperatures are associated with all-cause mortality, as well as mortality caused by non-communicable diseases such as cardiovascular and respiratory diseases.1 The Intergovernmental Panel on Climate Change (IPCC) reported that climate change will most likely lead to further increases in air temperature and the intensity of heatwave events.2 ,3 This could increase the heat-related mortality risk in future. Scientists anticipate that future risks will be greater in populations identified as more vulnerable to heat-related health damage through epidemiological studies, including elderly individuals with impaired physiological ability and people with underlying chronic diseases or a low socioeconomic status.1 ,4 ,5
The heat–mortality relationship varies among populations according to climate and geographical region.6 The ‘threshold temperature’, at which the mortality risk begins to increase, is typically higher in regions where hot weather is more common in the continental USA (eg, southern latitudes in the USA).7 The threshold and risk of heat-related mortality also vary significantly even among cities within a smaller country because of differences in the intensity of summer heat; cities with hotter climates tended to have higher thresholds and lower risks, with considerably wide variance in risk noted among cities.8–13 These findings suggest that populations experiencing higher heat exposure are better able to cope with heat stress.14 ,15 However, studies usually focused on comparisons of the heat-related mortality risk during a short-term period among regions with different climates, except one study13 that considered temporal changes in risk over time; as a result, far less information is available about future trends in the differences in risk according to climate.
In this sense, the present study aimed to compare changes in heat-related mortality risks over time among South Korean regions with different climate characteristics in the summer. The significant impact of heat on mortality in major cities has been demonstrated in many Korean studies.16–18 One study examined temporal changes in the effect of heat over time, albeit for one city.18 This study categorised study areas across the entire country into three clusters based on the degree of heat, using cooling degree days (CDD), a concept that was adopted in a previous study to classify summer temperature in the USA.19 Temporal changes in heat-related mortality risk were assessed during periods with (2008–2012) and without (1996–2000) a national heatwave early warning system for each cluster. The Korea Meteorological Administration (KMA) has announced heatwave early forecast during summer (June to September) since 2008. Once a heatwave is forecast, a series of actions is implemented to prevent negative heat-related health outcomes including activating an emergency text message service, opening shade shelters and monitoring the occurrence of heat-related illness. Heat-related mortality risk was estimated in terms of increases in the daily all-cause, cardiovascular and respiratory mortality by change in the daily temperature. The analysis was further stratified by age group, education level and job status. South Korea has experienced rapid climate change, as evidenced by the more rapid and greater temperature increases in this country relative to global trends throughout the past two decades.20 Therefore, a comparison of patterns in risk change during these recent decades will provide insight into climate-modified changes in risk over time. We expect that the results of this study will provide basic information that will help to identify populations vulnerable to heat effect and public health policy decision-making to combat heat-related health damage.
Materials and methods
Study area
South Korea, a country in East Asia, is located at middle latitude (37° North and 127.30° East) in a temperate climate zone. South Korea has four distinctive seasons with the coolest weather in the winter (December to February) and the hottest weather in summer (June to September). Temperature is highest in July and August. All equivalent administrative units, including cities, counties and boroughs, in South Korea were considered. To analyse temporal changes in the heat–mortality relationship, we sought study periods of equal duration and with similar annual nationwide temperature trends and two subperiods were selected: 1996–2000 and 2008–2012. This was because years with relatively lower temperature ranges between 2001 and 2007 (as much as 10% lower than that in other years) could affect accurate estimation of the effect of temperature when the same threshold was applied to the study periods for an equal analytic environment.
Data
Mortality data, coded by age, sex, address, job status, educational level and cause of death (according to the International Classification of Disease, Injuries and Causes of Death, 10th version (ICD-10)), from 1996 to 2012 were collected from the Korean National Statistical Office. Total deaths, except for deaths caused by accidents (V00–Y99), were used to calculate daily all-cause mortality. Cardiovascular (I00–I99) and respiratory diseases (J00–J99) were defined as target diseases. The daily number of overall deaths, stratified by age group (<20, 20–74 and ≥75 years), was examined. The incidences of cardiovascular and respiratory disease in the <20 years group were not used for risk estimation, as the incidence was too small. Population data at the yearly midpoint were obtained from the Korean National Statistical Office. White-collar and blue-collar workers were defined on the basis of the Korea Standard Classification for Occupations used in national mortality data to identify people who were most likely outdoor workers. Among standard job classes, white-collar workers comprised people employed in management, office, scientific and service occupations. People involved in agriculture, crafts and related activities, machine manipulation, and simple manual labour were defined as blue-collar workers.
Temperature, humidity, precipitation and barometric pressure data, recorded every 3 hours, were obtained from meteorological stations affiliated with the KMA. Using these data, we calculated the daily mean and maximum temperatures, mean humidity and mean barometric pressure. To evaluate the temperature conditions during the summer, the study considered the occurrence of heatwave events.
Features of heatwave were measured to identify the impact of regional climate on the degree of heat. A heatwave was defined according to the criteria of the KMA which operates the heatwave early warning system; days with a daily maximum temperature >33°C for more than 2 days were defined as days with a heatwave. Heatwave duration was calculated as the number of consecutive days of heatwave. Heatwave frequency was the calculated number of occurrences of heatwaves during summer. Heatwave intensity refers to the cumulative sum of differences between the daily maximum temperature and the threshold temperature for defining heatwaves (33°C) during heatwaves.
To control for the effect of air pollutants, we obtained data for the 24-hour average concentrations of particles smaller than 10 µm (PM10) and ozone (O3) from the National Institute of Environmental Research, Republic of Korea.
Classification of heat clusters
We used CDD to classify regions into several clusters with dissimilar climate conditions in the summer. A CDD is the cumulative difference between the daily mean outdoor temperature and standard temperature (24°C) in a year, and indicates the energy needed for cooling.21 The annual CDD values of each region were calculated for the summers of 1993–2012, and regions were subsequently divided into three heat clusters based on the scores and Getis-Ord local statistics (Gi*) p values of CDD. Given the coordinates for these regions, a hotspot analysis identified spatial clusters with high or low variable values.
Gi* was calculated as 1where xj was the value of a variable for region j,
  was an average of the variable of each region, wi,j was the spatial weight between region i, j and n were the total numbers of regions.22 S was calculated as:
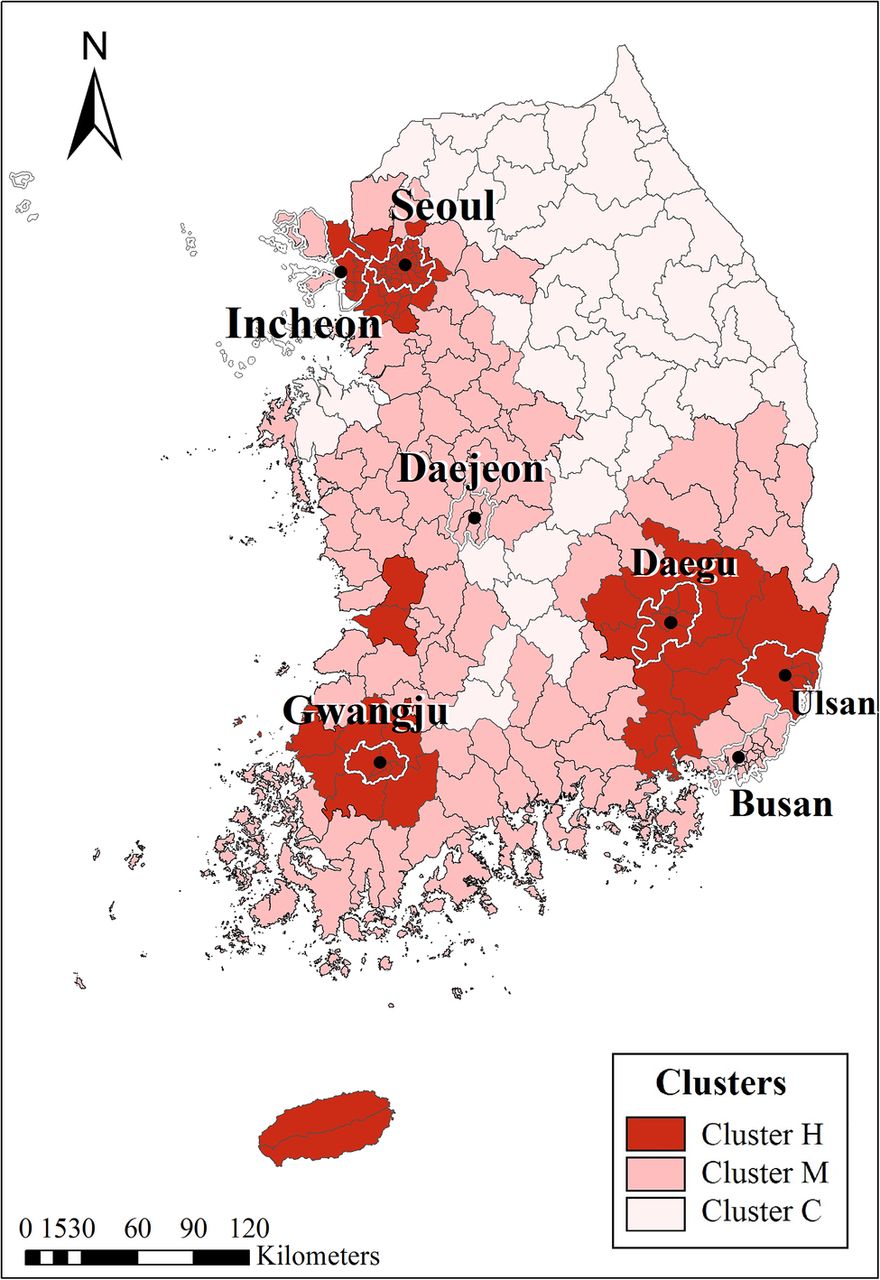
  2A high positive Gi* value (ie, far from zero) indicated a spatial clusters with high variable values. For negative Gi*, a smaller score indicated a more intense clustering of low variable values.23 Regions with a Gi*<−1.65 and those with a Gi*>1.65 were classified as cold and hot spots, respectively, within a 90% confidence level (CI). The regions with Gi* values within those extremes were considered evenly distributed regions. The study regions were divided into cluster H (hot spots with significantly high CDD values), cluster M (regions with no significantly high or low values) and cluster C (cold spots with significantly low values; figure 1). ArcMap software V.10.2 (ESRI, Redlands, California, USA; http://www.esri.com/) was used to conduct the Hotspot analysis.

Three study clusters in South Korea. *Clusters H, M and C represent the hottest, moderate and coolest clusters, respectively. The capital and metropolitan cities are outlined in white boundaries. CDD, cooling degree days.
Descriptive statistics for meteorological indices of the clusters were estimated. The annual mean of heatwave frequency, duration and intensity was calculated for each of the study regions, which constitutes a study cluster, and the differences among the clusters were tested by Kruskal-Wallis test. The differences of annual mean of maximum temperature, mean temperature and CDD among clusters were tested by one-way analysis of variance.
Identification of a threshold using piecewise analysis
Piecewise regression analysis was used to identify the threshold temperature.24 Piecewise regression analysis identifies an inflection point in the relationship curve between the daily maximum temperature and corresponding mortality. Piecewise regression allows multiple linear models for different ranges of the independent variable. Two separate line segments were fitted for the daily maximum temperature and corresponding daily average death counts by applying a breakpoint in a model. We iteratively modelled two linear lines at multiple points through the temperature range in intervals of 0.5. The threshold was determined as the breakpoint of the best fit model based on the value of the R2 statistics. The analysis was conducted separately for all-cause, cardiovascular, and respiratory mortality and mortalities in subgroups (sex, age, education level and job status) in each heat cluster.
Estimation of the temperature–mortality relationship
GAM with a link function and a Poisson distribution was used to construct the association between daily mortality and temperature. The daily maximum temperature was used as the main independent variable. Temperatures of the current day (lag 0), previous single day (lag 1, 2 and 3) and average of 4–7 days were applied to the mode. Potential confounders, such as calendar year, month, holidays (including national holidays and weekends), humidity, pressure and concentrations of PM10 and O3 were controlled. Population was used to adjust for temporal population trends. The results are expressed as relative risks (RRs), which represent the increase in death counts with each 1°C increase in temperature above the threshold. We reported the greater estimates of temperature variables among lag days as a result.
The effect of temperature was estimated for subgroup of cause, age, sex, education level and job status. When examining age-specific risks, we compared the risk between the age groups of 20–49 and 50–74 years and the risk estimates were not particularly different between these two groups. Thus, we estimated and report temperature effect in young adults grouped into a single group (20–74 years).
GAMs are generally built for each separate subgroup of an effect modifiers (eg, sex, age) to accurately consider the population at risk, so most studies typically assessed modifying effects based on subanalyses. Similarly, two study periods in this study were compared from stratified analyses. To verify the descriptive comparison of stratified analysis, two-stage analysis was applied: year-specific GAMs followed by a metaregression analysis. We estimated the temperature–mortality relationship from year to year for each cluster allowing respective thresholds for each year from 1996 to 2012. A metaregression (mixed-effect model) was fitted for year-specific risks with year variable as a linear metaregressor to estimate trends over time. GAMs were conducted using SAS statistical software, V.9.3 (SAS Institute, Cary, North Carolina, USA; http://www.sas.com) and R ‘metafor’ package was used for the metaregression analysis.
Results
The mortality patterns and meteorological conditions in the three clusters during the periods of 1996–2000 and 2008–2012 are presented in table 1. The proportion of all-cause mortality among the elderly (age ≥75 years) increased in all clusters during the later period due to an ageing phenomenon. The population density in cluster H was prominently high (8235/km2 in 1996–2000 and 8291/km2 in 2008–2012), as this cluster included the capital and metropolitan cities within a relatively small area. Cluster C had the lowest population density (1743/km2 in 1996–2000 and 1833/km2 in 2008–2012). The numbers of all-cause and cardiovascular-related deaths in cluster H in 1996–2000 and 2008–2012 (154 373 and 170 112, respectively) were ∼1.2-fold greater than those in cluster M (134 623 and 140 549, respectively) and ∼4-fold greater than those in cluster C (37 109 and 34 812, respectively). The percentage of elderly deaths among all-cause deaths was highest in cluster C (44.2–55.4%).
Mortality patterns and climate conditions in clusters during the study periods
The daily maximum and mean temperatures increased slightly (∼0.3–0.6°C) across all clusters (table 1). Temperature variations did not differ significantly among the clusters. The maximum temperatures were 27.5–27.9°C in cluster H, 26.9–27.2°C in cluster M and 26.5–26.8°C in cluster C. The lowest mean temperature was recorded for cluster C in 1996–2000 (21.9°C), and the highest value was recorded for cluster H in 2008–2012 (24.3°C). Meanwhile, the number of CDD in cluster H was approximately twofold greater than those in clusters M and C. The frequency, duration and intensity of heatwaves in cluster H were greater than those in clusters M and C; this difference was particularly large with respect to duration and intensity, which were approximately twofold greater in cluster H than in clusters M and C. The results illustrate that cluster H experienced more severe heat stress in summer, compared with other regions.
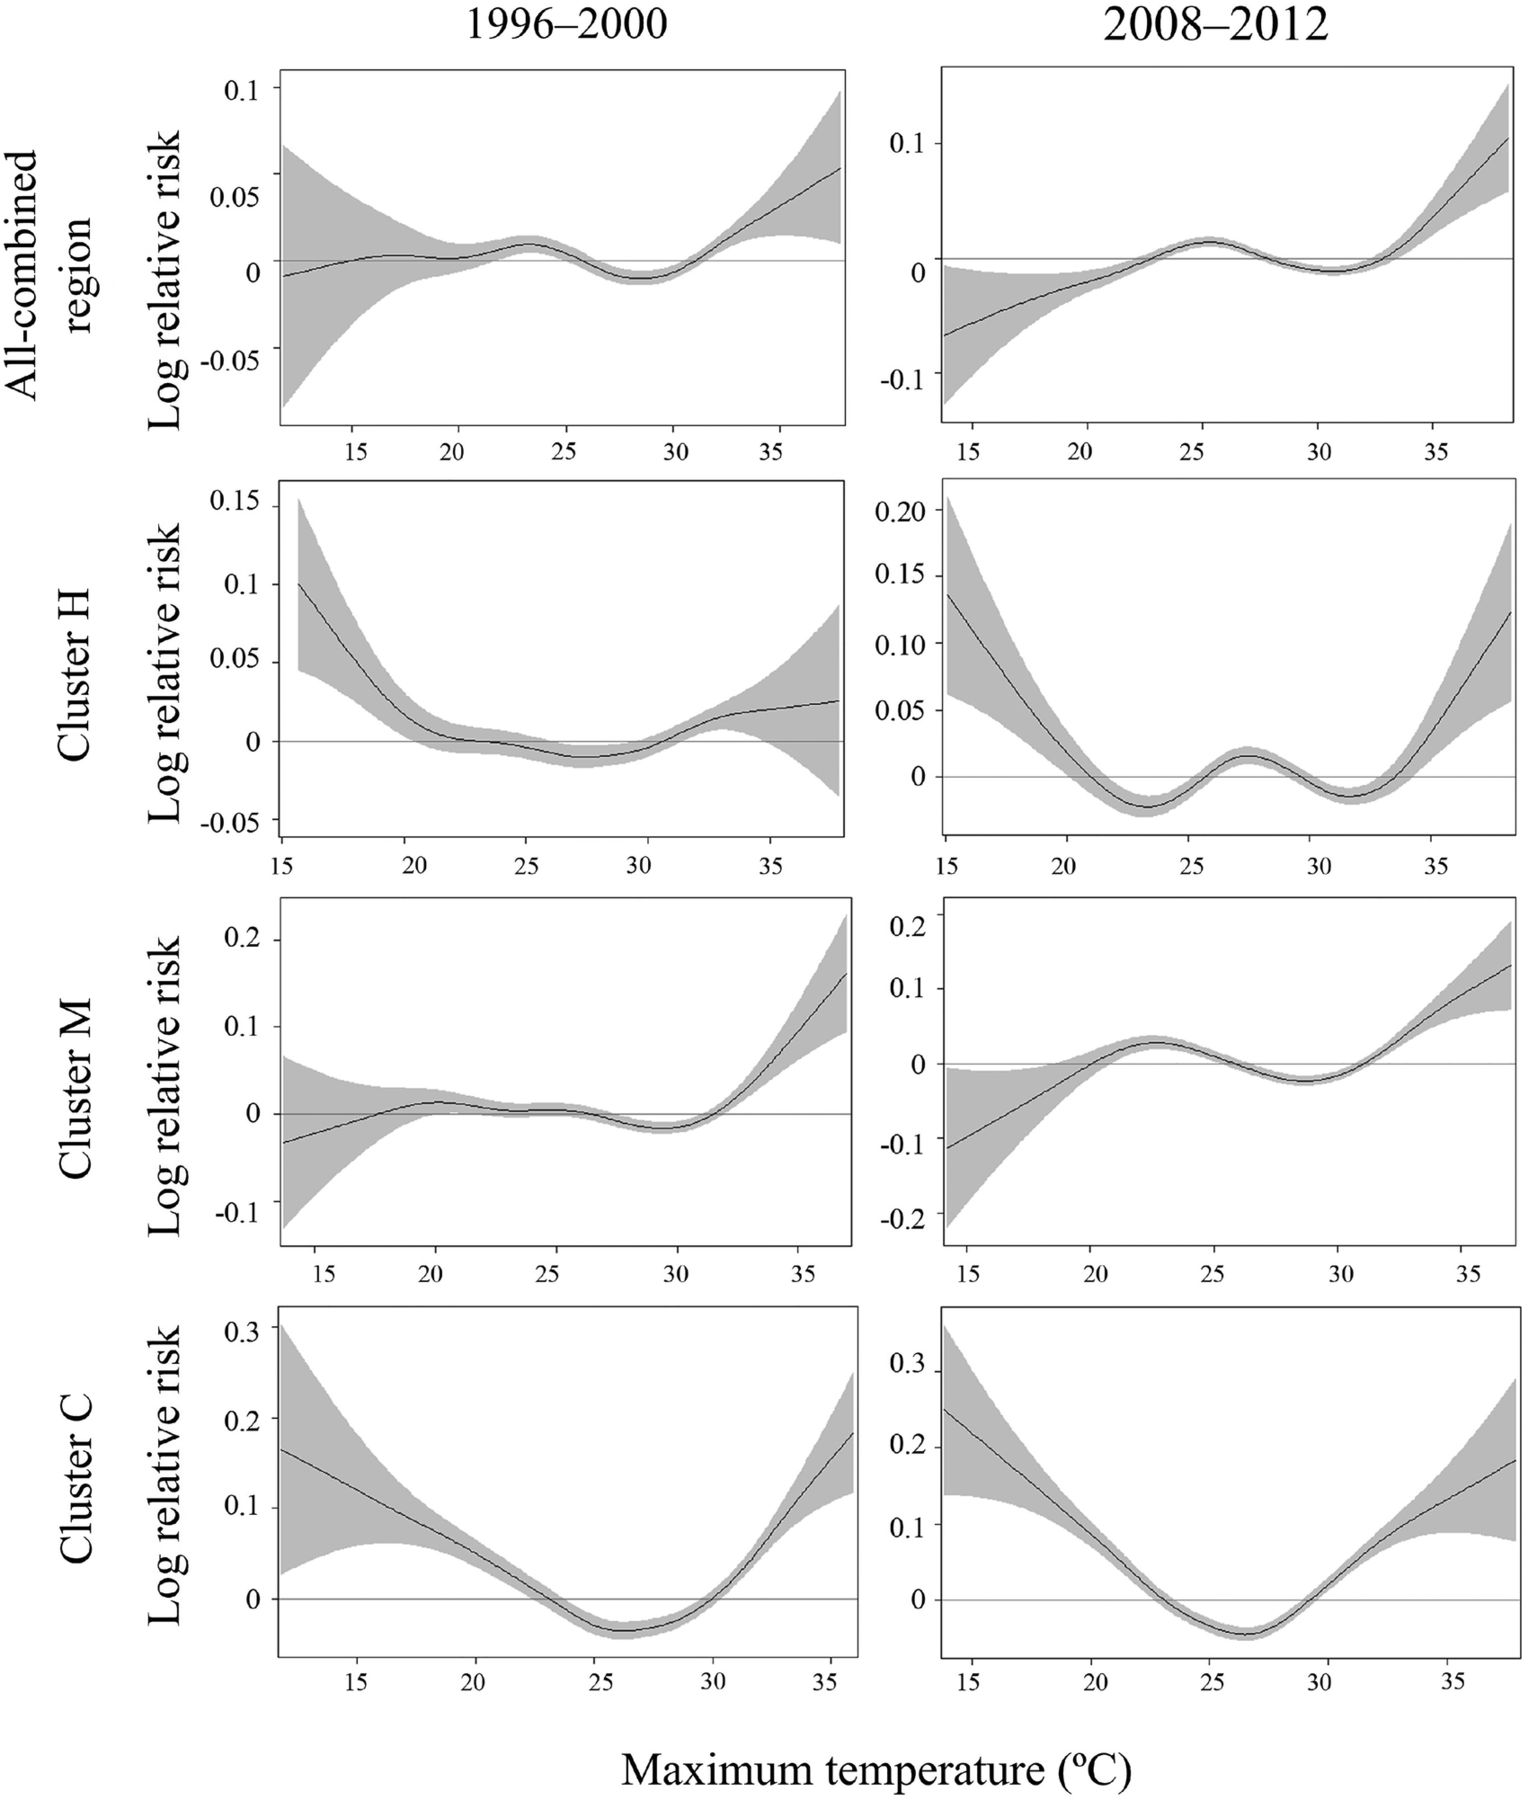
The relationship curves between maximum temperature and all-cause mortality, obtained from the GAM spline, revealed different patterns among clusters (figure 2). In clusters M and C, the slope of the curve decreased slightly in 2008–2012, compared with 1996–2000. However, the slope of cluster H was steeper in 2008–2012 than in 1996–2000. The plots for cluster H indicated the highest threshold, whereas those for cluster C indicated the lowest threshold.

Curves of the relationship between all-cause mortality and maximum temperature in all-combined regions and study clusters in each study period (1996–2000 and 2008–2012). *Clusters H, M and C indicate the hottest, moderate and coolest clusters, respectively.
The thresholds for all-cause mortality, estimated by piecewise regression analysis, were 33.5°C, 32.5°C and 30.5°C for clusters H, M and C, respectively (table 2). Thresholds for other diseases were also highest in cluster H. For cardiovascular mortality, the thresholds were 33.5°C, 30.5°C and 30.5°C in clusters H, M and C, respectively. For respiratory mortality, thresholds of 31.5°C, 31.5°C and 29.5°C were identified for clusters H, M and C, respectively.
Relative risks in cause-specific mortality for an increase of 1°C of maximum temperature above the threshold in the study clusters during both study periods, stratified by age group
The age-specific relative mortality risks associated with a 1°C increase in temperature above the threshold for all-combined regions and each cluster are presented in table 2. The represented risks were mainly observed on lag 0 day, whereas the lag effects on lag days 1–7 were controlled. In cluster H, a pattern of increasing all-cause mortality risk was observed over time in the all ages group, whereas no increasing trends were observed in clusters M and C or all-combined regions. In cluster H, the risk for the all ages group increased from 1.07 (95% CI 1.02 to 1.12) in 1996–2000 to 1.10 (95% CI 1.06 to 1.14) in 2008–2012 for all-cause mortality. In contrast, in cluster M, the all-cause mortality risk for the all ages group decreased from 1.04 (95% CI 1.01 to 1.07) to 1.02 (95% CI 1.01 to 1.04). In cluster C, the all-cause mortality risk exhibited a decreasing trend from 1.03 (95% CI 1.00 to 1.06) to 1.01 (95% CI 1.00 to 1.02) for the all ages group. The risks of cardiovascular and respiratory mortality also exhibited an increasing pattern over time in cluster H, but decreasing patterns in clusters M and C.
For all-cause mortality in the elderly (≥75 years) in cluster H, the risk was 1.05 (95% CI 1.02 to 1.08) in 2008–2012 and 1.08 (95% CI 1.01 to 1.16) in 1996–2000, respectively (table 2). For clusters M and C, the risks in the elderly group, as well as all age groups, exhibited decreasing patterns in the later study period (2008–2012), compared with the earlier period (1996–2000). However, in younger adults (<75 years) from cluster H, an increasing trend in risk was observed from 1.04 (95% CI 0.98 to 1.11) to 1.06 (95% CI 1.01 to 1.12).
The impacts of temperature on all-cause mortality in subpopulations classified according to sex, job status and education level were also evaluated (table 3). Although during one period men had a higher risk than women, this pattern reversed in the other period; accordingly, there was no significant risk pattern according to sex. The risks for male and female exhibited an increasing pattern in cluster H, but not in clusters M and C. The risks for those with no education were higher in 2008–2012 relative to 1996–2000 in the all-combined regions (1.04 vs 1.02) and in cluster H (1.04 vs 1.02), whereas those in cluster M or C hardly changed. Significantly greater risks for blue-collar workers were observed in 2008–2012, compared with 1996–2000 in the all-combined regions (RR=1.06, 95% CI 1.04 to 1.07), cluster H (RR=1.05, 95% CI 1.02 to 1.08) and cluster M (RR=1.05, 95% CI 1.03 to 1.08).
All-cause mortality risk from heat according to sex, educational level and job status
Discussion
A few studies have analysed changes in heat-related mortality over time;25–33 however, those studies were often conducted in a single region and gave little consideration to differences in patterns of risk change based on climate. To the best of our knowledge, this is the first study to examine temporal changes in the temperature–mortality risk relationship in geographical regions of South Korea with climatic differences. Apparent threshold differences were identified among clusters classified by climate; the hottest cluster showed a consistently higher threshold for all types of mortality, compared with the cooler clusters. Similarly, previous studies in China,34 the USA,7 ,35 European cities8 ,11 ,36 ,37 and South Korea17 compared the temperature–mortality relationship among cities located in various geographic regions and found a higher threshold temperature in cities with hotter climates.
We found an interesting result of a difference in patterns of temporal changes in risk among clusters, and this finding might require confirmation in further studies. An increasing pattern of heat-related mortality was observed in the hottest cluster (cluster H), whereas the risk remained unchanged or decreased slightly in cooler clusters (cluster M or C). The results of metaregression analyses of year-specific temperature-related risks supported the findings from stratified analyses in the main results; the increasing trend in RRs of all-cause mortality for all ages and 20–74 age groups over year in cluster H were statistically significant (see online supplementary figure S1). The decreased risks in the elderly (≥75 years) or 20–74 years age group in cluster M and in cluster C showed weak statistical power. This result was similar to that of a recent study conducted in the USA, which showed that regions with cooler climates exhibited a steeper temporal decline in temperature-related mortality, whereas regions with hotter climates exhibited a slight reduction.38 A recent study examined changes in mortality risk associated with high temperature in six Korean cities and found weak evidence for increases in risks.39 In our study, the changes in the risks over time for all-combined regions similarly demonstrated little evidence of risk changes. However, we added new information of different risk changing patterns among regions by considering clusters with different climate. Increases in the average temperature led to higher increases in heatwave variables (frequency, duration and intensity) over a 17-year period in cluster H relative to the other clusters (table 1), which may explain the increased heat effect in cluster H. Our results suggest that future climate changes could induce considerably more extreme heatwave events and temperature-related mortalities within populations living in hotter regions. Moderate and cool regions could be also at higher risks in the future because of their lower threshold compared with hotter regions, although increased risks were not found in this study.
Supplementary figure
Yearly Relative Risks in the elderly (Left) and the young adults (Right) in each cluster: (a) Cluster H, (b) Cluster M, (c) Cluster C.
There are six metropolitan cities in South Korea, and they are under the direct and intensive control of the central government. The developmental level of these cities is exceedingly higher than that in other cities, as these metropolitan cities have been developed as special zones. We identified that more urbanised regions, including the capital (Seoul) and three metropolitan cities (Gwangju, Daegu and Busan), comprised the hottest cluster (cluster H). The rate of increase in usage of air conditioning, an important factor of risk reduction,18 ,38 ,40 did not differ significantly among clusters during the study periods, despite differences in urbanisation and socioeconomic status. Urbanised areas have an increased capacity for thermal retention because of the heavy building density. This causes an ‘urban heat island effect’, which refers to higher ambient temperatures in urban areas relative to surrounding regions.41 This ‘urban heat island effect’ most likely causes urbanised areas to suffer from a higher frequency of heatwaves, compared with other regions, eventually leading to a stronger heat–mortality relationship.42 ,43 In addition, according to a governmental report published by the Rural Development Administration, the increase in temperature over the past 30 years was higher in urban areas than in rural areas because of the lower amount of green space and higher building density in the former.44 As a result, the increased heat effect observed in cluster H agrees with the projection that urbanised regions might be much more vulnerable to damage from temperature-related mortality caused by future climate changes.42
CDD is a major index used to explain energy demand in the energy and power fields.45 Several studies have used CDD to approximate differences in climate and explain geographical variances in the effect of heat on heat-related health consequences.46–48 To the best of our knowledge, this is the first study to evaluate the impact of temperature on mortality in South Korea using CDD. The adoption of CDD for categorising regions with different heat conditions appears useful for a country-level study, rather than using typical categorisation methods based on air mass type, as a small country is generally classified under a single category (eg, hot and humid). Compared with other commonly used thermal indices (eg, mean or maximum temperature), CDD may also more effectively represent geographical differences in the degree of heat because those other indices reveal relatively narrow variances among regions. Using multiple clusters based on CDD, we could identify variations in temporal changes in the temperature–mortality relationship even within a small country.
Preventive measures such as heatwave early warning forecasts have been implemented to prevent temperature-related mortality in developed countries worldwide. Several studies have reported the effectiveness of early heat health warning forecasts or surveillance systems for reducing heat-related mortality by comparing the risks between time periods with and without these preventive measures.26 ,27 ,30 ,31 ,33 The KMA initiated a national heatwave early warning system in 2008. Maximum temperature and the national threshold are used to identify heatwave. Heatwave is defined as days with a daily maximum temperature exceeding 33°C for more than 2 days. A heatwave forecast announces regions where heatwave is predicted. Once a heatwave is predicted or observed, the local government's heatwave department immediately receives a warning text from the KMA, after which officials implement actions targeted towards the elderly (>65 years old) and disabled people who live alone; they open shade shelters and dispatch health volunteers to the targeted people. These measures might be unequally effective with respect to region, age, socioeconomic status and job status. There might be a positive effect of heatwave plan targeted plan since common risk reduction was observed in elderly populations over time in all clusters by the stratified analyses. However, the trend of increased risks in the hottest cluster suggests a need for a modified heatwave plan for groups considered highly vulnerable to heat exposure, specifically younger people, those with less education attainment or those holding blue-collar jobs. Younger people and those with less education are more likely to be exposed to high heat during the summer because of relatively frequent outdoor activity9 and a low socioeconomic status, respectively. Blue-collar workers are more vulnerable than other workers to heat-related risk49 because many blue-collar jobs comprise outdoor occupations such as agricultural or manual labour, where workers are exposed to high temperatures during working hours.50 ,51 Efforts to develop particularly customised preventive measures, both for the elderly and younger adults, as well as those with a low socioeconomic status and outdoor labourers are highly recommended.
This study has several limitations. First, the study period (17 years) might be short to predict in the far future trends in the impact of high temperatures following global warming. Nevertheless, the increasing trend in temperatures due to climate change was higher in South Korea than the average global temperature increase in the 20th century as reported by the IPCC Fourth Report, and these changes in temperature have accelerated during the most recent two decades.20 Therefore, we expect that our study results will sufficiently reflect variations in the effects of heat on mortality over time to some degree.
Second, the risks calculated in 2008–2012 were only adjusted for PM10 and O3 concentrations, as the daily mean PM10 and O3 data were only available for a limited period (2003–2012). Several studies showed that air pollutants were potential confounders of the temperature–mortality relationship,1 ,52–54 whereas others reported no significant confounding effect.13 In this study, the adjusted risks for mortality hardly changed or decreased only slightly when compared with the unadjusted estimates.
According to the worst greenhouse gas emission scenario, it is expected that the annual average temperatures will increase by up to 5.3°C and that the annual extreme heatwave duration will increase by 6.1 days in South Korea in the late 21st century, compared with the late 1990s.20 These changes will be much greater in lowland areas with higher temperatures.20 Along with this projection, populations living in hotter regions or with exposure to high levels of heat due to socioeconomic status might be at a higher risk of heat-related health damage resulting from climate change. It is imperative to improve preparedness for health damage resulting from heat stress at the national and regional levels.29 Continuous efforts should also be implemented to assess long-term trends in heat-related risks with regard to public health and identify the factors related to changes in this risk in order to develop appropriate climate change adaptation plans.
References
Footnotes
Contributors SH contributed to building the study concept and design, conducting the paper review and the entire statistical analysis, writing documents and corresponding to peer reviewers. BYK gave advice on statistical analysis. JK collected and managed the data. KHJ participated in the paper review. The proofreading of the first draft is attributed to discussing process with SH, SL and EL.
Funding The researchers of this study express thanks to the Korea Center for Disease Control and Prevention (CDC), with research programme no. 2013E2100102 and no. 2013E2100202. Also, this work was funded by the Korea Meteorological Administration Research and Development Program under (Grant KMIPA 2015-2130).
Competing interests None declared.
Provenance and peer review Not commissioned; externally peer reviewed.
Data sharing statement No additional data are available.