Article Text

Abstract
Objectives To examine the level and trend in the coverage gap of a set of interventions of maternal and child health services using a summary index and to assess the disparity in usage of maternal and child health services in the districts of high focus states of India.
Design Data for the present study are taken from the Annual Health Survey (AHS), 2010–2013 and Census of India, 2011.
Settings This study used secondary data from states having higher mortality and fertility rates, termed as high focus states in India.
Participants District-level information regarding children aged 12–23 months and ever married women aged 15–49 years has been extracted from the AHS (2010–2013), and household amenities, female literacy and main workforce information has been obtained from the Census of India 2011.
Measures 2 summary indexes were calculated first for maternal and child health services and another for socioeconomic and development status, using data from AHS and Census. Cronbach's α was used to assess the internal consistency of the items used in the index.
Results The result shows that the coverage gap is highest in Uttar Pradesh (37%) and lowest in Madhya Pradesh (21%). Converge gap and socioeconomic development are negatively correlated (r=−0.49, p=0.01). The average coverage gap was highest in the lowest quintile of socioeconomic development. There was an absolute change of 1.5% per year in coverage gap during 2009–2013. In regression analysis, the coefficient of determination was 0.24, β=−30.05, p=0.01 for a negative relationship between socioeconomic development and coverage gap.
Conclusions There is a significant disparity in the usage of maternal and child healthcare services in the districts of India. Resource-rich people (urban residents and richest quintile) are way ahead of marginalised people (rural residents and poorest quintile) in the usage of healthcare services.
- Coverage gap index (CGI)
- Socio-economic development indicator (SEDI)
- Maternal health
- High focus states
This is an Open Access article distributed in accordance with the Creative Commons Attribution Non Commercial (CC BY-NC 4.0) license, which permits others to distribute, remix, adapt, build upon this work non-commercially, and license their derivative works on different terms, provided the original work is properly cited and the use is non-commercial. See: http://creativecommons.org/licenses/by-nc/4.0/
Statistics from Altmetric.com
Strengths and limitations of this study
This is the first study to show the district-level coverage gap between maternal and child health services in high focus states of India.
This study used the socioeconomic development index and measured the gap in maternal and child health services.
However, the study could not assess the coverage gap between maternal and child health services for all districts of India due to the unavailability of data.
Equal weight is given to each of four broad domains; however, in the Indian scenario, dropout and usage rates vary for each vaccine/morbidity related to childcare.
Introduction
Despite all efforts, maternal and child health remains a challenge to the healthcare delivery system in low-income and middle-income countries. The global consensus on the concerns of maternal and child health was emphasised in 2000 as the Millennium Development Goals (MDGs) and recently in 2015 as Sustainable Development Goals (SDGs).1 ,2 By the year 2030, SDG 3.1 aims to reduce maternal mortality ratio <70 per 100 000 live births, SDG 3.2 seeks to reduce neonatal mortality rate below 12 per 1000 live births, and under-5 mortality below 25 per 1000 live births, and SDG 3.7 aims to achieve universal sexual and reproductive health access.
An accelerated increase in the key coverage indicators of the maternal, newborn and child health interventions is essential to achieve the targets of SDGs.2
Despite several programmes and efforts made by the Government of India, the quality of maternal and child healthcare is not up to the mark and India is likely to miss the opportunity to achieve the fourth and fifth goals of MDG.3 ,4 Maternal, infant and child health inequities remain serious public health concerns in India that have many socioeconomic implications, such as poor health outcomes, increased direct and indirect healthcare costs, slowing down the socioeconomic development, etc. Health inequalities are influenced by various factors, such as socioeconomic status (SES),5 quality of care, educational attainment, discrimination, biological and genetic characteristics, behaviour, and the environment. India is not unique in displaying inequalities in maternal, newborn and child health.6 It is well documented that poor mothers and children do inferior than their better-off peers in health related outcomes.7 ,8 The risk of maternal and infant mortality and pregnancy-related difficulties can be reduced by increasing access to quality preconception (before pregnancy) and interconception (between pregnancies) care.9 Moreover, healthy birth outcomes and early identification and management of health conditions among infants can prevent death or disability. In India, nine high focus states with high fertility and mortality, namely Bihar, Jharkhand, Madhya Pradesh, Chhattisgarh, Uttar Pradesh, Uttarakhand, Rajasthan, Odisha and Assam, account for 48.48% of India's population. According to the Census of India, 2011, average urbanisation in high focus states was 20.73%, whereas India's percentage of urbanisation was 31.15%.10 Regardless of increasing expenditure on healthcare and extraordinary medical breakthroughs, the healthcare system fails to adequately and equally serve many parts of the nation.6 Therefore, to achieve SDG, the coverage of maternal, newborn and child health indicators needs to be enhanced. A ‘coverage gap’ is, in general, defined as the percentage of the people not receiving a particular intervention out of those who need it. It is an important measure to look at the outcome of the health services and also to monitor the progress of health programmes. The health coverage gap indicator clearly represents that proportion of needy people who are not receiving but need the services.
SES11 is a complex term used to characterise one's social position, often defined by income and educational attainment. Recent studies suggest that SES plays a vital role in health outcomes, access to healthcare and overall quality of care.6 ,12 ,13 Individuals with a low SES are more likely to experience poor nutrition, inadequate housing and greater exposure to environmental hazards, all factors that contribute to overall health. It would be fruitful to relate the SES and coverage gap in the Indian context as the nation has a wide diversity in the SES among states.
The objective of the study is to examine the variation in coverage rates for a key set of interventions of maternal and child health services through a coverage gap index (CGI) in high focus states of India and to examine the relationship between socioeconomic development indicator (SEDI) and CGI in the districts of high focus states of India.
Materials and methods
Data sources
Data used in this study have been taken from all three rounds of the Annual Health Survey (AHS) 2010–2013,14–16 which have covered a total of 20.94 million population and 4.32 million households. AHS was conceived in the year 2005 to initially confine the survey to the 284 districts (as per the 2001 Census) of the nine high focus states in India for a 3-year period starting from 2010 to 2011. In India, nine states with high fertility and mortality rates, namely Bihar, Jharkhand, Madhya Pradesh, Chhattisgarh, Uttar Pradesh, Uttarakhand, Rajasthan, Odisha and Assam, are termed as high focus states.17 This study has used socioeconomic data from the Census of India, 2011.10
Measures used in the study
Two composite indices are used to assess the variation in maternal and child healthcare. The coverage gap in maternal and child healthcare services is measured using a composite indicator, known as CGI (Countdown 2008 Equity Analysis Group),12 ,18–20 and is presented as: 1
1
where ORT is the oral rehydration therapy; ARI is the acute respiratory infection; FP is the family planning; SBA is the skilled birth attendance; ANC is the antenatal care; MSL is the measles vaccination; DPT3 is the three doses of diphtheria, pertussis and tetanus vaccine; and BCG is the BCG vaccination. A detailed description of the variables selected for constructing the CGI along with their definitions is presented in table 1. The CGI comprises a set of four intervention areas,21 which were presented along the continuum of care, a major theme of the 2008 Countdown: family planning, maternal and newborn care, immunisation and treatment of sick children. CGI reports the gap between the maximum coverage (100% coverage based on availability as well as accessibility) and the coverage achieved under community settings.
Definition of indicators by intervention area used in the coverage gap index
Since this study deals with the district-level analysis, use of the wealth index is not appropriate. Thus, another index, termed the socioeconomic development index (SEDI), is used to study the overall socioeconomic development status of the district.22 ,23 On the basis of the existing literature, five variables were selected to construct SEDI, namely the female literacy rate, urban population, main workforce, safe drinking water and electricity as a source of lighting in the household, all expressed as a percentage.24–28 The methodology of computation of the composite index (CI) is adopted from the Human Development Report, 2010.22 ,29 It involves two steps for computation.
In step 1, the computation of the dimension index for each of the indicators considered for the specific CI is performed using the following expression: 2
2
where Vi is the actual value of the indicator, Vmin is the minimum and Vmax is the maximum value percentage of the indicators in distribution.
In step 2, the computation of the CI is performed assigning equal weights to each indicator included in the CI as under: 3
3
where Di is the dimension index, and N is the number of dimension indices included in the CI.
Statistical analysis
Cronbach's α reliability coefficient was calculated to ascertain the internal consistency of the indicators used in the calculation of the index. The bivariate correlation was used to test the correlation between CGI and SEDI. Regression analysis was used to fit a linear regression model for CGI with different indicators of the SEDI. Distributional analysis according to SEDI quintiles was performed to check variation in CGI in different quintiles. Sensitivity analysis was also performed to verify the effect of change of SEDI and its components on CGI. A p<0.05 is considered as significant.
Results
Cronbach's α reliability coefficient was 0·75 for the set of eight coverage indicators for CGI and for the set of five indicators for SEDI, so none of the variables were removed in the calculation of the index.
Table 2 represents the summary statistics of the variables which were used to calculate the SEDI. The result shows that districts of Uttarakhand have the highest number of households having electricity as a source of lighting (85.12±6.33%) followed by Chhattisgarh (71.7±18.81%) with the lowest share in Bihar (16.2±9.58%). District-level female literacy was highest in Uttarakhand (70.24±12.40%) and lowest in Rajasthan (50.84±12.56%). Similarly, district-level employment was highest in Chhattisgarh (32.99±4.78%) and lowest in Bihar (20.44±3.01%). Only 2.8% of households in Bihar have access to safe potable water supply. Madhya Pradesh was the most urbanised state among all high focus states with an average urbanisation percentage of 24.48%, while Bihar was the least urbanised state with an average urbanisation percentage of 10.68%.
Mean and SD of variables used in SEDI in the high focus states of India, 2011, N=284
Table 3 represents the coverage gap, socioeconomic indicator and their correlation in high focus states of India. From table 3, it is evident that the average coverage gap was 29.30% in high focus states in India. The most populous state in India, Uttar Pradesh, witnessed the maximum coverage gap (∼37%) for maternal and child healthcare services. In nine high focus states, Uttarakhand was the best performing state in socioeconomic development aspects with an average SEDI of 0.55. On the other hand, Bihar is the worst performing state with the lowest average SEDI of 0.16. The Pearson correlation coefficient for CGI and SEDI is −0.49 which implies that CGI and SEDI are negatively correlated. Figure 1 shows the nature of the inverse relationship between CGI and SEDI. The relationship between CGI and SEDI can be written as: 4
4
Mean and SD of coverage gap index (CGI), socioeconomic development index (SEDI) and their correlation in the high focus states of India, 2011
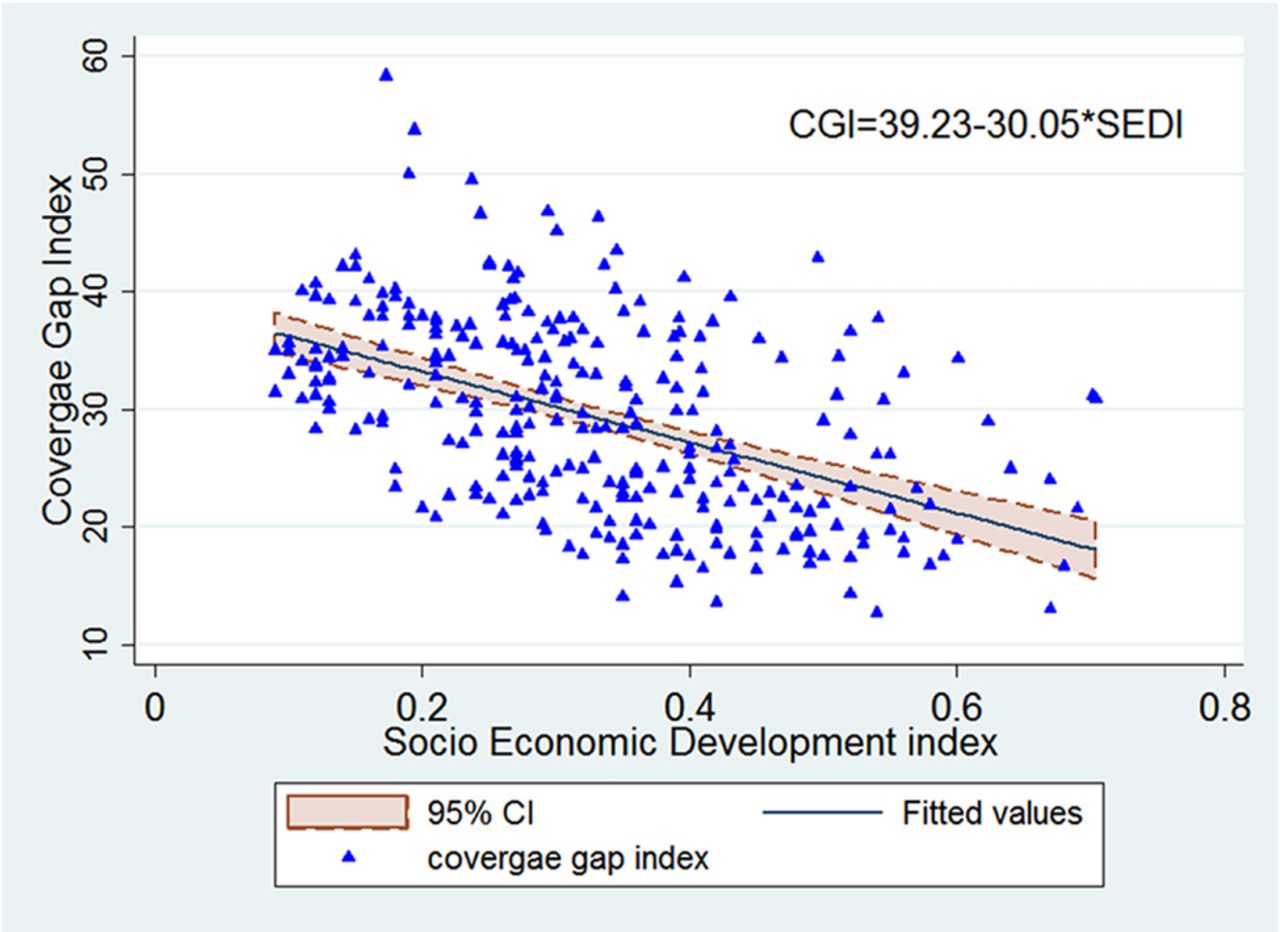
Relationship between CGI and SEDI, high focus states of India, 2012–2013. CGI, coverage gap index; SEDI, socioeconomic development index.
Figure 2 shows SEDI and CGI in high focus states of India. Figure 2A depicts district wise SEDI in high focus states; it shows that most of the districts of Uttar Pradesh and Bihar scored low on SEDI in comparison to districts of other states. Figure 2B shows district wise CGI in high focus states and it was observed that Uttar Pradesh and Bihar have the maximum number of districts with low CGI. According to figure 2C, almost all districts of Uttar Pradesh and Bihar have high CGI in rural areas. Figure 2D shows CGI in urban areas of districts, and according to this CGI was lowest in the districts with high SEDI.

District wise SEDI and CGI in high focus states of India, 2012–2013 (AHS III). (A) District wise socioeconomic development Indicator (SEDI) of high focus states-Census 2011. (B) District wise Coverage Gap Index (CGI) of high focus states of India- AHS (III). (C) CGI in rural areas of high focus states districts of India- AHS(III). (D) CGI in urban areas of high focus states districts of India-AHS (III). AHS, Annual Health Survey; CGI, coverage gap index; SEDI, socioeconomic development index.
Table 4 explains the district-level mean coverage gap by place of residence and wealth quintile for the summary measure and each of the four intervention areas with their indicators for all states included in this study. The mean overall gap was ∼30%, ranging from 35.41% for the lowest quintile of SEDI to 23.43% for the highest quintile of SEDI. The average gap was largest for family planning (53%) followed by maternal and newborn care indicators (36%), immunisation (17.16%), and was smallest for the treatment of sick children (9.33%). The huge gap of 44.51% in antenatal care usage was also striking. An overall district-level rural–urban gap in the coverage was 9.84%. The rural–urban gap was highest for maternal and newborn care indicators (14.31%) followed by the family planning practices indicator (5.67%) and lowest in the treatment of sick children (2.20%).
Mean coverage gap index for four intervention areas with indicators by place of residence and wealth quintile high focus states, India 2010–2013
The largest disparity in coverage gap by socioeconomic development quintiles was found for the family planning practices; the difference between the average gap for the poorest and wealthiest quintiles was 20.74%, followed by a gap in usage of antenatal care services (17.01%). This difference was smallest for the treatment of sick children (5.42%). Table 5 presents a comparison of the coverage gap from all three rounds of AHS. From table 5, it is evident that there is a decreasing trend in the coverage gap from AHS I to AHS III. In AHS I, the coverage gap was 33.8%, which declines to 29.30% in AHS III. At all points of time, the district-level coverage gap was highest for family planning. The rate of change in the coverage gap was 1.5% per year during 2009–2013.
Mean coverage gap index and its indicators in the high focus states for all three rounds of the AHS, India, 2010–2013
Figure 3 shows the trend of the coverage gap in study period from AHS I to AHS III. The coverage gap for treatment of sick children and immunisation was below the overall coverage gap; however, the gap for family planning and maternal care indicator was higher than the overall coverage gap at all points of time. Figure 4 shows a change in the CGI with variation in the SEDI using sensitivity analysis. From figure 4, it is evident that if baseline SEDI improves from 0.33 to 0.66, the CGI will reduce to 19.39 from 29.31.

Mean coverage gap index for four intervention areas with broad indicators for all three rounds of the AHS. AHS, Annual Health Survey.

Corresponding change in CGI with change in SEDI using sensitivity analysis and simulation. CGI, coverage gap index; SEDI, socioeconomic development index.
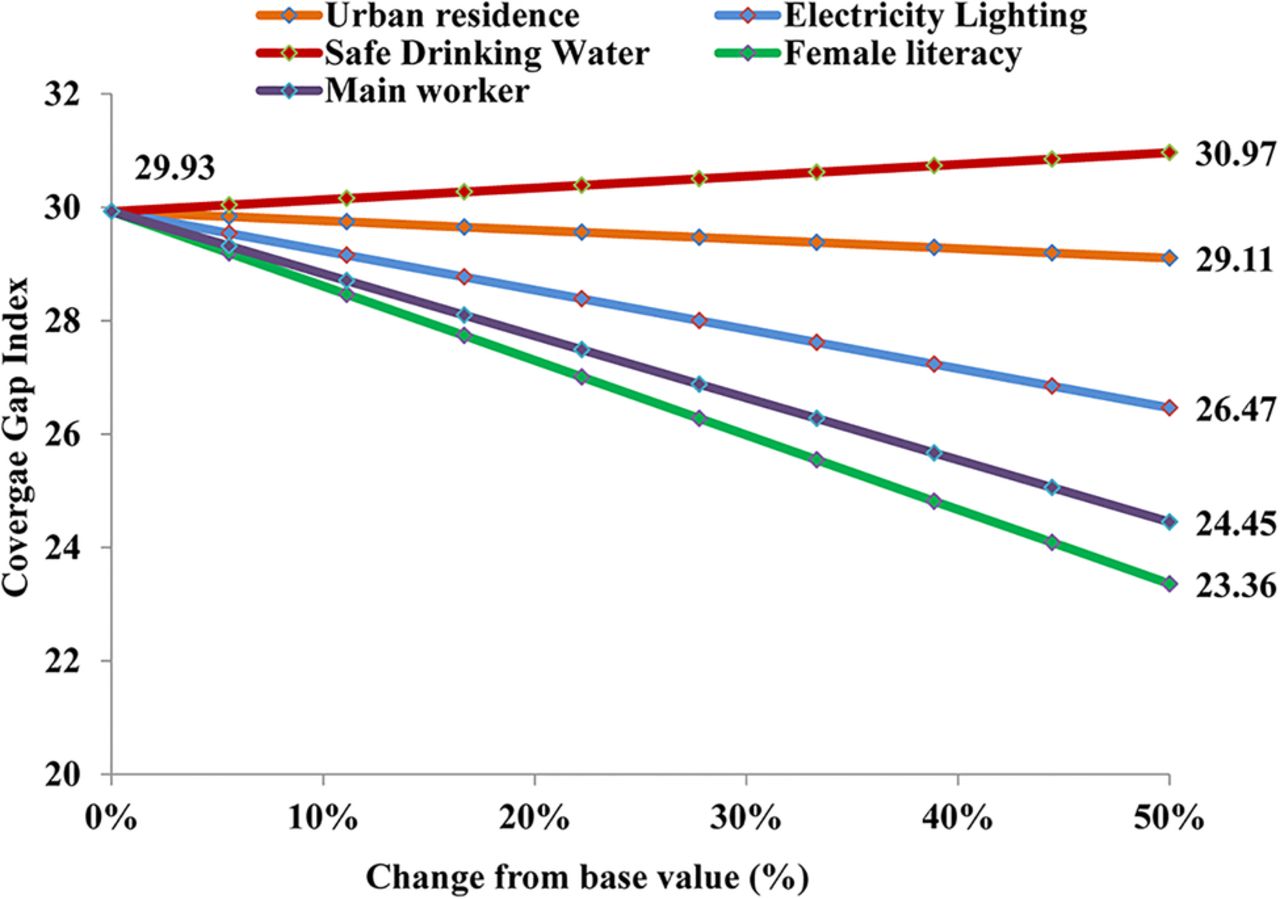
Table 6 elucidates the regression coefficients of linear regression analysis. From the estimated figures, it is clear that at the district level, electricity as a source of lighting in the household was the most significant predictor of CGI followed by main worker percentage and female literacy, and the percentage of urbanisation was the least essential factor. The value of adjusted coefficient of determination was 0.62, that is, a total 62% variance was explained by the regression model. Figure 5 shows results of sensitivity analysis; it illustrates that there will be maximum change in the CGI with change in female literacy.
Regression coefficient of the linear regression model of coverage gap index, India

Change in coverage gap index with change in variable of socioeconomic development index using sensitivity analysis and simulation.
Discussion
Coverage of health service interventions, as an important outcome and essential part of any policy to monitor improvement of health programmes, is well recognised in the literature.30 Previous works have shown the competence of a CI for coverage of health services that summarises the coverage of a range of interventions.31 ,32 Lozano et al33 developed a composite measure of health system coverage to compare the health system performance among states in Mexico. This measure was based on 14 interventions for child and adult health for which state-level estimates of coverage were available. This method allowed the inclusion of curative as well as preventive interventions.34 Later, the measure of coverage in health interventions was replicated by the Countdown to 2015 Analysis Group to track country and global progress towards achievement of MDGs 4 (reduce child mortality) and 5 (improve maternal health) at a regular interval.7 ,12 ,19 ,33
From table 3, it is evident that there was an adverse correlation between the district-level coverage gap and socioeconomic index in high focus states; the same findings were reported from other studies throughout the globe.6 ,12 ,19 ,35 The Countdown 2008 Equity Analysis Group reported that the coverage gap was highest in the lowest wealth quintile and lowest in the highest health quintile among 54 countries;12 the same results were observed in this study. From table 4, it is illustrated that lowest coverage gap in the highest quintile of the socioeconomic index. In other studies, the authors concluded that there were enormous socioeconomic and residence-related inequalities in maternal and child health indicators; these inequalities were mostly to the disadvantage of the poor.6 ,36
Table 4 illustrates that there is a significant rural–urban variation of 9.84% in the CGI; the same findings were observed in the study from India conducted by Kumar et al37 using all three rounds of National Family Health Survey (NFHS) data.
In this study, a minimal change in coverage gap of 1.5% per year was observed, which is consistent with an earlier reported study with a change in coverage gap of 1% per year.12
Figure 1 depicts the relationship between CGI and SEDI. It is evident from the figure that an increase in SEDI will decrease CGI further. Figure 2 shows the district-level distribution of SEDI quintiles and CGI of high focus states of India in 2012–2013. From this, it is evident that the districts in the lowest quintile of SEDI have high CGI in comparison to the districts in the highest quintile of SEDI.12 Marmot38 discussed the social determinants of health and described inequalities in health among different wealth quintiles which are similar to the findings of this study.
Figure 3 illustrates that the coverage gap for an indicator for family planning was highest in this study. There was a contradiction in the highest coverage gap from the family planning indicator. The Equity Analysis Group reported that the maximum gap was in the indicator for the treatment of sick children;12 however, Kumar et al37 reported that the family planning indicator has the highest coverage gap. Figure 5 shows results of sensitivity analysis and it was evident that a 50% increase in current female literacy will decrease the CGI to 23.36%.
Conclusions
Usage of maternal and child healthcare services has a significant disparity in India. Resource-rich people (urban residents and richest quintile) are ahead of marginalised people (rural residents and poorest quintile) in the usage of healthcare services. Rural–urban and poor–rich disparity should be bridged to achieve universal health coverage in India. Microlevel planning complemented by careful monitoring and evaluation of the current programme design and its implementation to ensure effective and efficient use of resources is the need of the hour to improve maternal and child healthcare in all corners of the nation. This study assesses the district-level coverage gap in healthcare interventions in family planning, maternal and newborn health, immunisation and treatment of sick children. This study adds a clear picture of the progress made by various districts in minimising the gap and the gap to be filled up. The maximum coverage gap was observed in the lowest quintile of socioeconomic development status. In districts having a coverage gap of 50% or more, implementation should be intensified; districts with a coverage gap of 30–50% need more concrete plans for reducing inequalities and districts with a coverage gap of below 30% require targeted intervention to reduce inequalities further and improve the overall scenario.
References
Footnotes
Contributors AA, CMP, RKC and US contributed in conceptualising the study. AA, CMP and RKC were responsible for the statistical analysis. All authors contributed to the interpretation of the data, and critically revised all versions of the manuscript and approved the final version.
Funding AA received financial assistance for his doctoral research from the Indian Council of Medical Research, Government of India, New Delhi, India.
Competing interests None declared.
Provenance and peer review Not commissioned; externally peer reviewed.
Data sharing statement This study is based on publicly available secondary data, taken from the Annual Health Survey (AHS) and Census of India, published by the Office of the Registrar General of India and Census Commissioner, Ministry of Home Affairs, Government of India, New Delhi (http://www.censusindia.gov.in/). Requests for the data may be sent to ddu.rgi@nic.in.