Article Text

Abstract
Objectives A comparison of appraisals made by general practitioners (GPs) in France and occupational physicians (OPs) and insurance physicians (IPs) in the Netherlands with those made by Scandinavian GPs on work capacity in patients with severe subjective health complaints (SHCs).
Setting GPs in France and OPs/IPs in the Netherlands gathered to watch nine authentic video recordings from a Norwegian general practice.
Participants 46 GPs in France and 93 OPs/IPs in the Netherlands were invited to a 1-day course on SHC.
Outcomes Recommendation of sick leave (full or partial) or no sick leave for each of the patients.
Results Compared with Norwegian GPs, sick leave was less likely to be granted by Swedish GPs (OR 0.51, 95% CI 0.30 to 0.86) and by Dutch OPs/IPs (OR 0.53, 95% CI 0.37 to 0.78). The differences between Swedish and Norwegian GPs were maintained in the adjusted analyses (OR 0.43, 95% CI 0.23 to 0.79). This was also true for the differences between Dutch and Norwegian physicians (OR 0.55, 95% CI 0.36 to 0.86). Overall, compared with the GPs, the Dutch OPs/IPs were less likely to grant sick leave (OR 0.60, 95% CI 0.45 to 0.87).
Conclusions Swedish GPs and Dutch OPs/IPs were less likely to grant sick leave to patients with severe SHC compared with GPs from Norway, while GPs from Denmark and France were just as likely to grant sick leave as the Norwegian GPs. We suggest that these findings may be due to the guidelines on sick-listing and on patients with severe SHC which exist in Sweden and the Netherlands, respectively. Differences in the working conditions, relationships with patients and training of specialists in occupational medicine may also have affected the results. However, a pattern was observed in which of the patients the physicians in all countries thought should be sick-listed, suggesting that the physicians share tacit knowledge regarding sick leave decision-making in patients with severe SHC.
- GENERAL MEDICINE (see Internal Medicine)
- HEALTH SERVICES ADMINISTRATION & MANAGEMENT
- OCCUPATIONAL & INDUSTRIAL MEDICINE
- PAIN MANAGEMENT
- PRIMARY CARE
- PUBLIC HEALTH
This is an Open Access article distributed in accordance with the Creative Commons Attribution Non Commercial (CC BY-NC 4.0) license, which permits others to distribute, remix, adapt, build upon this work non-commercially, and license their derivative works on different terms, provided the original work is properly cited and the use is non-commercial. See: http://creativecommons.org/licenses/by-nc/4.0/
Statistics from Altmetric.com
- GENERAL MEDICINE (see Internal Medicine)
- HEALTH SERVICES ADMINISTRATION & MANAGEMENT
- OCCUPATIONAL & INDUSTRIAL MEDICINE
- PAIN MANAGEMENT
- PRIMARY CARE
- PUBLIC HEALTH
Strengths and limitations of this study
This is the first study where physicians from five countries assess work capacity of the same patients.
This is the first study to compare sick leave appraisals between physicians with different roles, that is, the dual role of general practitioner (GP) as care provider and gatekeeper compared with the role of occupational physician (OP)/insurance physician (IP) as gatekeeper only.
The study design used video vignettes that reflect real life better than the written vignettes often used in training.
The vignettes were translated into different languages which may have resulted in the loss of small nuances in the discussions between the patients and the physicians.
Subtitles may draw attention away from the non-verbal communication in the vignettes.
Introduction
The sickness absence rate is of great concern in the Western world.1 The economic burden on society and the individual health problems related to sickness absence make this topic a frequent issue in politics and research.
In most countries, general practitioners (GPs) are responsible for issuing the majority of sick certifications, as in Norway where about 80% of the sick certifications are issued by a GP.2 The complex process of sickness absence is determined by several stakeholders, such as the patient in question, the physician, the workplace and the cultural and economic conditions of the society.3 Controlling officials for sick leave certification, such as occupational physician (OP) and insurance physician (IP), are also stakeholders who can influence sick leave duration.4 Each of these stakeholders plays a significant role in every sick note. Most research on sickness absence has focused on characteristics related to the individual or the workplace. The role of the physician and the culture and legislation of the country have received less attention.
We have previously reported on a study in which Scandinavian GPs assessed diagnoses and work capacity of patients with severe subjective health complaints (SHCs).5 ,6 In that study, 126 GPs from Norway, Sweden and Denmark watched authentic video recordings from a Norwegian general practice where nine different patients discussed their health issues and their difficulties with staying at work with their GP. While the GPs proposed a great variety of diagnoses for each of the patients they assessed, mostly symptom based, they agreed to a large extent in their assessments of work capacity.5 ,6
Although there are variations in the different Scandinavian countries' legislations on benefits, one could assume that cultural similarities (habits, traditions and moral standards4) may account for the agreement among the GPs in Norway, Sweden and Denmark. It would therefore be of interest to investigate whether GPs in another European country assessed the patients in the video vignettes differently.
Furthermore, it has been questioned whether GPs should continue to have the dual role of healthcare provider and gatekeeper for compensation following sickness absence.3 ,7 In some countries, like the Netherlands, these two tasks are separated so that an individual with reduced work capacity has to be assessed by an OP or an IP in order to receive compensation during sick leave.8 While GPs may be accused of being too close to their patients to be objective in their assessment of work capacity, the opposite may be true for the OPs and IPs who are engaged by the employer or social security agency, respectively. Given these differences between the European countries, it should be interesting to add assessments made by Dutch OPs and IPs to this study.
The aim of this study was therefore to investigate whether GPs in France and OPs and IPs in the Netherlands assess the work capacity of patients with severe SHC differently, compared with the existing data from the previous study on Scandinavian GPs.
Methods and material
Study design
In this cross-sectional study, we have compared physicians' assessments of work capacity in patients with SHC. In order to do so, we asked physicians from France and the Netherlands to watch nine video vignettes and provide their assessments on a questionnaire for each vignette. The vignettes and questionnaire were previously used in a study of GPs in Norway, Sweden and Denmark,5 which made a comparison of assessments possible.
Patient group
In the previous study, all the patients were reported to have severe SHCs.5 ,9 This term is largely identical to the more common terms medically unexplained physical symptoms (MUPS) or medically unexplained symptoms (MUS). The term bodily distress syndrome (BDS) has also been suggested.10 All these terms refer to the patients with health complaints ‘defying the clinical picture of known, verifiable, conventionally defined diseases and unbacked by clinical or paraclinical findings’.11 Although all these terms are controversial, they refer to conditions well known to clinicians, such as unspecific pain from the musculoskeletal system, fatigue, feelings of mood disturbances and other unspecific symptoms.12 The prevalence of patients with MUPS has been reported from 3% to 33% in general practice.13 In this paper, we use the terms MUPS and SHC synonymously.
We have chosen this patient group for our study because patients with MUPS have a higher risk for sickness absence14 and physicians find it more difficult to assess their work capacity than that of patients with specific and well-defined conditions.15 ,16 We assumed that assessment of work capacity in patients with SHC reflected personal attitudes, relationships with patients and individual judgments to a larger extent than assessments of pneumonia, heart attacks and fractures, which more often follow a predictable course.
The videos consisted of nine authentic consultations from a Norwegian general practice showing patients with severe SHC claiming to be too ill to work (table 1). The original films were transcribed and rerecorded with professional actors in the patients' roles. The films were provided with French and Dutch subtitles created by a professional translation bureau. Each vignette had a short introduction by the GP with some background information and results of medical investigations.
Description of the patients presented in the video vignettes5
Participant recruitment
France was chosen due to similarities in the working conditions of GPs in France and Scandinavia (self-employed, per capita payment, mostly small family medicine centres) but cultural differences in their history, language and religion. The region was chosen due to previous collaboration between the researchers in this study. Of the 2000 GPs in the departments of Loire Atlantique and Vendée, 200 were randomly selected and invited by letter to participate in the study. Of these, 34 agreed to participate. In order to reach a sufficient number of participants at the two sites, GPs were also contacted by telephone or email and individually asked to participate. The French GPs were provided €350 each for their participation. In the Netherlands, invitations were sent by email to all OPs from the country's largest occupational health services and all IPs working with sickness certification at six offices of the Institute for Employee Benefit Schemes. The Dutch OPs and IPs attended the seminar as a continuing medical education activity.
Data collection
A sample of GPs in France gathered for a 1-day seminar in order to collect the data. The same was done for a sample of OPs and IPs in the Netherlands. In both countries, the first part of the seminar was dedicated to data collection and the second part to courses and group discussions on the theme.
The participants were presented with nine case stories on video vignettes. Following each case story, the participants were asked to answer a questionnaire (see online supplementary appendix 1) to give their assessment of sick leave or not (for details, see Mæland et al5). Sick leave decisions were dichotomised into ‘no sick leave granted’ and ‘partial or 100% sick leave granted’.
Supplementary appendix
The questionnaire also assessed background information regarding the physician's age, gender and work experience. Further, the physicians were asked to provide up to three diagnoses for each patient; these were categorised according to chapters of the International Classification of Primary Care 2 (ICPC-2): Generalised and unspecific (A); Musculoskeletal (L); Psychological (P); and other organ chapters. Additionally, participating physicians were asked to respond to the statements related to the cause of complaints and sick leave, and to the patients' ability to work. These statements were as follows: ‘The work situation is the main reason for the patient's complaints’, ‘Their private life is the main reason for the patient's complaints’, ‘Medical and health related factors are the main reasons for granting sick leave’, ‘The patient is not motivated to work’, ‘If the patient is not sick-listed, the complaints will worsen or the healing process will be slower’ and ‘How would you judge the patient's ability to work?’. Answers were given on a five-point Likert scale ranging from strongly agree to strongly disagree for all questions, except for those relating to workability which had answers ranging from negligibly reduced to very much reduced. The answers on the Likert scale were dichotomised for the analyses.
Statistics
The nine questionnaires from all participating physicians were transferred into a statistics program. Statistical analyses were performed in IBM SPSS Statistics V.22.0. Statistical significance was set to p<0.05. Between-country differences in background variables were tested with χ2 tests for gender and Kruskal-Wallis tests for age and work experience.
Sick leave decisions (no/yes) were the main outcome of the study. Differences between countries regarding the physicians' sick leave decisions were tested with generalised linear mixed model (GLLM) analyses with country and patient as factor, and a random slope for doctor. Norway was used as a reference country. GLLM analyses were also used to test differences between doctor specialisation (GP or OP/IP) regarding sick leave decisions; the model included specialisation and patient as factors, and a random slope for doctor.
Assessment of confounding was done for the background variables of the physicians, as well as for diagnosis, reported cause for health complaints, reasons for sick leave and work capacity. Assessment of confounding was done separately for between-country differences and for differences between GPs and OPs/IPs. Confounders were first identified by determining whether an association existed between the outcome and the potential confounder. Second, when an association was significant, it was added to the model and confounding was assessed by a 10% change in the main effect estimates for country (first analysis) or physician specialty (second analysis). Last, all identified confounders were simultaneously added to the crude model. The crude and adjusted model results are presented as ORs.
Results
A total of 46 GPs in France and 93 OPs/IPs in the Netherlands participated in the study and gave their assessments of the nine video vignettes (table 1). In this study, we compared these data with the results previously reported by 56 GPs in Norway, 29 GPs in Sweden and 41 GPs in Denmark.
For gender, a statistically significant difference was found between the countries (p=0.018). There were more male than female physicians in the samples from Norway and the Netherlands (table 2).
Demographic information of participating GPs from Norway, Sweden, Denmark and France, and OPs/IPs from the Netherlands
Statistically significant differences were found between the countries for age (p=0.001) and for work experience (p=0.002). The physicians in Norway and Denmark were somewhat younger than those in the other countries. The OPs and IPs in the Netherlands tended to have more work experience compared with the physicians from other countries.
Sick leave decisions
For each country, the percentage of physicians granting sick leave is given in figure 1. This figure shows that there were small differences in the way each patient was assessed in the various countries, and that in every country, patients 2, 6 and 9 were granted sick leave far less often than the other patients. When comparing the other countries with Norway, differences in the decisions made regarding patients' sick leave varied from 0% to 26%. Overall, statistically significant differences were found between the countries (table 3). Compared with GPs in Norway, sick leave was less likely to be granted by GPs in Sweden (OR 0.51, 95% CI 0.30 to 0.86) and by OPs/IPs in the Netherlands (OR 0.53, 95% CI 0.37 to 0.78). The analyses were adjusted for work capacity, medical cause as main reason for sick leave and work situation as main reason for health complaints. The differences between GPs in Sweden and Norway were maintained in the adjusted analyses (OR 0.43, 95% CI 0.23 to 0.79). This was also true for the differences between physicians in the Netherlands and Norway (OR 0.55, 95% CI 0.36 to 0.86).
Crude and adjusted OR for the probability that GPs from Sweden (n=29), Denmark (n=41) and France (n=46) and OPs/IPs from the Netherlands would grant sick leave, compared with Norwegian GPs

Percentage of general practitioners (GPs) from Norway, Sweden, Denmark and France, and occupational practitioners (OPs)/insurance practitioners (IPs) from the Netherlands granting sick leave to patients 1–9.
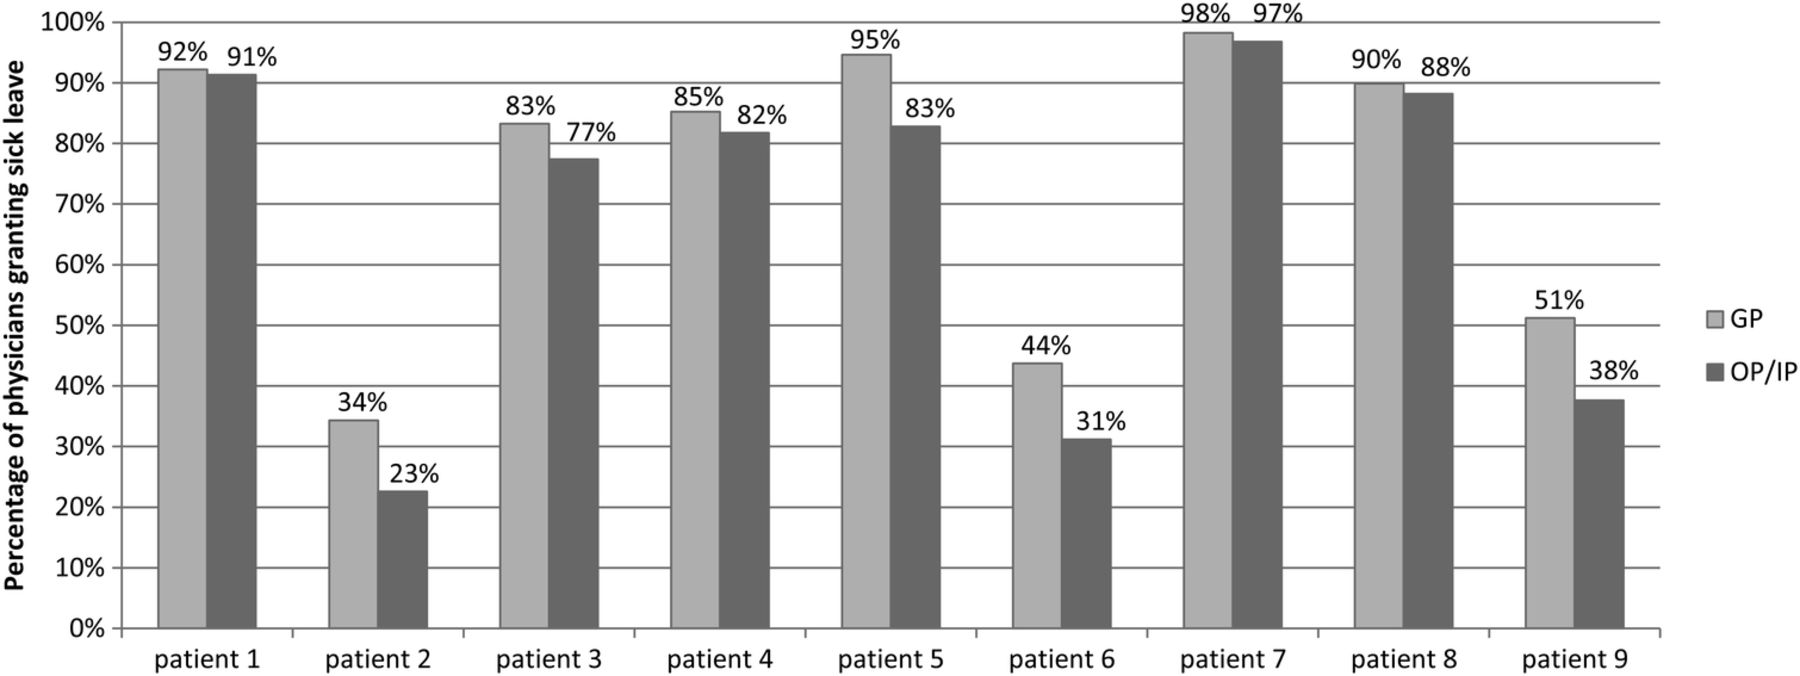
In table 4 and figure 2, we have compared the OPs and IPs in the Netherlands with all GPs. Differences between the GPs and OPs/IPs in the Netherlands were between 1% and 13% (figure 2). Overall, compared with the GPs, the OPs/IPs in the Netherlands were less likely to grant sick leave (OR 0.60, 95% CI 0.45 to 0.87). In adjusted analyses, with diagnosis chapter (ICPC-2) as the only confounder, the difference between the GPs from other countries and the OPs/IPs in the Netherlands remained (OR 0.67, 95% CI 0.49 to 0.93). The interactions between doctors and diagnosis showed that OPs/IPs in the Netherlands were less likely to grant sick leave than GPs when a diagnosis under chapter A (‘General and unspecified’ in the ICPC-2 system) was given rather than another diagnosis.
Crude and adjusted OR for the probability that OPs/IPs from the Netherlands would grant sick leave, compared with GPs from the other countries

Percentage of the total sample of general practitioners (GPs) (Norwegian, Danish, Swedish and French together) and occupational/insurance physicians (Dutch) granting sick leave to patients 1–9.
Discussion
In this study, GPs from Sweden and OPs/IPs from the Netherlands were less likely to grant sick leave to patients with severe SHC compared with GPs from Norway, while GPs from Denmark and France were just as likely to grant sick leave as GPs from Norway. However, the pattern of deciding which patients should be sick-listed was quite similar in all countries. The comparison based on physician specialisation showed that, overall, OPs and IPs were less likely to grant sick leave than GPs.
As previously stated, this study was based on the same material as a previous study on GPs from Norway, Sweden and Denmark.5 ,6 In the previous study, the GPs' assessments were tested one by one for each of the nine vignettes and no significant differences were reported between the GPs from the three countries with one exception.5 A significant difference was found between GPs from Norway and Sweden in their assessments on patients given a P diagnosis (‘Psychiatric diagnoses’ in the ICPC-2 system). This may, to some extent, explain the differences in the assessments made by GPs from Norway and Sweden in this study. Furthermore, in the present study, we have combined the assessments for all nine vignettes in order to study the main effects for each country. This may have produced a different result than testing for each vignette separately, that is, with an interaction between country and patients. Also, when considering the relatively large difference between the countries for some patients, that is, 21–26% for patients 3, 5 and 6, the small sample size may have limited the power of the analyses in the previous study.
Although none of the participants in this study had any relationship to the patients, one may assume that the differences in assessments observed between GPs from Sweden and OPs/IPs from the Netherlands on the one side, and the GPs from Norway, Denmark and France on the other, reflect real differences in attitudes, knowledge and practices in their sick-listing patterns in real life. In order to interpret the findings, it is important to look at differences in the training, social security legislation, culture and organisational settings of these physicians.
Regarding management of severe SHC and social security legislation, Sweden and the Netherlands have launched guidelines including information which may be of value in the assessment of patients with SHC.17 In 2007, Sweden created a national guideline assigning a specific length of sick leave to all medical conditions,18 and in the Netherlands, national guidelines on the management of MUS have been available since 2013.19 These guidelines may have improved general knowledge on the difficult task of assessing work capacity in patients with SHC. The French guidelines on recommended duration of sick leave do not apply to SHC as all conditions listed are specific and well-defined medical diagnoses.20
The training of specialists in occupational medicine, such as OPs and IPs, probably created differences between them and the physicians in this study. IPs and OPs in the Netherlands were less likely to grant sick leave compared with the GPs in Norway as well as compared with the combined sample of GPs from all four countries. However, GPs in Sweden were even less likely to grant sick leave than the OPs and IPs in the Netherlands. Therefore, this study indicates that the specific training of OPs and IPs may have an impact on their decision-making, but training alone does not account for all the differences between OPs/IPs and GPs found in this study.
In terms of organisational differences, GPs in Norway are self-employed and paid on a per capita fee, as are GPs in Denmark and France, while GPs in Sweden work in multidisciplinary community health centres and have a fixed salary. The OPs/IPs in the Netherlands also have a fixed salary, and they work in large settings of multidisciplinary occupational health services or within social security agencies. A qualitative study from Norway suggests that GPs feel somewhat economically dependent on their patients which may affect their gatekeeper role.21
In a previous systematic review of physicians' determinants for sick-listing patients with low back pain (LBP), the question was raised whether ‘the otherwise beneficial patient–physician relationship and physicians’ care for their patients may be an obstacle to following guidelines on LBP management in the sick-listing process’.22 The present study may be interpreted as supporting this statement if we assume that GPs from Sweden and OPs/IPs from the Netherlands are less closely related to their patients than the GPs from the other countries, due to differences in the encounter settings.
It is also important to highlight the similarities in the assessments of the participating physicians. The same pattern of patients recommended to be sick-listed or not was found in every country and between GPs and OPs/IPs in the study. In all countries, patients 2, 6 and 9 were deemed less likely to be sick-listed, while more than 80% of the physicians in each country recommended sick leave for patients 1, 4, 7 and 8.
The concept of tacit knowledge has gained increasing attention in research23 and may be applicable to our understanding of the similar assessments provided by all the participants in this study. Listening to the case stories of vignettes 2, 6 and 9, it is not obvious why they were assessed differently than the other stories of severe SHC. Nevertheless, there is something about these stories, or these patients, that inspired a different assessment than the other vignettes. We believe this calls for further research on medical judgment and tacit knowledge as important factors in physicians' decision-making on sick leave.
Strengths and limitations
To our knowledge, this is the first study comparing physicians' sick leave appraisals using video vignettes. This design reflects real life better than the written vignettes often used in training24 because the non-verbal information derived from videos plays an important role in a physician's assessment.25 It is also the first study to directly compare sick leave appraisals between physicians with different roles, that is, the dual role of GP as primary caregiver and gatekeeper compared with the role of OP/IP as gatekeeper only. Any comparison to previous research is therefore difficult to provide.
However, as this design does not seem to have been performed previously, the generalisability of the results is uncertain. For example, the limited number of participants and the fact that only one region in France was covered may inhibit the generalisability of the study.
It may be argued that a weakness of the study is the fact that the video vignettes did not allow for interaction between the participating physicians and the patients, which may have influenced the appraisals. However, information derived from an appointment with a fixed time is also limited, and in this way the vignettes do not differ significantly from the normal basis for the physicians' decision-making.
For the comparison with physicians in other countries, the videos were translated into their native language by a professional translation bureau. However, there is a small chance that some nuances in the discussions between the patients and physicians were lost in translation. It is also possible that physicians from countries other than Norway were distracted by the subtitles and missed some of the non-verbal communication.
Conclusion
In this study, GPs from Sweden and OPs/IPs from the Netherlands were less likely to grant sick leave to patients with severe SHC compared with GPs from Norway. GPs in Denmark and France were just as likely to grant sick leave as GPs in Norway. We suggest that these variations may reflect differences in attitudes, competencies and practices due to guidelines in Sweden and the Netherlands which do not exist in the other countries. We also suggest that they are related to differences in the settings of the physicians' practices. Differences between the OPs/IPs and the GPs may reflect their specialty training. However, similar patterns in all of the countries' sick-listing decisions call for a broader interpretation of this study. Further research is needed to clarify whether the small but statistically significant differences observed in this study are clinically and economically significant. Further research should also explore which characteristics of patients 2, 6 and 9 caused them to be assessed differently than the other patients by all physicians in this study, given that all nine patients were suffering from SHC.
References
Footnotes
Contributors ELW was responsible for, and involved in, all parts of the study. SLM organised the Dutch part of data collection and was responsible for the analysis. SM was responsible for the Scandinavian part of the study. MJ, JPC and CR were responsible for the French part of the study. KHNW, FS and JRA were responsible for the Dutch part of the study. All authors gathered for a 2-day seminar on the findings and participated in the production of the paper.
Funding The Dutch part of the study was funded by the Norwegian Labour and Welfare Administration through the FARVE program, and the French part by L'Agence Régionale de Santé and La Caisse d'Assurance Maladie de Nantes, France.
Competing interests None declared.
Ethics approval All patients have consented to the use of their original consultation for the purpose of education and research, although anonymity is maintained through the use of professional actors in the vignettes.
Provenance and peer review Not commissioned; externally peer reviewed.
Data sharing statement No additional data are available.