Article Text

Abstract
Objectives Independent epidemiological studies have evaluated the association between markers of glucose metabolism (including fasting glucose, fasting insulin, homeostasis model of risk assessment-insulin resistance (HOMA-IR), glycated haemoglobin (HbA1c) and C peptide) and the risk of colorectal cancer (CRC). However, such associations have not been systematically analysed and no clear conclusions have been drawn. Therefore, we addressed this issue using a meta-analysis approach.
Design Systematic review and meta-analysis.
Data sources PubMed and EMBASE were searched up to May 2015.
Primary and secondary outcome measures Either a fixed-effects or random-effects model was adopted to estimate overall ORs for the association between markers of glucose metabolism and the risk of CRC. In addition, dose–response, meta-regression, subgroup and publication bias analyses were conducted.
Results 35 studies involving 25 566 patients and 5 706 361 participants were included. Higher levels of fasting glucose, fasting insulin, HOMA-IR, HbA1c and C peptide were all significantly associated with increased risk of CRC (fasting glucose, pooled OR=1.12, 95% CI 1.06 to 1.18; fasting insulin, pooled OR=1.42, 95% CI 1.19 to 1.69; HOMA-IR, pooled OR=1.47, 95% CI 1.24 to 1.74; HbA1c, pooled OR=1.22, 95% CI 1.02 to 1.47 (with borderline significance); C peptide, pooled OR=1.27, 95% CI 1.08 to 1.49). Subgroup analysis suggested that a higher HOMA-IR value was significantly associated with CRC risk in all subgroups, including gender, study design and geographic region. For the relative long-term markers, the association was significant for HbA1c in case–control studies, while C peptide was significantly associated with CRC risk in both the male group and colon cancer.
Conclusions The real-time composite index HOMA-IR is a better indicator for CRC risk than are fasting glucose and fasting insulin. The relative long-term markers, HbA1c and C peptide, are also valid predictors for CRC risk. Considering the included case–control studies in the current analysis, more cohort studies are warranted to enhance future analysis.
- fasting glucose
- fasting insulin
- HOMA-IR
- HbA1c
- C-peptide
- colorectal cancer
This is an Open Access article distributed in accordance with the Creative Commons Attribution Non Commercial (CC BY-NC 4.0) license, which permits others to distribute, remix, adapt, build upon this work non-commercially, and license their derivative works on different terms, provided the original work is properly cited and the use is non-commercial. See: http://creativecommons.org/licenses/by-nc/4.0/
Statistics from Altmetric.com
Strengths and limitations of this study
Higher levels of fasting glucose, fasting insulin, homeostasis model of risk assessment-insulin resistance (HOMA-IR), glycated haemoglobin (HbA1c) and C peptide were associated with increased risk of colorectal cancer (CRC). The real-time composite index HOMA-IR is a better indicator for CRC risk than are fasting glucose and fasting insulin.
The number of total participants was substantial, and meta-regression, subgroup analysis and dose–response analyses were applied, which enhanced the statistical power.
The range of the cut-off points between the lowest and the highest categories for fasting glucose, fasting insulin, HOMA-IR, HbA1c and C peptide levels differed between studies, which could influence the outcome of the current analyses.
Introduction
Diabetes mellitus and colorectal cancer (CRC) are both major causes of morbidity and mortality worldwide,1–4 and it has been suggested that there is a statistically significant association between diabetes and increased risk of CRC.5 ,6 The possible mechanisms underlying this association may be related to insulin resistance/hyperinsulinaemia, hyperglycaemia and inflammation.7 ,8 Insulin has pro-proliferative properties, and it can reduce apoptosis and promote the growth of CRC cell lines.9–11 Insulin resistance is a subnormal glycaemic response to endogenous insulin, which commonly precedes hyperinsulinaemia12 and can be quantitatively measured by the homeostasis model of risk assessment-insulin resistance (HOMA-IR) index.13 As a new composite index derived from fasting glucose and fasting insulin concentrations, HOMA-IR is primarily used in large-scale or epidemiological studies in the year 2000,13 although its accuracy is still under debate.
In addition to fasting glucose, fasting insulin and HOMA-IR, other markers of the glucose metabolism have also been used to monitor patients with diabetes. Glycated haemoglobin (HbA1c) is a form of haemoglobin in which a molecule of glucose is attached to its β-chain after exposure to high plasma levels of glucose. As such, it functions as an integrated indicator of average blood glucose concentrations over the period of 6–8 weeks,14 thereby providing a more stable measure of serum glucose as compared with that obtained from a one-time measurement. In addition, C peptide, which is secreted by β cells on an equal molar basis with insulin, has a relatively long half-life in the peripheral circulation,15 providing another valid indicator of insulin production.16
Many independent epidemiological studies have evaluated the association between one or two of the markers mentioned above and the risk of CRC;17–51 however, until now, no study has systematically analysed the association between all these markers and the risk of CRC. Thus, the aim of this study was to provide a quantitative assessment of the association between markers of glucose metabolism, including real-time markers (fasting glucose, fasting insulin and the composite index HOMA-IR) and relative long-term markers (HbA1c and C peptide), and the risk of CRC by a meta-analysis approach and to compare the efficacy of these markers.
Materials and methods
Data sources, search strategy and selection criteria
Systematic literature searches were conducted in PubMed and EMBASE (to May 2015) to identify eligible studies. The following terms were applied: ‘glucose’ OR ‘blood sugar’; ‘insulin’; ‘HOMA’ OR ‘homeostasis model assessment’; ‘c-peptide’ OR ‘c peptide’; ‘hemoglobin’ OR ‘haemoglobin’ OR ‘hematocrystallin’ OR ‘HbA1c’; ‘colon’ OR ‘rectal’ OR ‘colonic’ OR ‘colorectal’; ‘cancer’ OR ‘tumor’ OR ‘carcinoma’ OR ‘neoplasm’ OR ‘adenoma’. References of relevant articles were also scanned for potentially missing studies. Titles and abstracts were first scanned, and then full articles of potentially eligible studies were reviewed. References of relevant articles and reviews were also scanned for potentially missing studies. The retrieved studies were carefully examined to exclude potential duplicates or overlapping data. This meta-analysis was designed, conducted and reported according to PRISMA and MOOSE statements.52 ,53
Articles were included if they met all of the following criteria: (1) case–control or cohort studies evaluated the association between markers of glucose metabolism and the risk of CRC, with the markers including fasting glucose, fasting insulin, HOMA-IR, HbA1c and C peptide; (2) relative risk (RR) or OR estimates and their 95% CIs were given or could be calculated (if only case numbers of different categories were provided, we recalculated the risk ratio by a fourfold table χ2 method) and (3) articles were published as full papers in English. Reviews, letters, editorials, meeting abstracts and case reports were excluded.
Data extraction and quality assessment
Two reviewers (JX and YW) independently collected data using standardised forms and discrepancies were resolved by a third investigator (YY). We extracted the following information from each study: first author, year of publication, origin of the study population, study design (prospective or retrospective), patient characteristics (sample size, age and gender), variables adjusted for in the analysis from each study, and the reported RR (OR) with 95% CIs for the highest versus lowest categories of markers of glucose metabolism. HOMA-IR was derived as fasting glucose (mmol/L)×fasting insulin (mIU/L)/22.5, as described by Matthews et al.54
The quality of each study was assessed according to the Newcastle-Ottawa quality assessment.55
Data synthesis and statistical analysis
Either a fixed-effect or random-effect model was adopted to pool the study-specific RRs (ORs), according to the extent of heterogeneity. A random-effect model56 was used when the heterogeneity was significant (p≤0.10 and/or I2>50%). Otherwise, a fixed-effect model was applied.57 The significance of the pooled RR was determined by Z test (p<0.05 was considered to be significant). The χ2 and I2 test58 were used to assess the heterogeneity across studies. Meta-regression59 and subgroup analyses were applied to evaluate the potential effect of modification of variables, including cancer subtype, gender, geographic region and study design. Funnel plots were constructed60 and Begg's and Egger's tests were performed to assess the publication bias (p≤0.10 was considered to be significant). Egger’s method had stronger statistical power than Begg’s method.61 Please find the detailed information in the online supplementary methods part.
We analysed the dose–response relationship using linear, first-order and second-order fractional polynomial regression of the inverse variance-weighted data to estimate a curve of best fit. Best-fit curves were selected using decreased deviance compared with the reference model.62 The units of fasting glucose, fasting insulin, HbA1c and C peptide were standardised as ‘mg/dL’, ‘uIU/mL’, ‘%’ and ‘ng/mL’, respectively. Comparisons of curves to determine the best fit were done using a χ2 distribution. All analyses were conducted using Stata software (V.12.0; StatCorp, College Station, Texas, USA).
supplementary data
Results
Study characteristics and data quality
After searching PubMed and EMBASE, 9648 articles were identified. Of these, 2453 duplicate papers were removed, leaving 7195 articles for assessment. A review of titles and abstracts resulted in the exclusion of 6901 articles. Of the remaining 294 articles, 259 were excluded for the following reasons: insufficient data (n=115); not on the right topic or targeted population (n=137); not an original article (n=5); and duplicate data (n=2).
The remaining 35 studies,17–51 which provided data on 25 566 patients and 5 706 361 participants, were included in this meta-analysis. The selection process is shown in figure 1, and the characteristics of the included studies are shown in online supplementary table S1. Among the included studies, 18 examined fasting glucose levels,17 ,19 ,26 ,29–31 ,34 ,36 ,37 ,39 ,40 ,44–47 ,49–51 10 examined fasting insulin levels,19 ,21 ,30 ,34 ,39 ,42–44 ,47 ,49 8 examined HOMA-IR values,30 ,34 ,39 ,42 ,44 ,47–49 8 examined HbA1c levels,18 ,22 ,23 ,27 ,28 ,35 ,36 ,47 and 9 examined C peptide levels.20 ,24 ,25 ,28 ,32 ,33 ,36 ,38 ,41 The results of our quality assessment are shown in online supplementary tables S2 and S3. The PRISMA checklist and flow diagram are shown in online supplementary table S4.

Flow diagram of study selection process.
Association between fasting glucose, fasting insulin, HOMA-IR and the risk of CRC
Fasting glucose and CRC: A total of 18 studies involving 17 764 patients and 3 805 861 participants assessed the association between fasting glucose levels and the risk of CRC. The pooled OR of CRC risk for the highest versus lowest categories of fasting glucose level was 1.12 (95% CI 1.06 to 1.18; p<0.001), indicating a significantly positive association (figure 2A). There was moderate heterogeneity among the included studies (I2=45.4%, p=0.007), as shown in figure 2A. The results of the dose–response analysis indicated a positive correlation between fasting glucose levels and the risk of CRC, as shown in figure 3A.

The association between real-time markers of glucose metabolism and the risk of CRC. Pooled ORs of CRC for the highest versus lowest categories of (A) fasting glucose level; (B) fasting insulin level and (C) HOMA-IR value. A, advanced cancer; CC, colon cancer; CRC, colorectal cancer; E, early cancer; F, female; HOMA-IR, homeostasis model of risk assessment-insulin resistance; M, male; RC, rectal cancer; RR, relative risk.
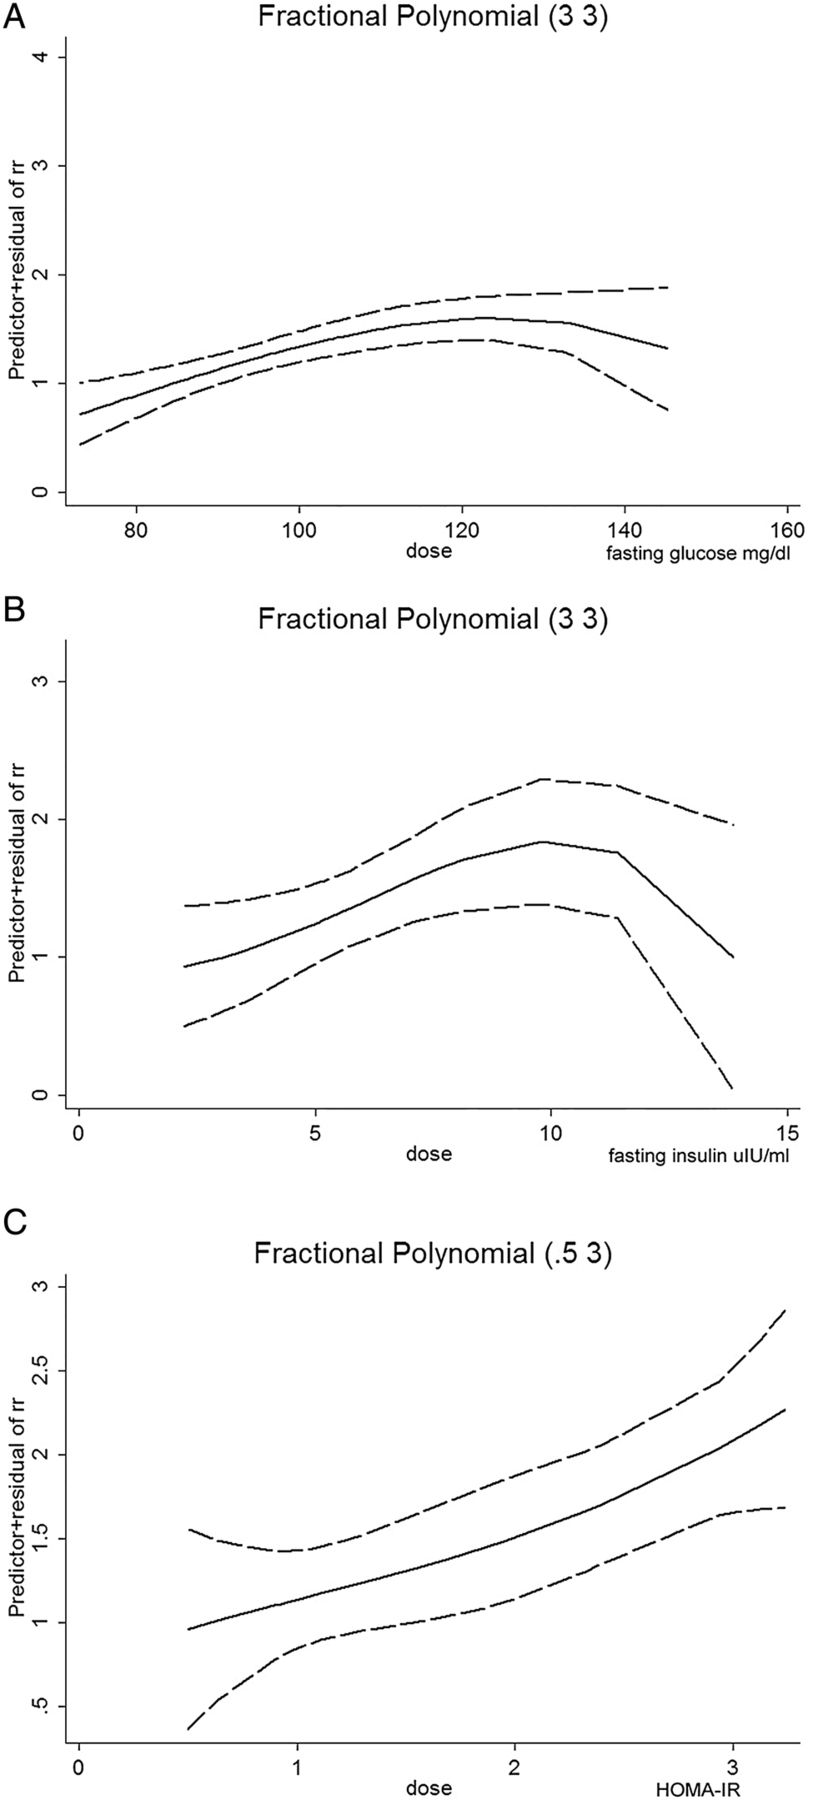
Dose–response relationship between real-time markers of glucose metabolism and the risk of CRC. Dose–response relationship between (A) fasting glucose level and the risk of CRC; (B) fasting insulin level and the risk of CRC and (C) HOMA-IR value and the risk of CRC. The solid line represents the pooled RRs, and the dotted line represents the 95% CIs of the RRs. CRC, colorectal cancer; HOMA-IR, homeostasis model of risk assessment-insulin resistance; RR, relative risk.
Subgroup analyses were conducted according to gender, geographic region, study design and cancer subtype, as shown in table 1. The pooled RR of CRC for the highest versus lowest categories of fasting glucose level was 1.13 (95% CI 1.04 to 1.22) in males and 1.07 (95% CI 0.97 to 1.19) in females, suggesting that the fasting glucose level was significantly associated with CRC risk in males but not in females. For study design, the fasting glucose level was found to be statistically associated with the risk of CRC in both case–control (pooled RR=1.22, 95% CI 1.02 to 1.46) and cohort (pooled RR=1.11, 95% CI 1.05 to 1.17) studies. When stratifying the studies according to geographic region, fasting glucose level was found to be significantly associated with CRC risk in the American and European (pooled RR=1.09, 95% CI 1.03 to 1.16) and Asian (pooled RR=1.20, 95% CI 1.08 to 1.34) populations. For CRC subtypes, the fasting glucose level was found to be significantly associated with colon cancer (pooled RR=1.08, 95% CI 1.01 to 1.16) but not rectal cancer (pooled RR=1.07, 95% CI 0.97 to 1.17). Meta-regression and subgroup analyses suggested that heterogeneity was partly influenced by study design, geographic region and cancer subtypes (table 1).
Meta-regression and subgroup analysis between markers of glucose metabolism and risk of CRC
Fasting insulin and CRC: 10 studies involving 3239 patients with CRC and 354 870 participants assessed the association between fasting insulin level and the risk of CRC. Compared with the lowest categories of fasting insulin level, the pooled OR of CRC was 1.42 (95% CI 1.19 to 1.69; p<0.001) for the highest categories (figure 2B), indicating a significantly positive association. There was no significant heterogeneity across the included studies (I2=0.0%, p=0.571), as shown in figure 2B. The results of the dose–response analysis indicated a positive correlation between fasting insulin levels and the risk of CRC, which was an inverted U-shaped relationship (figure 3B).
Meta-regression and subgroup analysis (table 1) showed that the fasting insulin level was not significantly associated with CRC risk in either males (pooled RR=1.67, 95% CI 0.92 to 3.05) or females (pooled RR=1.53, 95% CI 0.92 to 2.55). For design types, fasting insulin level was found to be significantly associated with the risk of CRC in case–control (pooled RR=1.45, 95% CI 1.18 to 1.78) studies but not in cohort (pooled RR=1.32, 95% CI 0.92 to 1.89) studies. When stratifying the studies according to geographic region, the fasting insulin level was found to be significantly associated with CRC risk in American and European (pooled RR=1.41, 95% CI 1.17 to 1.69) but not Asian (pooled RR=1.53, 95% CI 0.73 to 3.20) populations.
HOMA-IR and CRC: Eight studies involving 2956 patients and 347 326 participants assessed the association between HOMA-IR and the risk of CRC. As compared with cancer risk for those with the lowest categories of HOMA-IR values, the pooled OR of CRC was 1.47 (95% CI 1.24 to 1.74; p<0.001) for those in the highest categories (figure 2C), indicating a significantly positive association. There was no significant heterogeneity across the included studies (I2=31.2%, p=0.169), as shown in figure 2C. The results of the dose–response analysis indicated a positive correlation between HOMA-IR value and the risk of CRC (figure 3C).
The meta-regression and subgroup analysis (table 1) showed that the HOMA-IR value was significantly associated with CRC risk in each subgroup for which it was calculated. Specifically, the HOMA-IR value was significantly associated with the risk of CRC in males (pooled RR=1.99, 95% CI 1.13 to 3.50) and females (pooled RR=1.71, 95% CI 1.26 to 2.32); in case–control (pooled RR=1.39, 95% CI 1.17 to 1.66) studies; and in American and European (pooled RR=1.43, 95% CI 1.21 to 1.70) and Asian (pooled RR=2.30, 95% CI 1.12 to 4.27) populations. These results indicated that as a composite index of fasting glucose and fasting insulin, HOMA-IR was a more reliable biomarker to evaluate the risk of CRC incidence than either of the individual biomarkers.
Association between HbA1c level and the risk of CRC
Eight studies including 2137 patients and 820 317 participants assessed the association between HbA1c levels and the risk of CRC. The pooled RR of CRC for the highest versus lowest categories of HbA1c level was 1.22 (95% CI 1.02 to 1.47; p=0.030), suggesting that the HbA1c level was associated with the risk of CRC with borderline significance (figure 4A). There was no significant heterogeneity across the included studies (I2=24.8%, p=0.232), as shown in figure 4A. The results of the dose–response analysis indicated a U-shaped relationship between HbA1c levels and the risk of CRC, as shown in figure 5A.

The association between relative long-term markers of glucose metabolism and the risk of CRC. Pooled ORs of CRC for the highest versus lowest categories of (A) HbA1c level and (B) C peptide level. CC, colon cancer; CRC, colorectal cancer; F, female; HbA1c, glycated haemoglobin; M, male; RC, rectal cancer; RR, relative risk.

Dose–response relationship between long-term markers of glucose metabolism and the risk of CRC. Dose–response relationship between (A) HbA1c level and the risk of CRC and (B) C peptide level and the risk of CRC. The solid line represents the pooled RRs, and the dotted line represents the 95% CIs of the RRs. CRC, colorectal cancer; HbA1c, glycated haemoglobin; RR, relative risk.
Through a meta-regression and subgroup analysis (table 1), we found that the HbA1c level was not significantly associated with CRC risk in either males (pooled RR=1.97, 95% CI 0.54 to 7.21) and females (pooled RR=1.03, 95% CI 0.78 to 1.35). For study design subgroups, the HbA1c level was associated with CRC risk in case–control (pooled RR=1.23, 95% CI 1.00 to 1.52) studies with borderline significance but not in cohort (pooled RR=1.53, 95% CI 0.68 to 3.43) studies. For CRC subtypes, HbA1c level was not significantly associated with colon cancer (pooled RR=1.18, 95% CI 0.93 to 1.52) or rectal cancer (pooled RR=1.19, 95% CI 0.79 to 1.80).
Association between C peptide level and the risk of CRC
Nine studies involving 3191 patients and 1 375 980 participants assessed the association between C peptide level and the risk of CRC. The pooled RR of CRC for the highest versus lowest categories of C peptide level was 1.27 (95% CI 1.08 to 1.49; p=0.004), suggesting that the C peptide level was statistically associated with the risk of CRC (figure 4B). There was moderate heterogeneity across the included studies (I2=48.0%, p=0.037), as shown in figure 4B. The results of the dose–response analysis indicated a U-shaped relationship between C peptide levels and the risk of CRC, as shown in figure 5B.
The meta-regression and subgroup analysis (table 1) showed that C peptide level was significantly associated with CRC risk in males (pooled RR=1.52, 95% CI 1.21 to 1.92), but not in females (pooled RR=1.34, 95% CI 0.67 to 2.70). For cancer subtypes, C peptide level was significantly associated with colon cancer (pooled RR=1.68, 95% CI 1.32 to 2.12) but not rectal cancer (pooled RR=0.85, 95% CI 0.44 to 1.67). For geographic region, C peptide level was significantly associated with CRC in American and European (pooled RR=1.32, 95% CI 1.10 to 1.59) but not Asian (pooled RR=1.27, 95% CI 0.63 to 2.58) populations.
Publication bias
The PBegg and PEgger for fasting glucose were 0.012 and 0.004, respectively, which indicated significant publication bias, while there was no publication bias for fasting insulin (PBegg=0.876 and PEgger=0.698), HOMA-IR (PBegg=0.466 and PEgger=0.151), HbA1c (PBegg=0.386 and PEgger=0.508) and C peptide (PBegg=0.213 and PEgger=0.539). The funnel plots were shown in the online supplementary figures S1–S5.
We conducted further bias analysis according to the study design for fasting glucose. The publication bias results of cohort studies were PBegg=0.387 and PEgger=0.110, and the results of case–control studies were PBegg=0.009 and PEgger=0.001, which indicated that the main publication bias was from case–control studies.
supplementary figures
supplementary table
Discussion
Impaired glucose metabolism is one of the most common lifestyle-related disorders and has been linked to various chronic diseases including CRC.45 Therefore, the relationship between diabetes and the risk of CRC is biologically plausible.5 The current meta-analysis summarised the data from 35 studies on this topic that evaluated the association between markers of glucose metabolism and CRC risk in 25 566 patients and 5 706 361 participants. The results obtained indicated that the real-time composite index HOMA-IR has a stronger association with CRC risk than does fasting glucose or fasting insulin. Furthermore, HbA1c and C peptide, the relative long-term markers, were also valid predictors of CRC risk. Therefore, HOMA-IR levels may be a potential marker of CRC and early detection and intervention for controlling elevated glucose levels may be indicated as a way to prevent carcinogenesis.
Hyperglycaemia and circulating insulin concentration have been evaluated as potential CRC risk factors by many epidemiological studies. HOMA-IR is derived from paired serum insulin and glucose values, and this composite index may serve as an early indicator for evolving hyperinsulinaemia and/or hyperglycaemia.30 Meta-regression and subgroup analyses suggested that HOMA-IR was significantly associated with CRC risk in every subgroup that could be calculated, including gender, study designs and geographic region. This characteristic reflects the stability of the index and it may be appropriate for people from different countries to detect CRC occurrence. In contrast, fasting glucose was positively associated with risk of CRC in males, both in the case–control and cohort subgroups, in American and European and Asian populations and in colon cancer, while fasting insulin was only positively associated with the risk of CRC in case–control cohort studies and in American and European populations. Taken together, such results suggested that HOMA-IR is a more reliable composite index than the individual measurements with which to evaluate the association with CRC incidence. This conclusion was further strengthened by the dose–response analysis. Thus, it is recommended that HOMA-IR can be used as a biomarker for CRC risk in a clinical setting.
HbA1c is an integrated indicator of average blood glucose concentrations over a period of 6–8 weeks,14 which provides a more stable assessment as compared with serum glucose. In addition, C peptide has a relatively long half-life in the peripheral circulation and thus may also provide a more accurate assessment of overall insulin exposure.15 For these two relatively long-term markers of glucose metabolism, the pooled RRs for HbA1c and C peptide were 1.22 (95% CI 1.02 to 1.47; p=0.030) and 1.27 (95% CI 1.08 to 1.49; p=0.004), respectively. These results were consistent with those from real-time makers. Meta-regression and subgroup analysis showed that HbA1c was positively associated with the risk of CRC in case–control studies, while C peptide was significantly associated with CRC risk in males but not females, and in the colon cancer but not rectal cancer subgroup. The dose–response analyses also indicated positive correlations between these two markers and the risk of CRC.
Several pathophysiological and molecular mechanisms underlie the association between markers of glucose metabolism and colorectal carcinogenesis. Insulin resistance/hyperinsulinaemia and hyperglycaemia may induce colorectal carcinogenesis via inflammatory, oxidative stress and proliferative pathways,7 ,63 as shown in online supplementary figure S6.
Hyperglycaemia is the most prominent clinical symptom of diabetes. The interaction of hyperglycaemia-associated advanced glycation end products (AGEs) with their receptors leads to oxidative stress and inflammation.64 As a consequence, the inflammatory cytokines released, such as interleukin 6 and tumour necrosis factor-α, and transcription factors activated, including nuclear factor-κB and the signal transducer and activator of transcription (STAT) 3, all have the potential to promote colorectal carcinogenesis.65 ,66 In addition, inflammation-induced reactive oxygen species can damage cellular components such as DNA, proteins and lipids, all of which can directly or indirectly contribute to malignant cell transformation.65 ,67 Some novel regulators of gene expression, such as microRNAs, may also be involved in this process. For example, hyperglycaemia may cause endothelial dysfunction and angiogenesis in tumours by upregulating microRNA-467, resulting in tumour neoangiogenesis and malignant growth.68
Insulin exerts both metabolic and mitogenic effects through its interactions with the insulin receptor and the cognate type 1 insulin-like growth factor receptor (IGF-1R).69 The metabolic processes and glucose uptake functions of insulin proceed primarily through the PI3K/Akt pathway, while the mitogenic activity of insulin occurs primarily via the mitogen-activated protein kinases (MAPK) pathway.70 Insulin resistance and the consequently compensatory hyperinsulinaemia affect the metabolic pathways, overstimulate the mitogenic pathway and activate IGF-1R.71 Insulin-induced oncogenic activities include the activation of pathways involving multiple neoplastic protein kinases, including MAPK, extracellular signal-regulated kinase (ERK), PI3K/Akt and the mammalian target of rapamycin (mTOR), etc.72 In addition, insulin and IGF-1 can also activate Ras, which can then activate the mTOR and Wnt signalling pathway,73 ,74 leading to the increased sensitivity of colon cells to growth factors and accelerated progression from adenoma to carcinoma.72 As a result, the IGF-hyperinsulinaemia theory suggests that elevated insulin and free IGF-1 regulate metabolism and stimulate cellular growth and proliferation, reduce apoptosis and increase vascular endothelial growth factor levels as they do to CRC cell lines in vitro,75 ,76 thereby leading to a survival benefit and promoting colorectal carcinogenesis.72 ,77 Another possible molecular mechanism for the connection between insulin levels and CRC risk involves the hormone glucagon-like peptide 1 receptor (GLP-1), which is secreted by the intestinal endocrine L cells. Owing to insulin resistance, reduction of GLP-1 secretion causes compensatory activation of the Wnt pathway in combination with increased expression of oncogenes, such as c-Myc and cyclin D1, resulting in intestinal cell proliferation and CRC development.78
Determining the sources of heterogeneity is an important goal of meta-analysis. Meta-regression and subgroup analyses suggested that gender, study design, geographic region and cancer subtype can partially explain heterogeneity across the studies. However, for each study, only the median, midpoint or mean level of fasting glucose, fasting insulin, HOMA-IR, C peptide and HbA1c were obtained, and the related individual data were not available. Thus, a future individual participant data meta-analysis might help to further address this problem. The cut-off value and sample size of different studies and between different subgroups may also contribute to the heterogeneity. For example, in the subgroup analysis, the sample size for fasting glucose and C peptide in males was larger than in females, but it was the opposite for fasting insulin, HbA1c and HOMA-IR. The subgroup analysis results suggested that the gender difference was observed for fasting glucose and C peptide, while it was significant for HOMA-IR in men and women. Thus, the combined index HOMA-IR may be more stable than the individual markers, which further supported our conclusion.
Our study has several strengths. First, we adopted real-time markers (fasting glucose and fasting insulin), the composite marker (HOMA-IR) and long-term markers (HbA1c and C peptide) of glucose metabolism to thoroughly assess the association between markers of glucose metabolism with the risk of CRC. Second, the number of total participants was substantial, which enhanced the statistical power. Third, meta-regression, subgroup analysis and dose–response analyses were applied, which further strengthened the conclusions.
This study also has some limitations. For instance, the range of the cut-off points between the lowest and highest categories for fasting glucose, fasting insulin, HOMA-IR, HbA1c and C peptide levels differed between studies, which could influence the outcome of the current analyses. Besides, most of the included studies were case–control studies, which rely on recall for exposure measurement and are thus prone to bias. Thus, the inclusion of additional cohort studies has the potential to enhance future analysis. In addition, publication bias was observed in the fasting glucose analysis and it was caused by case–control studies. Thus, more cohort studies are warranted to enhance future analysis.
In conclusion, our findings demonstrate conclusively that markers of glucose metabolism are quantitatively associated with the risk of CRC. Furthermore, the real-time composite index HOMA-IR is more strongly associated with CRC risk than are either of the two individual markers (fasting glucose and fasting insulin). Considering the included case–control studies in the current analysis, more cohort studies are warranted to enhance future analysis.
References
Footnotes
JX and YY contributed equally.
Contributors YW and DX contributed to the conception and design of the study. JX and YY contributed to the conception, design and editing of the manuscript. HW and HZ contributed to the statistical analysis. PL and JY contributed to the data acquisition, analysis and interpretation of the data. JH and PD-H contributed to the conception, design and editing of the manuscript.
Funding This research received no specific grant from any funding agency in the public, commercial or not-for-profit sectors.
Competing interests None declared.
Provenance and peer review Not commissioned; externally peer reviewed.
Data sharing statement No additional data are available.