Article Text

Abstract
Objectives To investigate the impact of increasing sample of records reviewed bi-weekly with the Global Trigger Tool method to identify adverse events in hospitalised patients.
Design Retrospective observational study.
Setting A Norwegian 524-bed general hospital trust.
Participants 1920 medical records selected from 1 January to 31 December 2010.
Primary outcomes Rate, type and severity of adverse events identified in two different samples sizes of records selected as 10 and 70 records, bi-weekly.
Results In the large sample, 1.45 (95% CI 1.07 to 1.97) times more adverse events per 1000 patient days (39.3 adverse events/1000 patient days) were identified than in the small sample (27.2 adverse events/1000 patient days). Hospital-acquired infections were the most common category of adverse events in both the samples, and the distributions of the other categories of adverse events did not differ significantly between the samples. The distribution of severity level of adverse events did not differ between the samples.
Conclusions The findings suggest that while the distribution of categories and severity are not dependent on the sample size, the rate of adverse events is. Further studies are needed to conclude if the optimal sample size may need to be adjusted based on the hospital size in order to detect a more accurate rate of adverse events.
- QUALITATIVE RESEARCH
- Global Trigger Tool
- Sample size
This is an Open Access article distributed in accordance with the Creative Commons Attribution Non Commercial (CC BY-NC 4.0) license, which permits others to distribute, remix, adapt, build upon this work non-commercially, and license their derivative works on different terms, provided the original work is properly cited and the use is non-commercial. See: http://creativecommons.org/licenses/by-nc/4.0/
Statistics from Altmetric.com
Strengths and limitations of this study
The samples were similar in terms of age, sex and length of stay.
Preventability of the adverse events was not assessed.
Only two sample sizes were compared.
Method for authentication of events differed slightly for each set of samples, however, high inter-rater reliability between the review teams indicates consistency and thus did not likely affect the results.
Introduction
For more than a decade, considerable efforts have been invested across healthcare to reduce adverse events, resulting in many efforts to identify reliable and valid tools to measure such events. The Institute for Healthcare Improvement (IHI) Global Trigger Tool is a widely used and considered an effective tool for measuring adverse events.1–3 The method includes reviewing bi-weekly samples of 10 patient records selected randomly from the hospital discharge lists. Two non-physician reviewers search independently for predefined triggers that could indicate possible adverse events. A physician authenticates their consensus on the presence of adverse events and severity. The adverse events identified in the bi-weekly periods provide data for Statistical Process Control (SPC) charts used to analyse adverse events rates over time. However, concerns have been raised2 ,4–8 about the method's ability to accurately detect rates of adverse events and changes in rates, due to the small sample size of 10 records bi-weekly recommended in the IHI method.
In Norway, all hospital trusts are required by the National Health Authority to use a translated version of the Global Trigger Tool to review a minimum of 10 records selected continuously and bi-weekly in order to monitor the rates of adverse events in each hospital trust and at a national level.9 Good et al10 suggest that sample size should be adjusted to hospital size and based on this, we increased the sample size at our trust to seven times greater than that required by the Health Authority, as we believed this would detect a more accurate rate of adverse events. Our rates of adverse events have been higher than other comparable trusts that are reviewing bi-weekly samples of 10 records, thus we sought to assess whether our higher rates were due to the larger sample size. The impact of sample size on adverse event rates has not been validated to our knowledge, thus demonstrating the need for this study.
Our aim was to obtain the rate, category and severity of the identified adverse events in two different sample sizes of records selected from the same population bi-weekly: one sample corresponding to the IHI recommendation and one sample seven times larger. We hypothesised that increasing the sample size would not yield a different rate of adverse events per 1000 patient days.
Methods
Study design
The study is an observational cross-sectional study including retrospective record review of two samples of records, 1680 and 240, respectively (figure 1).
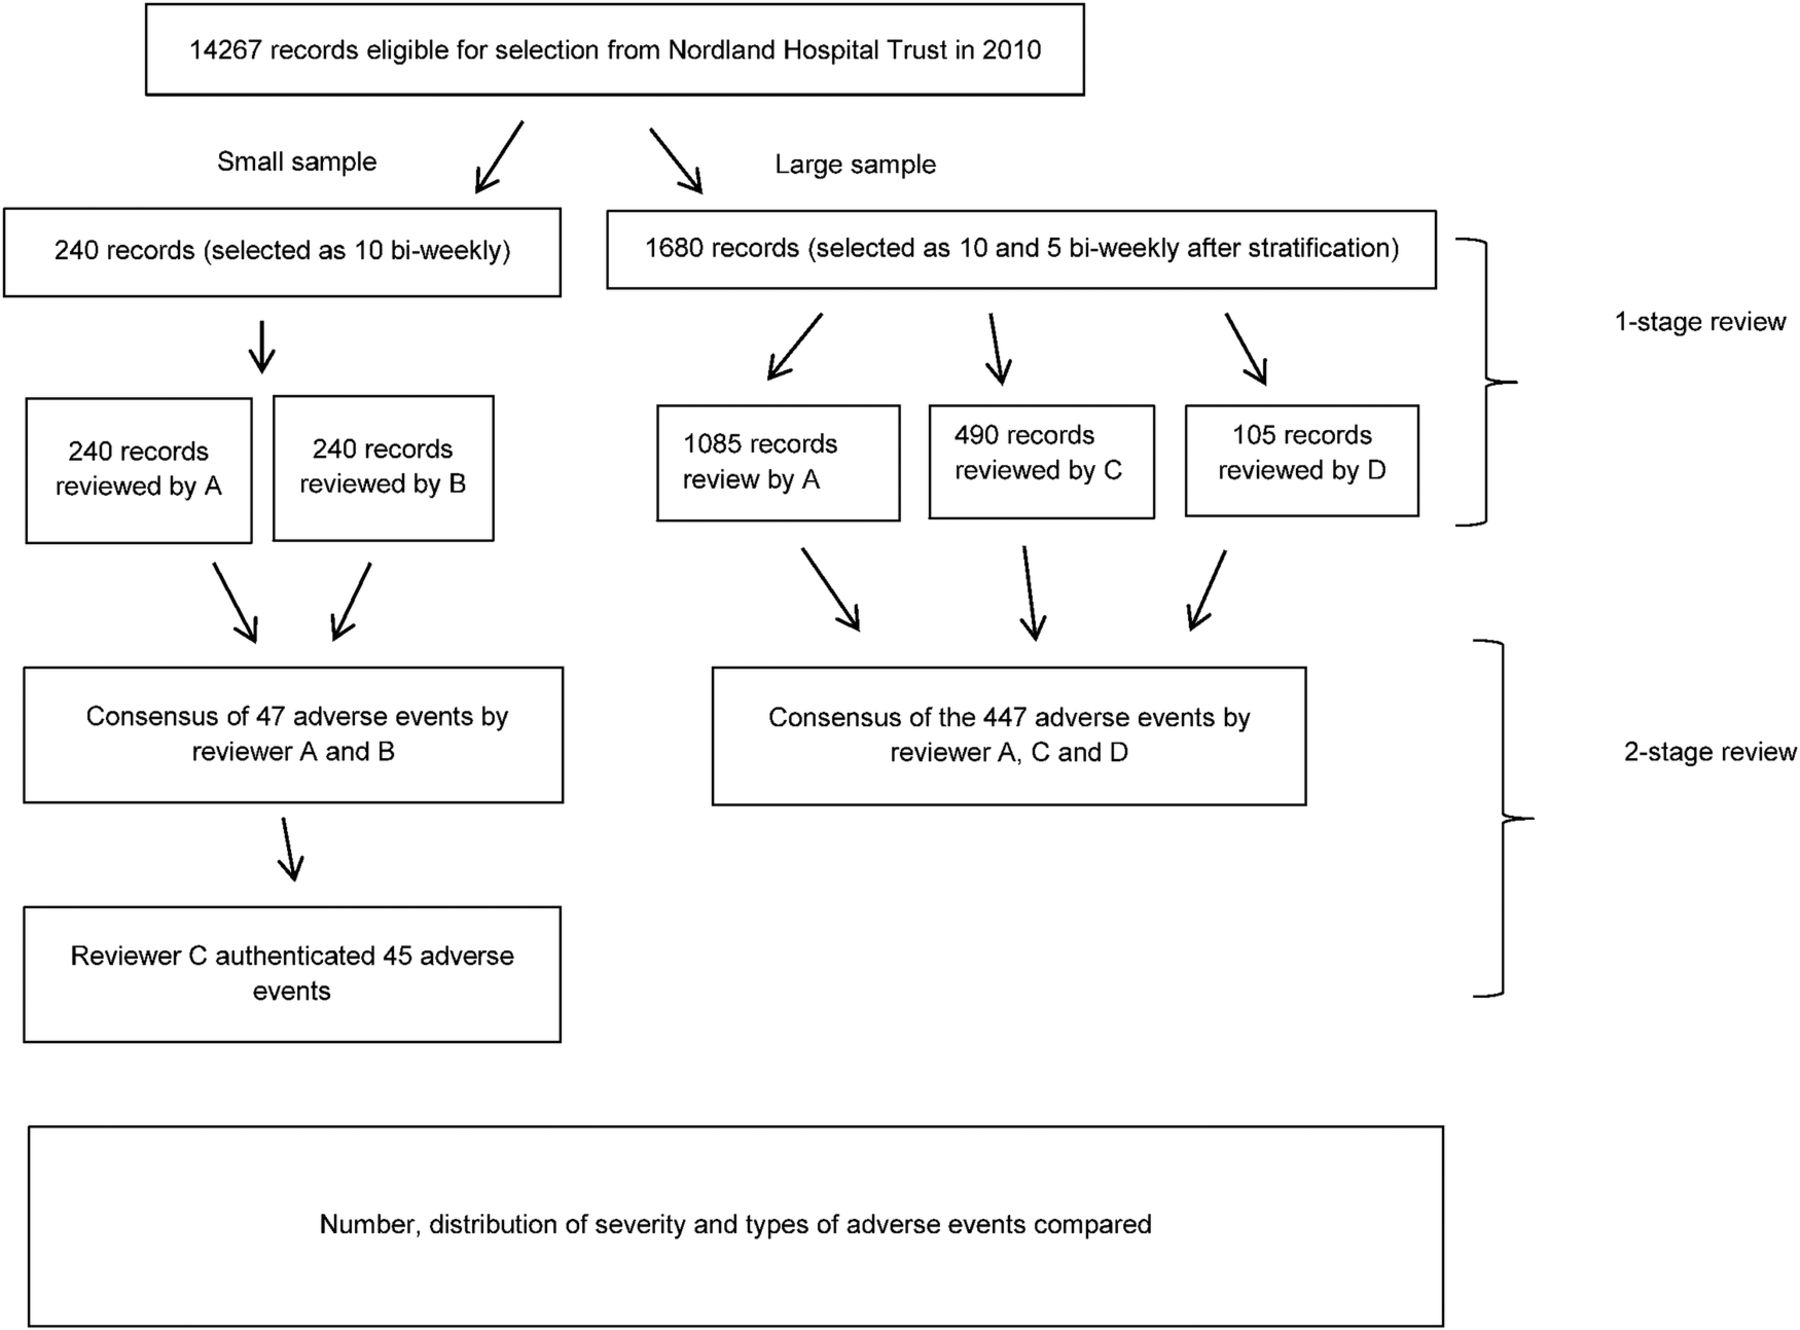
Overview of the study design. Non-physician reviewers; reviewer A and B, physician reviewers; reviewer C and D.
Setting
The study was performed in a 524-bed hospital trust at three geographical locations in Nordland County, North-Norway. Both the samples were selected from the same population discharged from 1 January to 31 December 2010. However, the large sample was first stratified according to discharges from the nine services in the trust and then 10 records were selected from 5 services and 5 records from 4 services, respectively, for a total of 70 records bi-weekly. The small sample included 10 records selected bi-weekly from the aggregated discharge lists of all the 9 services. Following the IHI guidelines, records were excluded in both samples for patients aged 17 years or younger, patients admitted primarily for psychiatric or rehabilitation care, or patients with a length of stay less than 24 h. The whole hospitalisation was reviewed including patient days at all services not only at the index service.
The study was approved by the data protection official in Nordland Hospital trust and by the Norwegian Regional Ethics Committee (ref 2012/1691).
Record review method
Training of the reviewers followed the IHI recommendations and included theory, practical review exercises, and debriefing sessions provided by experienced reviewers. The IHI definition of an adverse event was used, that is1: ‘Unintended physical injury resulting from or contributed to by medical care that requires additional monitoring, treatment or hospitalisation, or that results in death’. Both adverse events associated with treatment given prior, during or after (within 30 days) to the index discharge (the discharge selected from the discharge lists of the services) were included to evaluate the total number of adverse events resulting from medical care. Preventability of the identified adverse events was not evaluated.
The identified adverse events were grouped into 23 categories derived from the Norwegian translation11 of the IHI Global Trigger Tool. These categories were further aggregated into eight main categories (ie, hospital-acquired infections, surgical complications, bleeding/thrombosis, patient fall/fracture, medication harm, obstetric harm, pressure ulcer and other). The severity of adverse events was categorised into five levels (E–I) using definitions adapted from those of the National Coordinating Council for Medication Error Reporting and Prevention Index (NCC MERP):12
Category E: Temporary harm to the patient and required intervention
Category F: Temporary harm to the patient and required initial or prolonged hospitalisation
Category G: Permanent patient harm
Category H: Intervention required to sustain life
Category I: Patient death
The review process for both sets of samples followed the IHI method,1 where reviewers checked each record for the presence of triggers from a standard list of triggers in the Norwegian translation of the Global Trigger Tool. When a trigger was identified, they checked for documentation indicating that an adverse event had occurred; for any adverse event detected, whether by a trigger or not, one of the above eight categories and a severity level was assigned. The process for authentication of adverse events differed slightly between the two sets of samples. For the small samples, two nurses (reviewer A and reviewer B) reviewed all records independently and then together reached consensus on presence, category and severity of adverse events. A physician (reviewer C) then authenticated their findings. The reviewing process of authentication with records from the large samples was slightly different in that each record was reviewed by one reviewer—either a nurse (reviewer A) or one of two physicians (reviewers C and D). The three reviewers discussed their findings and reached consensus of presence, category and severity of adverse events identified (figure 1). The modification with only one reviewer per record in the reviewing process for the large samples was due to limited resources available.
Statistical analysis
Demographic variables of the records were obtained. Categorical variables were compared between the samples with χ2 test while continuous variables were compared using the independent t test.
SPC charts are used to evaluate variations between data points over time, which is a recommended approach for evaluating the rates of adverse events measured by the Global Trigger Tool.1 ,13 We used QI Macros in Excel 2013 to present the calculated rate of adverse events per 1000 patient days in U-charts and the calculated percentage of records with adverse events in a P-chart of both samples.14 Test 1–3 of special cause variation (SCV) were applied in order to evaluate the rates. The tests are positive if data points are outside the control limits, eight or more data points are on the same side of the median or/and if six data points are either ascending or descending. We hypothesised that different rates of adverse events in the two samples would yield different results in terms of the tests and control limits.
To compare the calculated rates, proportions of severities and categories of adverse events between the samples, we used Poisson regression in generalised linear models to calculate the relative risk of adverse events between the samples as the risk ratio (RR). Poisson regression was chosen as it accounts for variations in the number of cases reviewed and variations in the length of stay. The number of adverse events was set as the dependent variable and log patient days as the offset variable (in the analysis of adverse events per patient day). When analysing adverse events per records and percentages of records with an adverse event, zero was set as the fixed value. A p value of <0.05 was defined as statistically significant. We also adjusted for services and variables associated with the index service. Associations between adverse events and demographic variables were explored using Pearson′s correlation and logistic regression. To assess the inter-rater reliability between the review teams of the two samples, we used κ and weighted κ statistics. The following interpretations from Landis and Koch was used for the Cohen κ coefficient: poor (<0.0), slight (0.00–0.20), fair (0.21–0.40), moderate (0.41–0.60), substantial (0.61–0.80) and almost perfect (0.81–1.00).15 We used SPSS (V.22.0; SPSS Chicago, Illinois, USA) for statistical analyses.
Results
Demographics characteristics
A total of 1920 records were reviewed in the study using the Global Trigger Tool. Demographic characteristics in the samples and the overall population from which the samples were drawn from are shown in table 1. A total of 12% of the overall population (14 267 discharges) was reviewed in the large samples, while 2% was reviewed in the small sample. Length of stay, age and sex were derived for the whole hospitalisation and these did not differ between the large and the small sample. Patients in the large sample were different to the overall population in terms of sex and length of stay while patients in the small sample did not differ from the overall population. Type of admissions (acute or planned), case mix (discharge diagnose), services (functional units), case mix index, admission to surgery and numbers of transfers were derived from the index discharge (source of the random selection) and adjusted for.
Demographic characteristics of the two samples and the overall population
Comparison of adverse events
In the large sample of 1680 records comprising 11 367 patient days, we identified 447 adverse events in 347 discharges. This corresponds to a rate of 39.3 adverse events per 1000 patient days (95% CI 35.8 to 43.1, SE=1.86) or 26.6 adverse events per 100 discharges (95% CI 24.3 to 29.2, SE=1.26). The percentage of patients with an adverse event was 20.5% in the large sample. In the small sample of 240 records comprising 1657 patient days, we identified 45 adverse events in 30 discharges. This corresponds to a rate of 27.2 adverse events per 1000 patient days (95% CI 20.3 to 36.4, SE=4.05) or 18.8 adverse events per 100 discharges (95% CI 14.0 to 25.1, SE=2.80). The percentage of patients experiencing an adverse event was 12.5%. Some patients experienced more than one adverse event. Patients experiencing adverse events had longer hospital stays (large sample r²=0.21, p<0.001 and small sample r²=0.46, p<0.001) than patients without experiencing adverse events. In the large sample age correlated (r²=0.03, p<0.001) with number of adverse events, while in the small sample age did not correlate with number of adverse events (r²=−0.003, p=0.54).
The rate of adverse events per 1000 patient days was 45% higher in the large sample than in the small sample (RR=1.45, 95% CI 1.07 to 1.97; p=0.02). Likewise, the rate of adverse events per record was 42% higher in the large sample than in the small sample (RR=1.42, 95% CI 1.04 to 1.93, p=0.03). The percentage of records including an adverse event was 65% higher in the large sample than in the small sample (RR=1.65, 95% CI 1.14 to 2.34, p=0.008). In figure 2, the rates of adverse events per 1000 patient days in both samples are presented in control U-charts and percentages of records with adverse events in control P-charts over the 24 bi-weekly periods in 2010. In both charts, the control limits are much wider in the small sample than in the large sample. SCVs (positivity of tests 1) were identified only for the small sample. This is marked with a black dot in the U-chart. None of the other tests were positive for either of the samples.

Comparison of statistical process control charts (U-chart) and (P-chart) between large and small samples. Dashed line = upper control limits; dotted line = lower control limits.
To adjust for the stratification made before selection of records to the large sample, we adjusted for the variables that were associated from the index discharge. The primary results did not alter as the RR was 1.83 (95% CI 1.32 to 2.54, p<0.001) of identifying an adverse event per 1000 patient days in the large sample compared with the small sample when adjusting for these variables.
The inter-rater reliability of the two teams that reviewed the different sets of samples was obtained to assess for possible impact from the different authentication processes. The two review teams reviewed a set of 50 patient records, and agreement regarding the presence of adverse events (κ =0.75), number of adverse events (κ=0.68) and severity level (κ=0.69) was substantial.
Hospital-acquired infections were the most frequent category of identified adverse events in both samples. There were no significant differences between the estimated proportions of identified adverse events between the samples for the six main categories of adverse events; hospital-acquired infections (RR=1.52, 95% CI 0.94 to 2.47, p=0.09), surgical complications (RR=1.28, 95% CI 0.67 to 2.47, p=0.46), bleeding/thrombosis (RR=1.44, 95% CI 0.70 to 2.98, p=0.33), medication harm (RR=1.68, 95% CI 0.60 to 4.66, p=0.32), patient fall (RR=0.83, 95% CI 0.24 to 2.82, p=0.76) and pressure ulcers (RR=0.73, 95% CI 0.16 to 3.33, p=0.68) (see online supplementary file 1). For the categories obstetric harm and other, no adverse events were identified in the small sample and a comparison was not performed.
Supplemental material
The least severe adverse events (category E) accounted for more than half of the adverse events identified in both samples. Severity level including prolonged stay accounted for the same amount (30–40%) in both samples. No significant differences were found between the rate of adverse events per 1000 patient days between the samples, when adverse events were analysed separately according to severity of the adverse events: E (RR=1.50, 95% CI 1.00 to 2.26, p=0.05) and F (RR=1.68, 95% CI 0.99 to 2.85, p=0.05) and F, G, H and I (RR=0.47, 95% CI 0.17 to 1.27, P=0.14) and G, H and I (RR=1.38, 95% CI 0.87 to 2.18, p=0.17).
Discussion
The rate of adverse events was 1.45 higher in the large sample than in the small sample. Our findings indicate that the sample size may influence the rate of identified adverse events. The differences in CI and SE indicate that increasing the sample size decreases the variation, as expected. We believe that the higher rate of adverse events detected was due to the use of a larger sample and may be more reflective of the total population given the size of the hospital. Since the distribution of severity level and types of adverse events were the same in both sample sizes, we suggest that these distributions are unaffected by sample size.
While evaluations of the Global Trigger Tool have reported high sensitivity3 and acceptable reliability,16 ,17 the impact of the sample size in determining the level of adverse events has hardly been discussed. We believe this is the first attempt to assess the impact of the sample size to the rate of adverse events identified with the Global Trigger Tool. Good et al10 adjusted the sample size to the hospital sizes without further comparisons between different sample sizes selected in the same time period. We wanted to evaluate whether a larger sample of records reviewed bi-weekly could yield higher rates of adverse events than a sample of 10 records reviewed bi-weekly. Our trust had increased our bi-weekly samples to correspond to 12% of the total number of discharges and found higher rates of adverse events than comparable Norwegian trusts that reviewed samples of 10 records bi-weekly. Thus we determined it legitimate, necessary and original to assess whether using the Global Trigger Tool with different sample sizes would produce different results.
While our findings may challenge the sensitivity of the recommended small sample size in order to identify an accurate rate of adverse events, they also underline the ability of that sample size to reflect distribution of severities and categories of adverse events accurately. Our results in terms of this, corresponds well with other studies.18 ,19 In the small sample, no adverse events of category I were identified. This is most likely due to the fact that the Global Trigger Tool is not designed to identify all such cases (category I). Owing to their infrequent occurrence, other methods should be used to monitor these specific types of events, for example, investigating all hospital deaths.20 ,21 Thus, we compared the rate of adverse events in category I along with the rate of adverse events in other categories (category F, G and H).
Several factors could explain the differences in the rate of adverse events identified in the two samples. First, the authentication processes differed slightly for the two samples. To assess for possible bias, we evaluated the inter-rater reliability of the two teams that reviewed the different samples. We found substantial agreement between the two review teams regarding presence, number and severity level of adverse events, thus conclude that the difference in adverse event rates between the samples are most likely not due to bias from the minor difference in authentication processes. These findings are supported by the work of Zegers et al.22 Second, the Simpson paradox, implying that statistical results from aggregated data could give a different result from a group-level analysis.23 A skewness regarding the variables associated with the index discharges could be present in our study, as the large sample was stratified according to the services before sampling and the small sample was not. However, the primary results did not differ when adjusting for these variables. Neither did the demographic characteristics sex, age and length of stay differ between the large and the small sample. Third, the study was undertaken for only 1 year of discharges comprising 240 records in the small sample. A meta-analysis of different sample sizes showed that the variation of adverse event rates decreases as the sample size increases,4 thus underlining the importance of having a large enough sample size in order to obtain valid results.
Conclusion
We believe the findings in this study could challenge the appropriateness of the sampling methods commonly used as the rate of adverse events increased when the number of records reviewed bi-weekly was increased, though limitations of the study must be considered. The distributions of adverse event categories and severity level did not differ between the samples and only the rate of adverse events appeared to be influenced by the sample size. Further studies are needed to determine whether there is an optimal sample size and if it should be based on hospital size, especially as reviewing larger sample sizes requires more resources. Until further studies, we suggest using a relative increase in sample size to 8–10% of total number of discharges.
Acknowledgments
The authors would like to thank Birger Hveding and Inger Lise Øvre who conducted the reviews together with the coauthors TEH and KM. Frank Federico and Carol Haraden for guidance on the development of the study protocol. Tom Wilsgaard for advice on statistical analysis, and Alexander Ringdal and Marina Mineeva for help with data processing.
References
Footnotes
Contributors KM and BV designed the study. TEH and KM reviewed the records. KM conducted the data analysis and wrote the first draft of the manuscript and rewrote the draft of the manuscript after all coauthors had reviewed and revised. KM performed the statistical analyses and produced the graphs.
Funding KM received a grant from the Northern Norway Regional Health Authority.
Competing interests None declared.
Ethics approval Data protection official in Nordland Hospital trust. Norwegian Regional Ethics Committee (ref 2012/1691).
Provenance and peer review Not commissioned; externally peer reviewed.
Data sharing statement No additional data are available.