Article Text

Abstract
Objectives Self-harm is a major health problem in many countries, with potential adverse outcomes including suicide and other causes of premature death. It is important to monitor national trends in this behaviour. We examined trends in non-fatal self-harm and its management in England during the 13-year period, 2000–2012.
Design and setting This observational study was undertaken in the three centres of the Multicentre Study of Self-harm in England. Information on all episodes of self-harm by individuals aged 15 years and over presenting to five general hospitals in three cities (Oxford, Manchester and Derby) was collected through face-to-face assessment or scrutiny of emergency department electronic databases. We used negative binomial regression models to assess trends in rates of self-harm and logistic regression models for binary outcomes (eg, assessed vs non-assessed patients).
Participants During 2000–2012, there were 84 378 self-harm episodes (58.6% by females), involving 47 048 persons.
Results Rates of self-harm declined in females (incidence rate ratio (IRR) 0.98; 95% CI 0.97 to 0.99, p<0.0001). In males, rates of self-harm declined until 2008 (IRR 0.96; 95% CI 0.95 to 0.98, p<0.0001) and then increased (IRR 1.05; 95% CI 1.02 to 1.09, p=0.002). Rates of self-harm were strongly correlated with suicide rates in England in males (r=0.82, p=0.0006) and females (r=0.74, p=0.004). Over 75% of self-harm episodes were due to self-poisoning, mainly with analgesics (45.7%), antidepressants (24.7%) and benzodiazepines (13.8%). A substantial increase in self-injury occurred in the latter part of the study period. This was especially marked for self-cutting/stabbing and hanging/asphyxiation. Psychosocial assessment by specialist mental health staff occurred in 53.2% of episodes.
Conclusions Trends in rates of self-harm and suicide may be closely related; therefore, self-harm can be a useful mental health indicator. Despite national guidance, many patients still do not receive psychosocial assessment, especially those who self-injure.
- EPIDEMIOLOGY
- PUBLIC HEALTH
This is an Open Access article distributed in accordance with the Creative Commons Attribution Non Commercial (CC BY-NC 4.0) license, which permits others to distribute, remix, adapt, build upon this work non-commercially, and license their derivative works on different terms, provided the original work is properly cited and the use is non-commercial. See: http://creativecommons.org/licenses/by-nc/4.0/
Statistics from Altmetric.com
Strengths and limitations of this study
This is a large study of more than 84 000 presentations to emergency departments following self-harm.
This multicentre study includes five general hospitals in three cities of socioeconomically diverse populations in England, which provides more representative information than single-centre studies.
The study only included individuals who presented to hospital following self-harm.
The rates of self-harm reported in this study are based on urban populations; these have been shown to have higher rates of self-harm than rural populations.
Some of the data reported were based on information available only for those assessed (ie, approximately 53% of all episodes of self-harm), which may limit generalisability.
Introduction
Self-harm (intentional self-poisoning or self-injury, irrespective of type of motivation1) is a public health problem in many countries. It is a major risk factor for completed suicide2 and is associated with elevated all-cause mortality.3 Approximately 50% of individuals who die by suicide have a history of self-harm,4 and in many cases, there is an episode of self-harm shortly before a fatal act,5 particularly in frequent hospital attenders.6 Self-harm is also often associated with poorer psychosocial outcomes, such as depression, anxiety, substance use and educational indices,7 and results in considerable health services and social costs.8
Reliable and accurate data on self-harm are important for understanding national trends and risk factors for self-harm, planning appropriate health services and informing potentially effective preventive measures. Systematic monitoring of self-harm in many countries, including England, has tended to be confined to single centres. However, these are limited in terms of generalisability of findings.
In the present study, we examined trends in non-fatal self-harm in England using data from the Multicentre Study of Self-harm in England http://cebmh.warne.ox.ac.uk/csr/mcm/, which was developed as part of the National Suicide Prevention Strategy for England.9 ,10 We previously reported on trend of self-harm during 2000–2007,11 which showed declining rates of self-harm after 2003, in keeping with the national trends in suicide. Here, we present data on trends during the 13-year period, 2000–2012, including rates, methods of self-harm, psychiatric history, repetition of self-harm and provision of psychosocial assessment following self-harm.
Methods
Sample
This observational study was undertaken in the three centres of the Multicentre Study of Self-harm in England, as described in detail elsewhere.12 We included all individuals aged 15 years and over who presented to five general hospital emergency departments (EDs) following self-harm - Oxford (one hospital), Manchester (three hospitals) and Derby (two hospitals merged into one in mid-2009) - between 1 January and 31 December 2012.
Socioeconomic characteristics of the centres
The three study centres include socioeconomically diverse populations. On the basis of the Index of Multiple Deprivation (IMD) 2007 in England,13 which ranks areas according to seven domains (income, employment, health deprivation and disability, education, skills and training, barriers to housing and services, crime, and living environment) to derive an overall deprivation score, Manchester was ranked the fourth most deprived local authority in England, compared with Derby, which was ranked 69th and Oxford 155th.14
Data collection
Information on all episodes of self-harm was collected in two ways: (1) completion of assessments (of mental state, risks and needs) by the general hospital psychiatric service (and in Manchester also by ED staff)15 and (2) scrutiny of ED electronic databases by research clerks to identify all other patients presenting to the hospital following self-harm, from which more limited data are extracted. Demographic, clinical and hospital management data on each episode were collected by clinicians using pen and paper (Oxford and Manchester), or electronic (Derby and Manchester since mid-2008) forms. Regular induction training of clinical staff helps maintain the quality of data collection.
Data included gender, age, date of self-harm, method of self-harm (including drugs used in self-poisoning and details of self-injury), psychiatric history (including self-harm), whether or not psychosocial assessment was conducted and subsequent repetition of self-harm.
Information on non-assessed patients (those who had taken early discharge, refused or were not offered an assessment) was collected in Manchester from September 2002 onwards. Rates of self-harm for this centre for the earlier period were adjusted upwards by a factor of 1.42, taking account of the 30% of non-assessed individuals identified in a review of the data collected between 1 September 2002 and 31 August 2003. Rates of assessment were similar by age and gender and the adjustment was applied across all age and gender groups.
Rates of self-harm and suicide
Rates of self-harm were calculated for defined local population areas for which centres had near-complete identification of self-harm presentations to hospital (Oxford City, City of Manchester and Derby Unitary Area). We calculated annual person-based rates using each individual's first episode of self-harm within each year. Midyear population estimates for the city catchment areas were obtained from the Office for National Statistics (ONS).16 Rates were calculated per 100 000 of the local general population for each centre, for each year, age standardised to the European population, with 95% CIs.
Rates of suicide in England (age standardised to the European population) were obtained from the ONS. Suicides were ‘deaths given an underlying cause of intentional self-harm or injury/poisoning of undetermined intent’.17
Ethical approval
The monitoring systems in Oxford and Derby have approval from local Research Ethics Committees to collect data on self-harm for local and multicentre projects. Self-harm monitoring in Manchester is part of a clinical audit system and has been ratified as such by the local Research Ethics Committee. All three monitoring systems are fully compliant with the Data Protection Act of 1998. All centres have approval under Section 251 of the National Health Services (NHS) Act 2006 (formerly Section 60, Health and Social Care Act 2001) to collect patient-identifiable information without patient consent.
Statistical analyses
Rates of self-harm and trends in rates were calculated separately for each centre. Trends in method of self-harm and repetition were analysed using data from 2003 to 2012 from the three centres, because these variables are to a certain extent related to assessment status—for example, fewer patients who present with self-injury receive an assessment.15
We used negative binomial regression models to assess trends in rates of self-harm accounting for overdispersion in the data and logistic regression models for binary outcomes (eg, assessed vs non-assessed). Likelihood ratio (LR) tests were used to test for deviation from linearity in trends over time.
The correlation between rates of self-harm and suicide rates in England was examined using Spearman’s rank correlation test. Analyses were carried out using SPSS V.22.0 and Stata V.14.0.
Missing data
Level of missing data varied. Some variables (eg, sociodemographic variables and method of self-harm) which could be determined from ED records, psychosocial or ED assessment were available for all or most individuals. Other variables (eg, history of psychiatric treatment) could only be determined for episodes in which individuals received psychosocial assessment by mental health staff (or in some cases in Manchester by ED staff). A description of the analytic sample in terms of the variables examined is presented below.
Rated of self-harm
During 2000–2012, there were 84 378 presentations due to self-harm involving 47 048 individuals aged 15 years and over to the study hospitals in the three participating centres. We excluded the data of 25 individuals whose sex was unknown, resulting in 84 535 episodes by 47 023 persons. To calculate annual person-based rates, we used each individual's first episode of self-harm within each year (ie, 63 011 episodes by 47 023 individuals). We included only those individuals residing in the local catchment area so that this analysis is based on 37 315 episodes by 26 918 individuals aged 15 years and over.
Method of self-harm and psychosocial assessment
Of the 84 353 episodes by 47 023 individuals, we included those occurring during 2003–2012, that is, 67 653 episode by 35 507 individuals.
Psychiatric treatment
Of the 67 635 episodes by 35 507 individuals presenting to the hospitals during 2003–2012, information on past or present psychiatric treatment was available for 42 711 episodes by 23 711 persons as they had undergone psychosocial or ED (Manchester only) assessment.
Repetition
Repetition was examined for patients presenting between 2003 and 2011. It was based on repeat presentations by individuals within 12 months of their first self-harm episode in any year during this period. Overall, 44 662 episodes by 31 878 persons were included in this analysis.
The role of the funding source
The Multicentre Study of Self-harm in England receives financial support from the Department of Health. The Department of Health had no role in the study design, collection, analysis and interpretation of data, the writing of the manuscript and the decision to submit the paper for publication. The views and opinions expressed do not necessarily reflect those of the Department of Health.
Results
During 2000–2012, there were 84 378 episodes of self-harm by people aged 15 years and over (41.4% by males, 58.6% by females and 25 episodes where sex was not known) presenting to the EDs in the participating centres, involving 47 048 individuals (43.1% males and 56.8% females; table 1). Overall, 38.4% of individuals were aged under 25 years and nearly two-thirds (62.1%) were under 35 years (mean age 32.1 (SD 14.0, range 15–97 years)).
Number of persons and episodes of self-harm among individuals aged 15+ years in 2000–2012 by gender and age group
Rates by gender
The overall age-standardised rates of self-harm were 362 (343–381) in males and 441 (420–462) in females per 100 000 population. In males, the rate appeared to decline between 2000 and 2008 and steadily increase thereafter (figure 1A). Among females, the rate appeared to decline until 2009 and level off up until 2012 (figure 1B).

Age-standardised rates of self-harm in the three centres combined and age-standardised suicide rates in England* in persons aged 15+ years by gender, 2000–2012. (A) Males and (B) females. *Source: Office for National Statistics.15
The results of the negative binomial regression models showed a decline in rates of self-harm over the study period (2000–2012) among females (incidence rate ratio (IRR) 0.98; 95% CI 0.97 to 0.99, p<0.0001). Rates also appeared to decline among males (IRR 0.99; 95% CI 0.97 to 1.00, p=0.021), but the trend was not linear (p for LR test for deviation from linearity (DFL)=0.007). After inspecting figure 1 and based on our a priori assumption that the economic downturn might increase rates of self-harm, we examined trends in rates by period (2000–2007 vs 2008–2012) by fitting separate regression models for each time period.
The results showed a decline in rates until 2008 (IRR 0.96; 95% CI 0.95 to 0.98, p<0.0001), followed by an increase thereafter (IRR 1.05; 95% CI 1.02 to 1.09, p=0.002).
Rates of self-harm from this study were strongly correlated with suicide rates in England in males (r=0.82, p=0.0006) and females (r=0.74, p=0.004) (figure 1A, B).
Rates of self-harm by centre
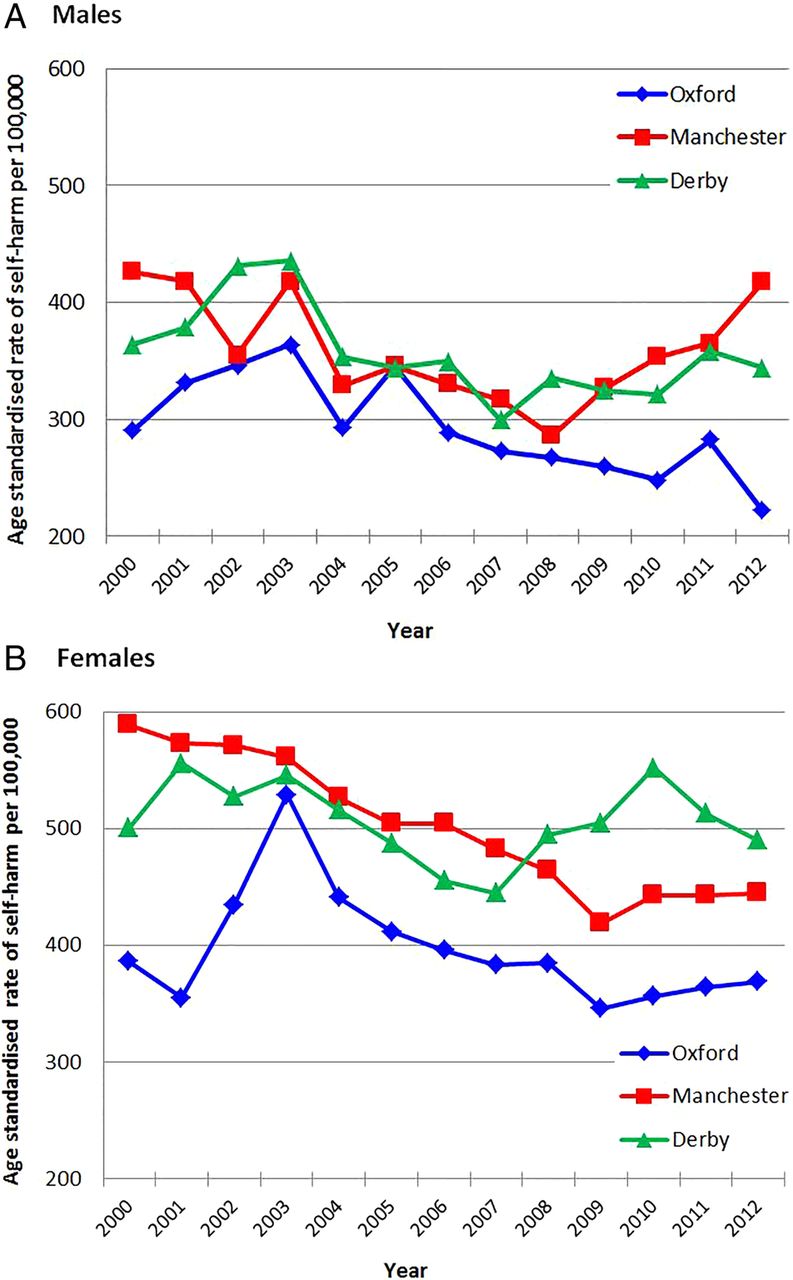
Rates of self-harm were similar in Manchester and Derby (males: 360 (95% CI 353 to 367), females: 502 (493–511); males: 357 (95% CI 346 to 368), females: 507 (494 to 520), respectively) and markedly lower in Oxford (males: 293 (95% CI 281 to 305), females: 397 (384–410)). There also appeared to be differences in trends in rates of self-harm between the centres (see figure 2A, B).

Age-standardised rates of self-harm in individuals aged 15+ years by centre, 2000–2012. (A) Males and (B) females.
In males, there was a decline in rates of self-harm between 2000 and 2012 in Oxford (IRR 0.97; 95% CI 0.96 to 0.99, p<0.0001) and Derby (IRR 0.98; 95% CI 0.97 to 1.00, p=0.009), but the trends were not linear (p for LR test for DFL: Oxford=0.007, Derby=0.009), while in Manchester, there was no statistical evidence of a trend over the study period (IRR 0.99; 95% CI 0.97 to 1.01, p=0.21; figure 2A). However, in Manchester, the pattern was similar to the overall trend (see above) with a decrease in rates until 2008 and increasing rates thereafter. In females, there was no evidence of a trend in rate of self-harm during 2000–2012 in Oxford (IRR 0.99; 95% CI 0.97 to 1.00, p=0.05) or Derby (IRR 1.00; 95% CI 0.99 to 1.01, p=0.38), but in Manchester, rates of self-harm fell during 2000–2012 (IRR 0.97; 95% CI 0.97 to 0.98, p<0.0001).
Rates of self-harm by age group
Trends in rates of self-harm showed some differences according to gender and age group (figure 3A, B). There was no evidence of a trend in rates of self-harm in males 15–24 or 35–54 years (IRR 0.99; 95% CI 0.99 to 1.00, p=0.08; IRR 0.99; 95% CI 0.98 to 1.01, p=0.28, respectively), but among those aged 25–34 years, rates of self-harm declined during 2000–2012 (IRR 0.96; 95% CI 0.95 to 0.98, p<0.0001), although the trend was not linear (p=0.0003 for LR test). Rates of self-harm increased steadily and linearly in males aged 55+ (IRR 1.02; 95% CI 1.01 to 1.04, p=0.003), an annual average increase of 2% over the study period.

Rates of self-harm in individuals aged 15+ years by age group in the three centres combined, 2000–2012. (A) Males and (B) females.
Rates of self-harm fell in females younger than 55 years (15–24 years: IRR 0.98; 95% CI 0.97 to 0.99, p<0.0001; 25–34 years: IRR 0.96; 95% CI 0.96 to 0.97, p<0.0001; 35–54 years: IRR 0.99; 95% CI 0.98 to 1.00, p=0.004), although the trend was linear only in females aged 25–34 years (p=0.76 for LR test for DFL). There was a clear increase in rates of self-harm in older females (55+ years) (IRR 1.02; 95% CI 1.01 to 1.04, p=0.003, p for LR test=0.81), on average a 2% annual increase.
Methods of self-harm
Using data from 2003–2012 from the three centres (67 653 episodes), 50 484 (74.6%) were due to self-poisoning alone, 14 213 (21.0%) involved self-injury alone and the remainder 2956 (4.4%) involved both self-poisoning and self-injury. The number of episodes involving self-injury alone steadily increased from 2007 (OR=1.08, 95% CI 1.07 to 1.10, p<0.0001; figure 4).
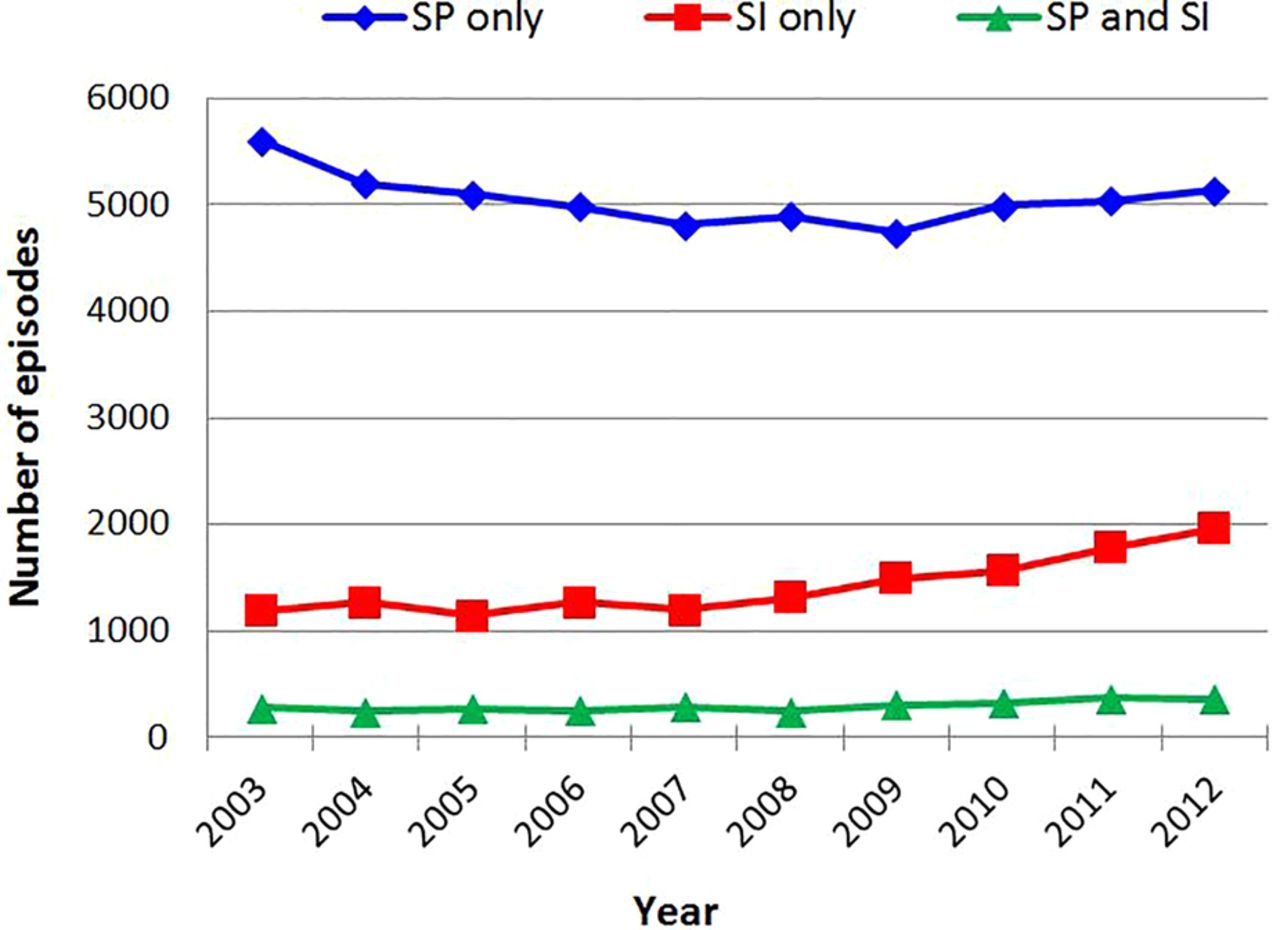
Trends in the number of episodes of self-poisoning (only), self-injury (only) and both methods in individuals aged 15+ years in the three centres combined, 2003–2012.
Of the self-poisoning episodes (n=53 440), 45.6% involved paracetamol or salicylate analgesics (both in their pure or compound form), 24.7% involved antidepressants (tricyclic, selective serotonin reuptake inhibitors (SSRIs), serotonin–norepinephrine reuptake inhibitors (SNRIs), other antidepressants), 13.8% involved benzodiazepines and 6.9% involved major tranquilisers or antipsychotic medication.
The vast majority of self-injury episodes involved self-cutting/stabbing (76.7%). The remainder included asphyxiation/hanging (6.0%), jumping from heights (2.8%), traffic related (1.9%), carbon monoxide (1.0%), drowning and gunshot (0.9%) and a variety of other methods (9.3%). In terms of specific methods of self-injury, there was little change in the number of presentations to hospital following self-cutting/stabbing until 2007 (OR=1.01, 95% CI 0.99 to 1.03, p=0.60), but from 2007, there was an increase in presentations involving self-cutting/stabbing (OR=1.05, 95% CI 1.04 to 1.07, p<0.0001; figure 5A). There was also a marked increase in the number of episodes of hanging/asphyxiation from 2005 (OR=1.03, 95% CI 1.02 to 1.04, p<0.0001) and an increase in jumping from heights from 2003 (OR=1.13, 95% CI 1.09 to 1.17, p<0.0001; figure 5B). The patterns seen were similar in males and females (results not shown).

Trends in the number of episodes of self-injury in individuals aged 15+ years in the three centres combined, 2003–2012. (A) Self-cutting and (B) self-injury methods other than self-cutting.
Psychosocial assessment
Between 2003 and 2012, psychosocial assessment by specialist mental health staff was carried out in 35 960 (53.2%) of 67 653 episodes of self-harm, although there was considerable variation between the three centres (41.0–69.3%). The proportion of episodes assessed fluctuated, with no evidence of a linear trend over the study period (p<0.0001 for LR test for DFL). Overall, the proportion of individuals receiving psychosocial assessment was greater in 2012 relative to 2003 (OR=1.35, 95% CI 1.26 to 1.44, p<0.0001), although there was variation between the centres. The proportion of patients receiving psychosocial assessment differed between the methods of self-harm (self-injury alone: 38.2%; self-poisoning alone: 56.6%; self-poisoning and self-injury: 65.6%). Individuals presenting with self-injury alone were less likely to be assessed relative to patients presenting with self-poisoning alone (OR=0.47, 95% CI 0.46 to 0.49, p<0.0001) and those presenting after self-poisoning and self-injury (OR=0.32, 95% CI 0.30 to 0.35, p<0.0001). Psychosocial assessment was carried out in 34.4% of the episodes of self-cutting alone.
Psychiatric history
Information was available on 39 279 episodes of self-harm, in 31.3% of which the individuals were in contact with mental health services at the time of presentation (30.4% and 0.9% were receiving outpatient and inpatient treatment, respectively). The proportion of patients receiving psychiatric treatment at the time of presentation to hospital generally increased between 2003 and 2012, although there was no evidence for a linear trend (p<0.0001 for LR test for DFL). The proportion of episodes in which the individuals reported having had previous treatment from mental health services was 62.3% (overall n=38 490 episodes). Information on current psychiatric treatment was missing in 3434 (8.0%) episodes and that about past psychiatric treatment in 4221 (9.9%) episodes.
Repetition of self-harm
Repetition was defined as a re-presentation to the same centre after self-harm. The proportion of individuals who repeated an episode of self-harm within 1 year was 21.0% (9397/44 662) during 2003–2011. The proportion repeating remained relatively stable during the study period (OR=1.00, 95% CI 1.00 to 1.01, p=0.2).
Discussion
We examined trends in non-fatal self-harm in England during 2000–2012 using data from the Multicentre Study of Self-harm in England. We examined rates, methods of self-harm, psychiatric history, repetition of self-harm and provision of psychosocial assessment following self-harm. Because of the rigour of methods used in the this study to collect information on self-harm, it provides the most accurate available picture of self-harm in England.
Rates of self-harm
Trends in rates of self-harm were consistent with trends in rates of suicide in England for the equivalent period.17 This reinforces our earlier conclusion that rates of self-harm as found in this multicentre study reflect those for suicide nationally.11 Since suicide is often preceded by self-harm,2 it might be argued that the association is in the other direction, that is, suicide rates reflect self-harm rates. Certainly, accurate data on rates of self-harm may represent an important and sensitive mental health indicator.18
There were differences in rates of self-harm between the centres, which were in keeping with differences in socioeconomic characteristics of the catchment areas.11 ,12 Thus, the average rates of self-harm between 2000 and 2012 were considerably higher in Manchester and Derby than in Oxford. The City of Manchester is ranked lowest of all three in terms of the IMD, followed by Derby Unitary Area and Oxford City.
Rates of self-harm generally declined during the initial part of the study period but increased in males after 2008. This pattern is likely to be related to the recent economic recession,19 as has been found for suicide in England.20 ,21 and for suicide and self-harm in Ireland.22 The problems people face in relation to economic downturn (eg, work, unemployment and housing)19 present particular challenges for clinical services and prevention efforts.23 Policies for helping such individuals include, for example, investing more in active labour market programmes such as job search assistance and subsidised employment, training front-line staff likely to be in contact with those at risk for mental health problems due to economic and employment difficulties such as staff in advice agencies and job centres and provision of adequate welfare benefits when needed.24
Trends in rates of self-harm showed some differences according to gender and age group. There was no clear trend in rates of self-harm in males aged 15–24 or 35–54 years, but there was a decline in those aged 25–34 years. However, rates of self-harm in females aged under 55 years generally declined during 2000–2012. For males and females, there was a steady rise in rates of self-harm in those aged 55 years and older, although the magnitude of the increase was relatively small.
Methods of self-harm
The vast majority of self-harm episodes were due to self-poisoning, mainly by ingestion of analgesics and antidepressants. Self-poisoning presents particular challenges in terms of medical management and prevention of suicide death, including optimising medical care to minimise the risk of death after hospital addmission.25 The number of self-injury episodes increased over the studied period. Of the episodes involving self-injury, the majority were due to self-cutting/stabbing. In terms of gender, there were similar changes in specific methods over time. The number of episodes involving this method increased markedly. We do not know if this is due to a general increase in use of this method, or because a greater proportion of people who intentionally cut themselves have presented to hospitals. However, it should be noted that there is a stronger risk of suicide following self-cutting compared to self-poisoning. We previously found a 1.8-fold increased risk of suicide following self-cutting/stabbing relative to self-harm by self-poisoning.26 Also, repetition of self-harm is more common in individuals who cut themselves.27 The increase in self-cutting is also concerning given our earlier finding that the proportion of patients who receive psychosocial assessment is especially low for individuals who self-cut.28 The increase in other methods of self-injury, especially hanging/asphyxiation, is also worrying. In our earlier study, we found a 2.65-fold increased risk of suicide following hanging/asphyxiation relative to self-poisoning.26 Indeed, suicide by hanging has been increasing in the UK, as suggested by a recent ONS report.29
Psychosocial assessment
Despite the recommendation made by the National Institute for Health and Care Excellence (NICE) in 2004 that everyone who presents to hospital following self-harm should have a comprehensive psychosocial assessment,30 an assessment only occurred in just over half of episodes. In a survey of 32 hospitals across England, a psychosocial assessment by a mental health professional occurred in 58% of self-harm episodes (range 24–88%),31 with no evidence of an increase in this proportion from a similar study in 2001–2002.32 Hospital attendance following self-harm represents an opportunity to intervene and implement preventive measures and is associated with better outcomes.33 Barriers to assessment need to be identified and overcome. This may particularly apply to self-injury, especially self-cutting.
Psychiatric history
A little over 30% of the patients were receiving some form of psychiatric care at the time of presentation. Interestingly, this figure is similar to the National Confidential Inquiry finding that 28% of suicides occurred in individuals who were in contact with mental health services in the 12 months prior to death.34
Strengths and limitations
This is a large multicentre study of more than 84 000 presentations to EDs of five general hospitals in three cities of different socioeconomic characteristics across England (Oxford, Manchester and Derby). As such, it provides more representative information than any single-centre study. It also allows for a comparison between centres of socioeconomically diverse populations. However, the study only included individuals presenting to hospital following self-harm, and it is known that many self-harm episodes do not result in hospital presentation, especially in young people.35 This is relevant in particular to self-cutting, which is less likely to result in hospital presentation.36
The rates of self-harm we have reported are based on urban populations, which are known to be higher than in rural populations.37 Furthermore, some of the data reported were based on information available only for those assessed (ie, approximately 53% of all episodes of self-harm), which may have limited generalisability as there are known differences between patients who do and do not receive a psychosocial assessment following self-harm.15
Conclusions
There have been similar trends in rates of self-harm and suicide in England in recent years. Of note is the steady increase in self-harm observed since 2008, particularly in males, which coincided with the economic recession. Rates of self-harm also appeared to have increased in individuals aged over 54 years. Reliably collected data on self-harm may provide an important and sensitive mental health indicator.
Our finding that only a little over half of individuals presenting to hospital after self-harm were offered psychosocial assessment and that individuals who self-injured were least likely to receive an assessment, coupled with the rise in self-injury as a method of self-harm and the link between such methods and suicide, may have important implications for the management of self-harm in hospitals. These include efforts to increase the overall rate of psychosocial assessment of patients who self-harm and, especially, to ensure that more of those who present with self-injury receive an assessment than appears to be current practice.
Acknowledgments
The authors thank Liz Bale, Helen Bergen, Fiona Brand, Deborah Casey, Jayne Cooper, Muzamal Rehman and Simon Thacker for their contribution to this study, the research staff in each centre, as well as members of the general hospital psychiatric and other clinical services, and hospital administration staff for assistance with data collection. They also thank Jane Holmes from Oxford University Centre for Statistics in Medicine for statistical advice.
References
Supplementary materials
Press release
Press release
Footnotes
Contributors GG and KH designed the study. All authors collected and interpreted the data. GG analysed the data. GG and KH wrote the first draft of the report. All authors revised the report and approved the final version.
Funding Department of Health, UK.
Competing interests None declared.
Ethics approval Research Ethics Committees.
Provenance and peer review Not commissioned; externally peer reviewed.
Data sharing statement No additional data are available.