Article Text

Abstract
Objectives To evaluate trends in premature cancer mortality in Colombia by educational level in three periods: 1998–2002 with low healthcare insurance coverage, 2003–2007 with rapidly increasing coverage and finally 2008–2012 with almost universal coverage (2008–2012).
Setting Colombian population-based, national secondary mortality data.
Participants We included all (n=188 091) cancer deaths occurring in the age group 20–64 years between 1998 and 2012, excluding only cases with low levels of quality of registration (n=2902, 1.5%).
Primary and secondary outcome measures In this descriptive study, we linked mortality data of ages 20–64 years to census data to obtain age-standardised cancer mortality rates by educational level. Using Poisson regression, we modelled premature mortality by educational level estimating rate ratios (RR), relative index of inequality (RII) and the Slope Index of Inequality (SII).
Results Relative measures showed increased risks of dying among the lower educated compared to the highest educated; this tendency was stronger in women (RRprimary 1.49; RRsecondary 1.22, both p<0.0001) than in men (RRprimary 1.35; RRsecondary 1.11, both p<0.0001). In absolute terms (SII), cancer caused a difference per 100 000 deaths between the highest and lowest educated of 20.5 in males and 28.5 in females. RII was significantly higher among women and the younger age categories. RII decreased between the first and second periods; afterwards (2008–2012), it increased significantly back to their previous levels. Among women, no significant increases or declines in cancer mortality over time were observed in recent periods in the lowest educated group, whereas strong recent declines were observed in those with secondary education or higher.
Conclusions Educational inequalities in cancer mortality in Colombia are increasing in absolute and relative terms, and are concentrated in young age categories. This trend was not curbed by increases in healthcare insurance coverage. Policymakers should focus on improving equal access to prevention, early detection, diagnostic and treatment facilities.
- PUBLIC HEALTH
- EPIDEMIOLOGY
- SOCIAL MEDICINE
This is an Open Access article distributed in accordance with the Creative Commons Attribution Non Commercial (CC BY-NC 4.0) license, which permits others to distribute, remix, adapt, build upon this work non-commercially, and license their derivative works on different terms, provided the original work is properly cited and the use is non-commercial. See: http://creativecommons.org/licenses/by-nc/4.0/
Statistics from Altmetric.com
Strengths and limitations of this study
Population-based mortality databases with information on educational level provide a unique data source to evaluate educational differences.
Definition of the variable for educational level does not guarantee having terminated the indicated level; there may be variances within educational groups.
The time period included covers a period of important changes in Colombian society that are expected to be reflected in cancer mortality rates.
Multiple imputation improved statistical power and precision of analyses.
The underlying causes of these trends are unknown.
Introduction
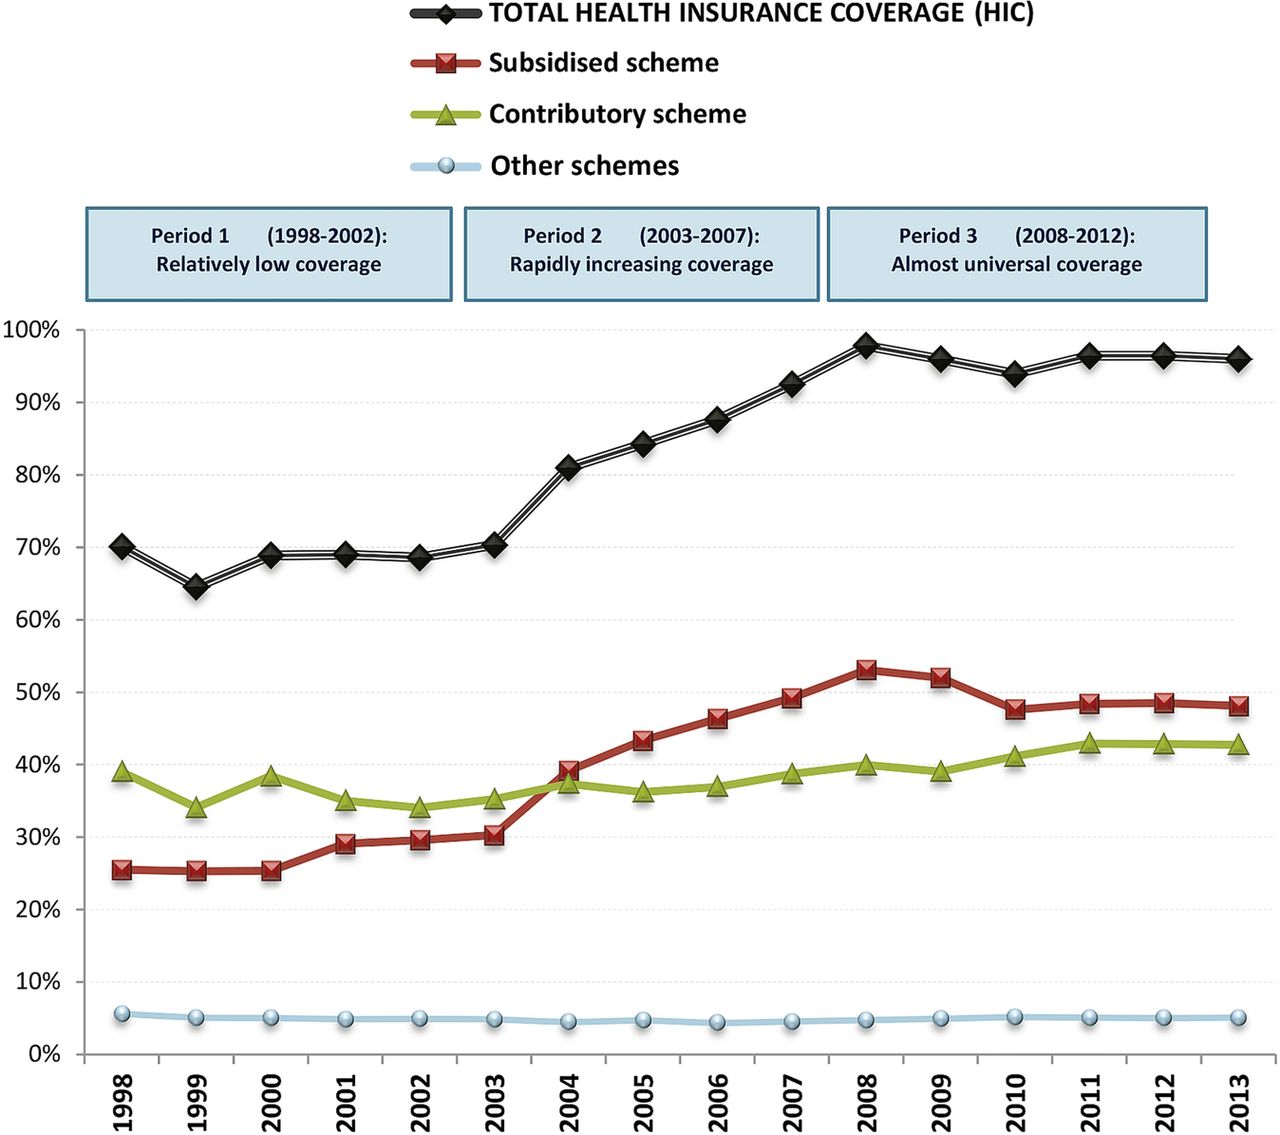
Colombia is a country with very large socioeconomic inequalities causing, among others, large differences in health-related topics such as life expectancy and incidence, prognosis and mortality of disease.1–3 In 1993, a major healthcare reform in Colombia introduced mandatory health insurance coverage (HIC).4 Citizens are assigned to two major schemes based on income: (1) the contributory scheme, which covers workers and their families with an income above the cut-off and is financed through payroll and employer's contributions; and (2) the subsidised scheme, mainly funded via taxes, which subsidises the poor as identified through a proxy means test.5 HIC was 23.7% in 1993 just before the reform6 and rose to 37.7% in 1994, just afterwards.4 Initially, the coverage improved4 slowly and a subsequent reform led in 2002 to a noticeable increase in healthcare coverage (reaching around 96% by 2008) by improving efficiency in the use of resources and by reducing its reliance on national budgets7 (figure 1). In the poorest income quartile, HIC increased from 6% to over 70% between 1993 and 2009,5 attributable to the subsidised scheme,8 which shows that the programme reached the poorer income groups more aggressively. This increased HIC is expected to contribute to a reduction in health inequalities,4 ,5 mainly by improving the situation for the poor: ensuring timely care and bringing patients in closer contact with the healthcare system.9 ,10 It has been argued, however, that the reform increased the complexity of the system which could potentially lead to delays in certain types of care11 and reduced spending in prevention and public health.12

Trends in national healthcare insurance coverage (HIC), Colombia, 1998–2012. Other schemes primarily include members of the military and teacher and oil workers syndicate members. Based on Annual reports of the Ministry of Health and Social Protection. Source: Annual reports of the Ministry of Health and Social Protection to the Congress of the Republic of Colombia.
In Colombia, three different periods in the implementation of universal HIC can be discerned (figure 1): During the period 1998–2002, HIC was relatively low and stable (around 70% during all the period); the second period (2003–2007) covered the years of rapid increase in coverage among the poor (6.9% average annual growth in HIC, 12.2% in subsidised scheme); during the third period (2008–2012), universal coverage remained stable according to official figures at, on average, 96.1%. The discrepancy in HIC trends between these three periods offers a natural experiment to examine the impact of HIC on socioeconomic disparities in mortality.
Few studies have examined the impact of different health insurance status on inequalities in mortality and even less is known about inequalities in mortality in middle-income countries, many of which introduced major healthcare system reforms during the past decades. As in Colombia, the increase of HIC towards universal coverage was deliberately addressed to the poorest population,4 ,5 and educational level is a good proxy variable for socioeconomic status (SES);13 we hypothesise that increased HIC contributed to reducing inequalities in cancer mortality. Cancer mortality is a particularly interesting indicator of the effect of insurance coverage due to the expected increased access to prevention measures, early detection, timely treatment therapies and high-cost interventions.14–16
Indeed, previous analyses of time trends of differences in cancer mortality by attained educational level in Colombia (1998–2007) were promising, particularly for gastric and cervical cancer where faster declines in mortality occurred in the lowest educated groups, and therefore socioeconomic differences were expected to decrease in the near future.3 In this paper, we evaluate if the seemingly positive trend in cancer mortality by educational level continued, by using a slightly different definition of educational level which allowed us to extend the previous analyses (up to 2007) by five extra years, covering 1998–2012.
Methods
Data
Education level criteria
Educational level was defined as the highest level in which the individual has been enrolled during his life (ie, the person accessed but not necessarily graduated this level), and was categorised in three groups based on the highest educational level accessed by the deceased: (1) Primary school or less, (2) Secondary school and (3) Tertiary (postsecondary education). In previous papers, educational level has been used, based on the highest educational level attained (ie, completed) by the deceased,1 ,3 but this category is restricted to the period 1998–2007. In our calculations, we found both approaches to be similar in terms of the results yielded.
Deaths
National mortality data for cancer deaths (International Classification of Diseases (ICD-10) codes C00-C96, see online supplementary appendix table S1) for the period 1998–2012 were obtained from the National Administrative Department of Statistics (DANE), which routinely registers information on sex, date and cause of death as well as educational level from death certificates. Although the exact wording for the variable ‘accessed education’ changed in the DANE database since 2008, the new categories were consistent with those of the databases of previous years and could be used. Trends of counts were found to be continuous and regular.
Supplemental material
We focused on adult premature mortality (mortality below age 65 years) because it is known that information on educational level from mortality statistics is unreliable at ages 65 years and beyond.17 Additionally, premature mortality is an indicator of population health, believed to be strongly influenced by social, economic and environmental factors,18 and is a common indicator of health system performance.19
Data on age and sex were available for more than 99% of all deaths, while data on educational level was missing for approximately 16.5% of 190 993 cancer deaths. We used multiple imputation methods20 implemented in SAS through the IMPUTE procedure to impute educational level for these cases in order to avoid bias due to the potentially higher rates of missing education for lower educated individuals, and to minimise the potential for numerator/denominator bias.17 In short, this procedure fits a sequence of regression models and draws values from the corresponding predictive distributions. The sequential regression procedure was applied on the basis of a model that included sex, region, urban/rural residence and marital status as covariates. Details of this method are explained elsewhere.20 The imputation procedure was successful in 90.8% of cases with missing information, resulting in a total of 188 091 (98.5%) cancer deaths for our analyses.
Population
Data on mid-year population counts by age, sex and educational level were obtained from the Colombian Demography Health Surveys (DHS),21 which contain periodical information on the distribution of education by age, sex and calendar year (1995, 2000, 2005 and 2010). Age 20 years was chosen as the lower age limit of this study as almost 100% of individuals accessed their highest educational level by this age.
The resulting proportions of individuals in each educational level were multiplied with the total population numbers per year, age and sex which were obtained from the census combined with statistical projections from DANE.22 These two information sources were combined to estimate the annual population size in each educational group (see online supplementary appendix figure S1). We performed demographic projections to obtain population counts for years in-between every lustrum using the demographic Software PASEX (Population Analysis System (PASEX) [program]. 2.04g version. Washington DC: International Programs Center (IPC)—United States Census Bureau, 2011). Additional details on the procedure are available elsewhere (Population Analysis System (PASEX) [program]. 2011).
Analysis
All analyses were conducted in each of the five multiple databases generated by the multiple imputation process. Since the results were nearly identical for all imputations, we used standard techniques as implemented in the PROC MIANALYZE procedure in SAS to combine estimates from all databases and adjust SEs to account for uncertainty in the imputation (SAS Institute I. The MIANALYZE Procedure. User's Guide SAS/STAT® 9.2. Version 8 ed. Cary, NC: SAS Institute Inc, 2008:201–33). This procedure reads the parameter estimates and associated covariance matrix for each imputed data set, and then derives valid multivariate inferences for these parameters. This allows for a valid statistical inference that appropriately reflects uncertainty due to missing values (SAS Institute I. 2008:201–33). All analyses were conducted in SAS V.9.2.
Age standardised mortality rates
Data on population counts were combined with data on deaths to obtain a complete database of death counts by educational level, sex and 5-year age group. We first calculated age-standardised mortality rates by educational level, sex and year using the World Health population of 199723 as the standard population, resulting in Age Standardised Mortality Rates (ASMR) expressed per 100 000 person-years (figure 2). We also calculated ASMR by sex and year (figure 2) and by educational level and sex (table 1).
Descriptives of the study: numbers of deaths and population size and age-standardised mortality rates by sex and educational level, Colombia, 1998–2012

Age-standardised cancer mortality trends, including APC based on joinpoint models, by sex and educational level. Markers: Observed age-standardised cancer mortality rates. Lines: modelled age-standardised cancer mortality trends. Estimates are results from five databases generated by multiple imputations, appropriately reflecting uncertainty attributable to missing values. The points represent ASMR; lines represent the trendlines between joinpoints. Blue, diamonds: maximum primary education; Red, triangles: secondary education; Green, circles: tertiary education. Numbers adjacent to the lines represent estimates annual percent change (EAPC) during the corresponding periods, based on joinpoint modelling; a star indicates statistical significance at α 0.05.
Annual trends in ASMR by sex and educational level were quantified by calculating the estimated Annual Percentage Change (EAPC), which measures the average rate of change in the mortality rate per year (negative EAPC: decreasing trend, positive EAPC: increasing trend). To test whether an apparent change in mortality trends was statistically significant, we used joinpoint regression, which fits a series of joined straight lines to age-adjusted rates and uses a Monte Carlo Permutation method to identify the best-fitting point (called joinpoint, year in which a significant change in the mortality trend occurred), where the rate of increase or decrease changes significantly (Joinpoint Regression Program [program]. 4.0.4 version, 2013). EAPC and joinpoints were determined on the basis of the log-transformed ASMRs and their SEs. We specified a maximum of two joinpoints with at least four observation points to either extreme of the data using joinpoint modelling based on the Joinpoint program24 (figure 2).
Regression models
We implemented separate Poisson regression models by sex with number of deaths as a dependent variable and the natural log of person-years as the offset variable, incorporating age and educational level as independent variables. We first estimated rate ratios (RR) of mortality by educational level, which compared the mortality of all educational groups to the mortality in the tertiary education group. Changes in the RR over time result from changes in risks and the distribution of educational level.25 To assess changes in disparities ‘controlling’ for changes in the educational distribution, we estimated the relative index of inequality (RII), regressing mortality on the midpoint of the cumulative distribution of education, thereby taking into account the size of each educational group.25 ,26 Values higher than 1 indicate educational inequalities favouring the higher educated.
We evaluated if RRs changed significantly over time and within periods on continuous scales, which was not the case (results not shown). We calculated RII for three 5-year periods (1998–2002, 2003–2007 and 2008–2012) and for three age groups (20–34, 35–49 and 50–64) in order to identify differences in inequalities along age (figure 3).

Sex-specific relative index of inequality by period and age group. Estimates from combined results from five databases resulting from multiple imputations, appropriately reflecting uncertainty attributable to missing values.
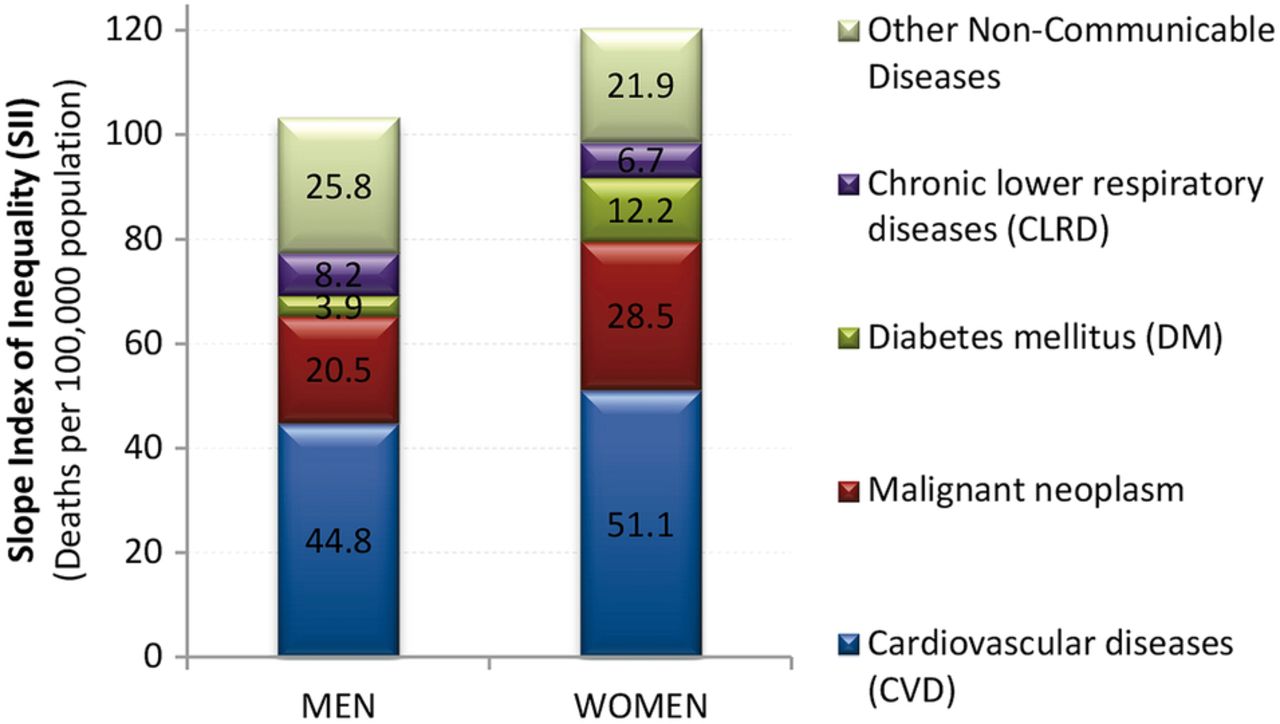
To compare the contribution of each cause of death to mortality disparities for non-communicable diseases (classified by their ICD-10 codes, see online supplementary appendix table S1), we calculated the slope index of inequality (SII) figure 4). The SII is a measure of absolute disparities that represents the difference in mortality between the population at the top and the bottom of the educational distribution.25 Further details on the RII and SII are available elsewhere.25

Slope index of inequality (SII) for non-communicable diseases. See online appendix-table S1 for International Classification of Diseases (ICD-10) codes for non-communicable diseases.
Results
Table 1 shows counts of cancer deaths and population at ages 20–64 years between 1998 and 2012 in Colombia. After excluding non-imputed cases (1.5%), 106 199 cancer deaths occurred from 1998 to 2012 among women while 81 892 occurred among men, with age-standardised cancer mortality rates (ASMR, per 100 000 person-years) of 58 among women and 49 among men. Men and women with lower levels of education had higher cancer mortality rates than their higher educated counterparts. In addition, ASMR were larger among women than among men in each educational level.
The risk of dying was significantly and consistently higher among the lower educated. The RRs show clearly and statistically significantly increased risks of dying among the lower educated compared to the highest educated; this tendency was stronger in women (RRprimary=1.49; RRsecondary=1.22, both p<0.0001) than in men (RRprimary=1.35; RRsecondary=1.11, both p<0.0001). In order to formally test this higher female risk, we calculated RRs between sexes by educational levels, using men as the reference category. For all educational levels, women had significant larger RRs (results not shown). We also found a consistent and slight increase in RRs from the first period, to the second period, and then to the third period (see online supplementary appendix table S2) among both men and women and for primary and secondary education compared to the higher educated, but the CIs overlap, indicating that the differences do not reach statistical significance.
During the 15 years of observation, the general tendency was for age-standardised cancer mortality rates to decline, with recent stabilisations reaching an average ASMR in 2012 of 47.3 per 100 000 males and 55.2 per 100 000 females. Average EAPC for males in the periods defined by joinpoint was: 1998–2000: 2.4% (95% CI −2.0% to 7.0%), 2000–2012: −0.92% (95% CI −1.2% to −0.7); for females 1998–2003: 0.7 (95% CI −0.7 to 2.1), 2003–2006: −2.8% (95% CI −8.2% to 2.9%), 2006–2012–0.6 (95% CI −1.5 to 0.3). The general tendency for a declining trend in mortality was not reflected equally by educational level and sex (figure 2). Women had higher mortality rates than men. No significant increases or declines over time were observed in the lowest educated groups, whereas in the middle and high educated groups there was at least one period with significantly declining cancer mortality rates. In these groups, tendencies were for mortality to decrease substantially in the period after 2002/2003, with the exception of the highest educated males who showed recent increases. The strongest declines in cancer mortality over time were observed in the group of women with secondary or tertiary education. The most consistent declines in cancer mortality rates for all educational levels in both sexes were observed in the period 2003–2007, the period with rapid increases in HIC, particularly among the poor.
RII initially decreased from 1998–2002 to 2003–2007 (reaching significance among women), but then in the period 2008–2012 it increased back to its previous levels (figure 3, left panel). Trends in the joinpoint for RII are in line with this finding: no significant change was found for educational inequalities among men, whereas there was a significant decline (−7.6%) initially among women up to 2004 followed by a significant increase (+3.8%) in the period 2004–2012 (see online supplementary appendix figure S2). RII also showed that inequalities were significantly higher for the younger age categories compared to older ones and tended to be higher for women (figure 3, right panel).
Figure 4 shows the contribution to absolute differences in ASMR by education as measured by the SII for non-communicable diseases (see online supplementary appendix table S1). Cancer was the second largest cause, after cardiovascular disease, explaining 20% of male differences (SII=20.5 deaths per 100 000 population) and 24% of female differences (SII=28.5). Absolute differences in cancer mortality were 39% larger for women than for men (28.5 vs 20.5), while this difference was only 14% for all non-communicable diseases (SII=103.2 and 120.3, respectively).
Discussion
We observed strong and persistent educational differences in cancer mortality rates in Colombia. These differences appeared to be diminishing in the period 2002–20073 when healthcare insurance coverage largely grew, especially for the most disadvantaged part of the population. However, in recent years, despite the achievement of almost universal HIC, inequalities were widening, particularly among women, with rates in the lowest educational groups being stable or increasing and those in the higher educated groups gradually declining. This means that the lowest educated part of the population is increasingly lagging behind in the progress against cancer, despite the increase in insurance coverage.
Explanation of results
Educational level was previously found to be a good proxy variable for socioeconomic status (SES).13 Lower SES is associated with a higher prevalence of cancer risk factors (such as smoking, alcohol, obesity, occupational risk factors, housing circumstances) and less healthcare utilisation (because of lower resources as well as lower awareness and poorer access due to longer distances or high impact of family income when taking time off to visit a doctor).27–29
Absolute cancer mortality rates and inequalities in mortality were largely higher for women than for men. In a previous paper, we showed this to be almost entirely attributable to cervical cancer mortality, which accounted for 51% of inequalities in total female cancer mortality in 1998–2007 at 25–64 years.3 The consistently higher RR for women than men are unique to cancer in Colombia; studies evaluating other causes of death consistently show a higher mortality risk for men,1 ,2 which also coincides with the usually lower life expectancy of men. This illustrates the high burden of certain cancers which are strongly SES related, probably mainly cervical and breast cancer, which, if diagnosed late, have a very poor prognosis even though early detection possibilities are ample. Several Colombian studies have identified that both characteristics of the health system, such as access and delays in diagnosis and treatment, and characteristics of the populations of lower socioeconomic classes, contribute to the higher burden of cervical cancer mortality.30 ,31 A previous study showed that lower access to mammography screening for early detection of breast cancer was associated with lower education, affiliation to the subsidised regime or being unaffiliated.32 In general, financial access to healthcare has been more limited to women,33 ,34 which potentially limits access to expensive cancer therapies, particularly for most deprived women.
We also observed clearly increased educational differences in cancer mortality for the youngest age groups, in which mortality from cancer is a relatively rare event. Among males, leukaemias, stomach cancers and Non-Hodgkin's lymphomas are important cancer causes of deaths in the age group 15–39 years (representing 44% of all cancer deaths in this age group); for females, these include cervical cancer and leukaemias as well as non-Hodgkin's lymphomas (representing 38%).35 Previous studies have shown that mortality or survival of these cancer types is very much dependent on socioeconomic status.3 ,14 ,36 Since these tumours explain an important proportion of cancer deaths in these ages, this probably explains the high RII in the younger age groups as compared to the higher age categories. Nevertheless, we cannot discard that, at least partially, the strong inequalities in younger groups are due to the fact that, when rates are low, relative inequalities tend to show an increasing pattern.37
In order to test if RII is a good indicator of changes in inequalities,37 we compared trends in relative and absolute measures of inequalities (RII and SII), which were almost identical (results not shown). Mackenbach hypothesised that, in the case of declining mortality rates, RIIs are exaggerating the differences,37 but this was clearly not the case in our study, probably because reductions in premature mortality rates of cancer were relatively smooth, and not very strong and not very divergent between educational levels, with the exception of tertiary educated women. Among women, we only found a clear reduction in inequalities during the period 1998–2004, owing to a clearly divergent pattern between educational levels: a rapid significant decrease of ASMRs in the higher socioeconomic group (tertiary educated) and an opposed rapid significant increase of ASMRs among those with secondary education. We have illustrated in previous work that these trends are most likely due to large changes in cervical cancer mortality.3
Our results clearly illustrate that an almost complete coverage does not necessarily reduce inequalities in health.38 ,39 In particular, having health insurance may be universal, but depending on income the type of health insurance is different (subsidised, contributory and special or exceptional regimes), with the wealthy population often buying additional private health assurance to ensure rapid and more broad access.40 The quality of care provided by the insurance (translating into early and timely diagnosis and adequate treatment) is not guaranteed with complete coverage, as seems to be the case: to warrant rights to get access to expensive treatments and medication, as is usual in cancer, exceptional legal mechanisms are frequently launched in Colombia: technical-scientific committees of health assurers, and the legal call for protection—the so-called tutela.40 ,41 A study shows that those affiliated to the contributory regime are more likely to warrant additional rights more efficiently,41 potentially increasing inequalities between regimes. Also, clear differences in gastric cancer survival by type of health insurance affiliation have been documented in a population-based Colombian study, clearly illustrating that, even though in theory there is access to care for all, this does not translate to equal outcomes.14
In parallel with the increases in HIC, other changes in the Colombian healthcare system occurred, including increases in investments in care.5 ,42 Therefore, our results reflect the impact of the entire reform rather than only the increased coverage in health insurance. However, on the basis of our analyses, it is safe to conclude that all these reforms have not resulted in reducing inequalities in cancer mortality. This is not unique to Colombia; in several countries as diverse as Taiwan, Thailand and those in Europe, inequalities in health increased on reaching almost universal coverage.43–48
Strengths and weaknesses
This is one of the few studies investigating educational differences in mortality using population-based mortality and population-based educational level. Despite several strengths, some limitations should be considered in our study. We did not correct for misclassification within the cancer groups, but since we studied the group of cancer deaths overall, regardless of the subtype of cancer, most of these errors are cancelled out. In general, ‘cancer’ as cause of death is correctly coded,49 particularly in our setting of persons aged under 65 years.
Data on mortality were obtained from mortality registries, while data on the population distribution by education were obtained from censuses and demographic projections. This may have led to the so-called numerator/denominator bias, which generally results in an overestimation of disparities.17 Furthermore, for some years, data on population size were obtained from demographic projections combined with distributions of education from surveys. To assess the impact of this potential bias, we experimented with different education distributions from multiple data sources,50–52 showing that the overall trends in our study were robust to different assumptions on the distribution of education.3
Potentially, there has been substantial under-registration of deaths in some regions. Previous studies comparing national mortality rates with indirect estimates from the census53 ,54 suggest that under-registration is particularly important in the poorest regions, implying that estimates of disparities in mortality by educational level are likely to be an underestimation, because those with lower education are more likely to live in areas with higher under-registration rates. This may also have led to an underestimation of the extent to which inequalities have increased, because under-registration decreased over the study period.53 ,54 Our results therefore are indicative of potentially larger inequalities in mortality by education, which continue to increase.
Information on education was missing for 16.5% of cancer deaths, potentially leading to an underestimation of disparities, as missing values are usually more common in the least educated.55 However, we imputed values for educational level for individuals with missing educational information based on information on age, sex marital status, region and urban/rural residence, thereby limiting the potential impact of this source of bias.
Unanswered questions and future research
Socioeconomic inequalities in mortality of non-communicable diseases have been associated with the unequal distribution of behavioural risk factors, such as smoking, alcohol consumption, an unhealthy diet, a sedentary lifestyle and a higher risk of injuries.2 ,56 This implies underlying inequalities in exposure to risk factors and the incidence of these diseases. However, data on the incidence of disease and prevalence distribution of all those behavioural and poverty risk factors by socioeconomic status are largely lacking in Colombia and most developing countries. Studies on the mechanisms underlying the way these risk factors contribute to inequalities in mortality are scarce, even in developed countries. We previously described large inequalities in mortality of cancers with a primary infectious aetiology such as gastric cancer,3 but also documented inequalities in survival of gastric cancer measured both by type of health insurance and socioeconomic stratum.14 These findings indicate that both access and quality of care (health insurance) as other factors related to socioeconomic status independently affect survival for the lower socioeconomic classes negatively. Detailed studies are needed on both types of factors: which barriers exist for timely diagnosis and adequate treatment in situations with universal health coverage and how can they be tackled? On which other factors related to socioeconomic stratum can interventions be designed? The answers to these questions will be varied and, depending on the specific disease, will be quite different in character. It is of high importance that data on socioeconomic indicators are collected in a standard way so that, for example, cancer registries can calculate incidence rates by socioeconomic stratum, which, at this moment, is not possible in Colombia.57
Socioeconomic differences were substantially larger for women than for men; in our previous study, this difference was almost entirely attributable to inequalities in cervical cancer mortality.3 In this more recent study, we see that the gender inequalities grew despite the virtually universal HIC since 2008. Gender inequalities were larger for cancer than for other non-communicable diseases according to SII; more detailed analyses are needed to assess the extent to which the growing inequalities are due to an increase in cervical cancer mortality among the less favoured.
Conclusions
The recent negative curbs in mortality among the lowest educated groups, resulting in increasing differences between educational groups, are a call for attention by the Colombian health authorities to take measures in primary prevention, access to early detection and timely and adequate treatment. The underlying causes of the observed differences are multiple, from differences in housing, lifestyle, health-related beliefs, to differences in access to diagnostic facilities and high-quality treatment, all of which should be of concern to those in charge.58 Insurance coverage is clearly not enough to counterbalance the deleterious effects of decreases in spending on primary prevention and other social and economic conditions which determine the growing levels of educational inequalities in cancer.
Acknowledgments
The authors are grateful to Mauricio Avendaño and Alex Burdorf for their contributions at initial stages of the analyses and for their continued support in this project.
References
Footnotes
EdV and IA share first authorship and contributed equally.
Contributors EdV performed the joinpoint analyses, adapted tables and figures and contributed significantly by writing a major part of the manuscript. IA performed the main part of the analyses apart from the joinpoints, discussed with EdV all initial tables and figures, and commented on the text. CP contributed to the content and improvement of the text and figures.
Funding This research received no specific grant from any funding agency in the public, commercial or not-for-profit sectors. The salaries of the investigators were provided directly by their employers.
Competing interests None declared.
Ethics approval This article is based on secondary analysis of data on deaths and population counts in aggregate form made publicly available by the National Statistics Office in Colombia. Ethical approval for this study was not required.
Provenance and peer review Not commissioned; externally peer reviewed.
Data sharing statement No additional data are available.