Article Text

Abstract
Objectives There is now good evidence that central obesity carries more health risks compared with total obesity assessed by body mass index (BMI). It has therefore been suggested that waist circumference (WC), a proxy for central obesity, should be included with BMI in a ‘matrix’ to categorise health risk. We wanted to compare how the adult UK population is classified using such a ‘matrix’ with that using another proxy for central obesity, waist-to-height ratio (WHtR), using a boundary value of 0.5. Further, we wished to compare cardiometabolic risk factors in adults with ‘healthy’ BMI divided according to whether they have WHtR below or above 0.5.
Setting, participants and outcome measures Recent data from 4 years (2008–2012) of the UK National Diet and Nutrition Survey (NDNS) (n=1453 adults) were used to cross-classify respondents on anthropometric indices. Regression was used to examine differences in levels of risk factors (triglycerides (TG), total cholesterol (TC), low-density lipoprotein (LDL), high-density lipoprotein (HDL), TC: HDL, glycated haemoglobin (HbA1c), fasting glucose, systolic (SBP) and diastolic blood pressure (DBP)) according to WHtR below and above 0.5, with adjustment for confounders (age, sex and BMI).
Results 35% of the group who were judged to be at ‘no increased risk’ using the ‘matrix’ had WHtR ≥0.5. The ‘matrix’ did not assign ‘increased risk’ to those with a ‘healthy’ BMI and ‘high’ waist circumference. However, our analysis showed that the group with ‘healthy’ BMI, and WHtR ≥0.5, had some significantly higher cardiometabolic risk factors compared to the group with ‘healthy’ BMI but WHtR below 0.5.
Conclusions Use of a simple boundary value for WHtR (0.5) identifies more people at ‘early health risk’ than does a more complex ‘matrix’ using traditional boundary values for BMI and WC. WHtR may be a simpler and more predictive indicator of the ‘early heath risks’ associated with central obesity.
- PUBLIC HEALTH
This is an Open Access article distributed in accordance with the Creative Commons Attribution Non Commercial (CC BY-NC 4.0) license, which permits others to distribute, remix, adapt, build upon this work non-commercially, and license their derivative works on different terms, provided the original work is properly cited and the use is non-commercial. See: http://creativecommons.org/licenses/by-nc/4.0/
Statistics from Altmetric.com
Strengths and limitations of this study
The use of the waist-to-height ratio (WHtR) addresses a current dilemma of how best to identify ‘early health risk’ with a very simple, low cost, anthropometric measure.
The predictive value of WHtR is backed by systematic reviews and meta-analyses in many different populations.
The analysis of cardiometabolic risk factors within the group with ‘healthy’ body mass index (BMI) shows that some of these factors are significantly increased if WHtR ≥0.5, thus supporting the definition of WHtR >0.5 as an indicator of ‘early health risk’.
Very few studies have addressed the comparison of WHtR with any ‘matrix’ based on BMI and waist circumference for identifying cardiometabolic risk. We have only been able to compare our results directly with data from one other country. We hope this paper will act as a stimulus for further cost-effective analysis of existing data sets.
Background
Anthropometric proxies for central obesity, as opposed to total obesity, assessed by body mass index (BMI), are usually associated with, and are slightly better predictors, of increased levels of health risk factors in populations of all ages.1–4 However, there have been some studies which showed that anthropometric indicators for total and central obesity did not, for example, differ in their predictive abilities.5–8
In most of the above studies, waist circumference (WC) and waist-to-hip ratio (WHR)9 have been used as proxies for central obesity. Waist-to-height ratio (WHtR) is a proxy for central (visceral) adipose tissue,10 ,11 which has recently received attention as a marker of ‘early health risk’.
A boundary value of WHtR 0.5 as a risk assessment tool was first suggested 20 years ago, and this translates into the simple message ‘keep your waist to less than half your height’.12–15 This boundary value has been used around the world, and findings in many populations have supported the premise that WHtR is a simple and effective anthropometric index to, for example, identify health risks.16–22 As well as its close relationship with morbidity, WHtR also has a clearer relationship with mortality compared with BMI.23
We have previously shown that using BMI as a sole indicator of risk would mean that 10% of the whole UK population, and more than 25% of the UK population who are judged to be of ‘healthy’ weight using BMI, are ‘misclassified’ and might not be alerted to the need to take care or to take action.15 ,24
The National Institute for Health and Care Excellence (NICE) tried to overcome this limitation of BMI by suggesting that WC is measured alongside BMI.25 Public Health England has built on this suggestion to produce a comprehensive cross-classification matrix to categorise risk.26 For simplicity and clarity, we will refer to this as the ‘matrix’. In recent guidance, NICE has advised ‘Think about using waist circumference, in addition to BMI, in people with a BMI less than 35 kg/m2’.27 Earlier in 2015, indications were given that NICE wish to study research on WHtR for guidance due to be published in 2017.28 Our aim was to assist NICE by comparing risk estimated by the ‘matrix’ with that estimated by WHtR.
Methods
We used recent data from 4 years of the UK National Diet and Nutrition Survey (NDNS) (2008–2012).29 The NDNS is the most authoritative source of quantitative information on the food habits and nutrient intake of the UK population. Jointly funded by the Department of Health in England (now Public Health England) and the Food Standards Agency, the results are used by government to develop policy and monitor trends in diet and nutrient intakes. Households were sampled from the UK Postcode Address File, with one adult and one child (18 months or older), or one child selected for inclusion.
We used the nurse weights for the sample (variable wt_Y1234), which adjust for unequal selection, non-response to the household/main food provider (MFP), and individual interviews and non-response to the nurse visit. Full details are given in appendix B of the survey documentation: http://doc.ukdataservice.ac.uk/doc/6533/mrdoc/pdf/6533_ndns_rp_yr1–4_userguide.pdf.
To derive the non-response weights, logistic regression modelling was used to generate a predicted probability for each participant that they would take part in the nurse's interview based on their personal and household characteristics. These predicted probabilities were then used to generate a set of non-response weights; participants with a low predicted probability got a larger weight, increasing their representation in the sample.
Participants completed a detailed computer assisted personal interview to obtain background information (age, gender, ethnicity, region), and eating and lifestyle behaviours such as smoking, dieting to lose weight, medication and supplement use. Anthropometric measurements (weight, height, WC) were taken by trained nurses. Weight (in bare feet and minimal clothes) was measured to the nearest 100 g using calibrated scales. Height was measured with a portable stadiometer with the head in horizontal Frankfort plane. WC was measured with a tape measure at the point midway between the iliac crest and the costal margin (lower rib). Fasting blood samples were obtained and two tubes for each participant were sent to Cambridge Addenbrooke's for immediate analysis. Further detail of blood sampling and analysis are detailed in appendix O of survey documentation. Data files from 4 years (2008 to 2012) of the NDNS Rolling Programme were obtained under licence from the UK Data Archive (http://www.esds.ac.uk).
Classification of respondents by anthropometric indices (BMI, WC, WHtR)
Boundary values for WC within the ‘matrix’ were: low (men: <94 cm, women: <80 cm); high (men: 94–102 cm, women: 80–88 cm); very high (men: >102 cm, women: >88 cm). For BMI, underweight (<18.5 kg/m2); healthy weight (18.5–24.9 kg/m2); overweight (25–29.9 kg/m2); obese (30–39.9 kg/m2); very obese (>40 kg/m2).
The ‘matrix’ of WC and BMI categorises health risk as: ‘no increased risk’, ‘increased risk’, ‘high risk’ and ‘very high risk’. ‘No increased risk’ was assigned to healthy weight combined with low or high WC, and also to overweight combined with low WC. ‘Increased risk’ was assigned to healthy weight combined with very high WC, to overweight combined with high WC, to overweight combined with high WC, and to obese combined with low WC. ‘High risk’ was assigned to overweight combined with very high WC, and to obese combined with high WC. Very high risk was assigned to obese combined with very high WC, and also to very obese with any category of WC.
We combined the ‘matrix’ categories of ‘increased risk’ and ‘high risk’ to obtain 3 tiers with similar numbers of adults, for comparison with the 3 tiers of WHtR based on the following boundary values: ‘no increased risk’ (WHtR <0.5), ‘increased risk’ (WHtR ≥0.5 and <0.6) and ‘very high risk’ (WHtR ≥0.6).
The classification was based on all adults with data on BMI and WC (and WHtR) (n=1453). Data were weighted to take account of differential responses to the nurse's visit.
Linear models to assess independent association of WHtR among ‘healthy’ weight adults
Regression models (GLM procedure in SPSS) were used to estimate the independent effect of WHtR on cardiovascular disease risk factors as outcome variables. WHtR was entered as a bivariate (<0.5 vs ≥0.5), and the models were first adjusted for age and sex, and then additionally for BMI. Interactions were not significant and were excluded from the final models. Numbers were as follows: adults with BMI in the ‘healthy’ range (n=490) (333/157 for WHtR <0.5 vs ≥0.5). Two-thirds of these provided samples for analysis (213/114 for total cholesterol (TC), high-density lipoprotein (HDL) and low-density lipoprotein (LDL)), other numbers are shown in tables 1 and 2.
Classification of risk category in all participants by the ‘matrix’, based on BMI and waist circumference, by WHtR, and by both
Characteristics of adults* with ‘healthy’ body mass index (BMI)† according to waist-to-height ratio (WHtR) 0.5
Results
Classification of participants
The ‘matrix’ categorised 41% of the NDNS adult population sampled as ‘no increased risk’, 32% as ‘increased risk’ or ‘high risk’, and 26% as ‘very high risk (figure 1 and column b in table 1); values for men and women, respectively, 42%, 34%, 24%, and 40%, 30%, 28%, (not shown). WHtR categorised the adult population as 29% ‘no increased risk’, 44% ‘increased risk’ and 27% of the population as ‘very high risk’ (see figure 1). Values for men and women, respectively, were 24%, 48%, 28% and 34%, 40%, 26%, not shown in figure 1.
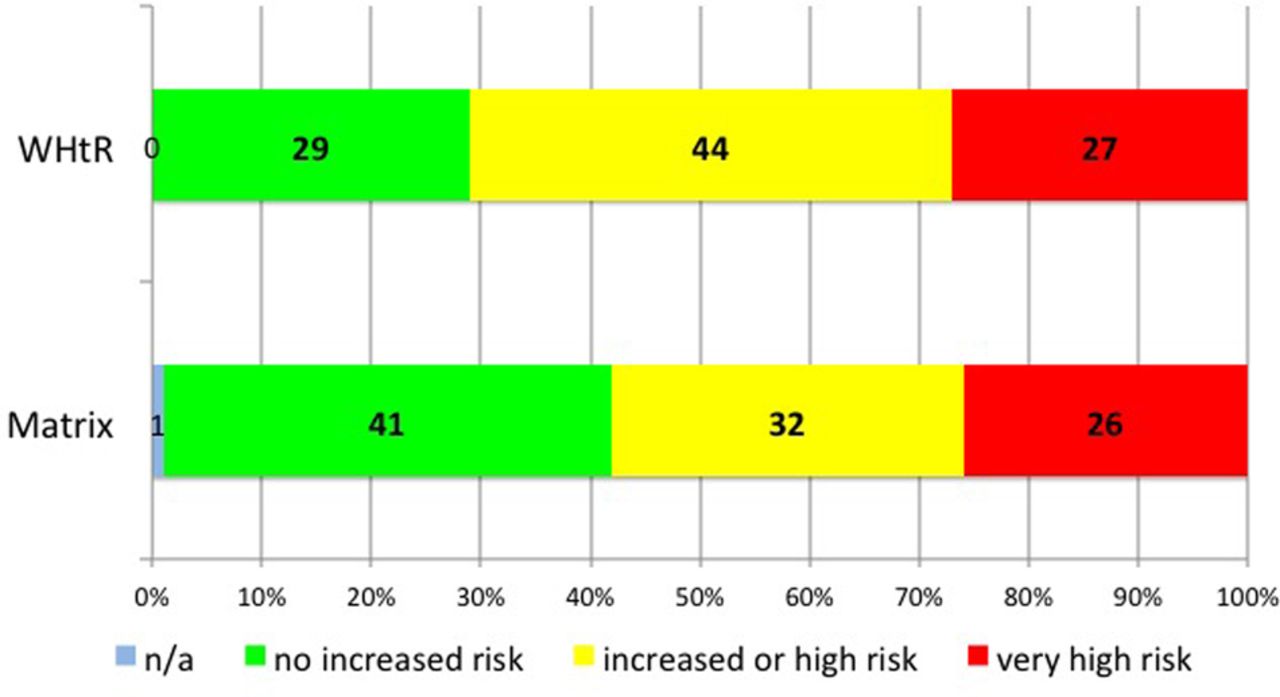
Categorisation of risk category of all participants by waist-to-height ratio (WHtR) and by the ‘matrix’. WHtR: green = ‘no increased risk, WHtR <0.5, (29%), yellow = ‘increased risk’, WHtR ≥0.5 to <0.6,) (44%) and red = ‘very high risk’, WHtR 0.6+, (27%). The‘ matrix’: blue = ‘not applicable/underweight’ (1%) green = ‘no increased risk’ (41%), yellow = ‘increased’ and ‘high risk’ (32%) and red = ‘very high risk’ (26%).
Of greater importance, the cross tables analysis in table 1 (column d) showed that more than one-third (35%) of the adult group who were judged to be at ‘no increased risk’ according to the ‘matrix’, had WHtR ≥0.5, and might not be alerted to the need to take care or to take action (44% and 26% for men and women, respectively, not shown). On the contrary, table 1 (column c) shows that only 3% of the group, who would be at ‘increased risk’ according to the ‘matrix’, were judged to be at ‘no increased risk’ using WHtR. Values for men and women, respectively, were 1% and 6%, not shown in figure 1. Figure 2 shows this cross tables analysis graphically for all adults.

Percentage of participants who have waist-to-height ratio (WHtR) ≥0.5 and ≥0.6 within different categories of the ‘matrix’. Vertical columns denote risk by the 'matrix’: ‘not applicable’; ‘no increased risk’, ‘increased’ and ‘high risk’ and ‘very high risk’. Colours within vertical columns denote risk by WHtR: green = ‘no increased risk’ (WHtR <0.5), yellow = ‘increased risk’ (WHtR ≥0.5 to <0.6) and red = ‘very high risk’ (WHtR ≥0.6).
Cardiometabolic risk factors of participants with ‘healthy BMI’ divided according to WHtR below and above 0.5
The classification analysis reported above showed that WHtR 0.5 classified more participants as being at ‘early increased’ risk than the ‘matrix’. However, the ‘matrix’ only classifies those with a combination of very high WC and overweight by BMI as being at ‘increased’ risk. People with ‘healthy’ BMI and high WC are defined as being at ‘no increased’ risk. On the contrary, classification on the basis of WHtR designates those with WHtR ≥0.5, as carrying an ‘increased risk’, irrespective of BMI status.
We were therefore keen to investigate the people within the ‘healthy’ BMI range (18.5–24.9 kg/m2), and we did this by comparing cardiometabolic risk factors in these adults according to their WHtR status.
Table 2 shows the characteristics of the adults with BMI in the ‘healthy’ range when they were divided, according to WHtR, below and above 0.5. Those with WHtR ≥0.5 were older than those with WHtR <0.5 (p<0.001), and had higher mean BMI (p<0.001). Hence, we adjusted for age and BMI (and also for sex) in regression models.
Table 3 shows that all the cardiometabolic risk factors studied were the same or indicated lower risk in the group with WHtR<0.5. The differences for four of the risk factors, (HDL-cholesterol, TC to HDL-cholesterol ratio, triglycerides and systolic blood pressure (SBP)) reached statistical significance (p<0.05) when adjustment was made for age and sex. When further adjusted for BMI, as well as age and sex, three of these cardiometabolic risk factors retained statistical significance (p<0.05). This showed that the differences in cardiometabolic risk factors were not due to the higher BMI in the group with WHtR ≥0.5.
Cardiometabolic risk factors for those with ‘healthy’ BMI* according to WHtR 0.5
Discussion
Although BMI, WC and WHtR are, by their very nature, strongly correlated,24 ,30 the more important question is to ask which anthropometric proxy measure is the simplest and most accurate in helping to indicate ‘early health risk’.
Our classification analysis showed WHtR ≥0.5 classified more participants as being at ‘early increased’ risk than the ‘matrix’. Men were more likely than women to fall into this early ‘increased’ risk category, probably because of their greater propensity to central obesity.
We are unaware of any other UK study where risk identified by WHtR has been compared with the same ‘matrix’. The New Zealand (NZ) Ministry of Health performed a similar comparison with their National Survey data.31 They showed that, whereas 48% of men were identified as at ‘no increased risk’ by the ‘matrix’, only 29% were classed as ‘no increased risk’ by WHtR <0.5. The comparable values for women were 44% by ‘matrix’ and 41% by WHtR <0.5. In other words, the NZ data also showed that WHtR 0.5 classified more people, particularly men, as being at ‘early increased risk’ compared with the ‘matrix’.
Our analysis of the cardiometabolic risk factors in the ‘healthy’ BMI group made it clear that the people who have a BMI in the ‘healthy’ range, but have WHtR >0.5, had risk factor levels that were less favourable than those in the ‘healthy’ BMI range with WHtR <0.5 (table 3 and figure 3). These results have prompted us to suggest that WHtR is an independent indicator of ‘early health risk’ after adjustment for age, sex and BMI. Given the small sample size, not all differences were statistically significant but future rounds of the NDNS rolling programme will offer increased power. Additionally, larger data sets could be used to test the validity and generalisability of our conclusions.

Participants with ‘healthy’ body mass index (BMI) divided according to waist-to-height ratio ≥0.5. Means for high-density lipoprotein (HDL) cholesterol and the ratio of total cholesterol: HDL cholesterol were statistically different (p<0.05) when adjusted for sex, age and BMI.
There is good evidence from around the world for the metabolic implications of misclassification by BMI alone: a study of adults in Singapore found that WHtR ≥0.5 identified the highest proportion of all the cardiometabolic risk factors in men and women, even higher than a combination of BMI and WC.32 In the USA, the Bogalusa heart study of children aged from 4 to 18 years showed that nearly 10% of the children who were ‘healthy’ by BMI, had WHtR >0.5, and that these children had raised cardiometabolic risk factors.33 A study using NHANES data also showed that children from 5 to 18 years with ‘healthy’ BMIs exhibited raised cardiometabolic risk factors if their WHtR was above 0.5.18 In Korea, the National Health and Nutrition Examination Survey showed there to be more medical concerns for the adolescents in the ‘healthy’ weight group with central obesity (defined on the basis of WHtR) than the ‘healthy’ weight group without central obesity.34 Further, prospective data from the ALSPAC study in UK has shown that WHtR in children aged 7–9 years predicts adolescent cardiometabolic risk better than BMI.35
Our results in table 3 included an analysis where the values for the cardiometabolic risk factors were adjusted for BMI as well as age and sex. Most studies, for example,18 ,24 ,33 do not take this ‘belt and braces’ approach when comparing those with WHtR below and above 0.5. However, it was reassuring that three out of four risk factors remained statistically different (p<0.05) even when this approach was taken. The risk factors which retained significance were HDL-cholesterol, total cholesterol: HDL-cholesterol and SBP. This gives confidence that the above-cited papers, and many others, contain valid results.
We have previously investigated adults in the NDNS24 and also in the Health Survey for England,36 and shown that both men and women in the group who have BMI in the ‘healthy’ range, but who have WHtR ≥0.5, have increased cardiometabolic risk factors, not only when they are compared with participants with ‘healthy’ BMI and WHtR <0.5, but even when they are compared with participants classified as overweight by BMI, who have WHtR <0.5.
The results from the cross tables analysis of our data in table 1 can be extrapolated to estimate that 14% of the whole UK adult population would be ‘missed’ using the ‘matrix’. In terms of numbers of people, and estimating the UK adult population as 48 million, this translates to nearly seven million adults who would be classified as at ‘no increased risk’ by the ‘matrix’, but would have ‘early increased cardiometabolic risk’ identified by WHtR ≥0.5.
Although our own analysis was on data from adults, many other studies suggesting the potential use of WHtR as an indicator of ‘early health risk’ have been performed on children or adolescents.33–35 There are indications that WC has increased more rapidly than BMI,37 and future predictions are that this gap will widen further38 reflecting the increase in central, rather than total, obesity. Ensuring that a child's WC does not exceed half his/her height can be monitored in the community and by parents. They will not even need a tape measure or weighing scales: a piece of string will suffice.15 ,39 In fact, this simple method is already recommended for self-monitoring in Thailand where the Royal Thai Ministry of Public Health has launched a campaign for adults and children to use WHtR for health promotion and prevention programmes.21
In terms of cost effectiveness, measuring BMI requires weighing scales as well as a stadiometer for measuring height; WHtR requires a tape measure and stadiometer. Since a tape measure is cheaper and more portable than weighing scales, we assume that the use of WHtR will be more cost effective. If the assessor only wishes to know if the participant has a WHtR at or below 0.5, the tape can be replaced by an ordinary piece of string,21 and the methodology becomes even more cost effective.
Conclusions and implications
WHtR is a simple primary screening risk assessment tool that identifies more people at ‘early health risk’ than a ‘matrix’, which uses a combination of BMI and WC. We recommend that the ‘matrix’ be amended to show that having a high WC even in the ‘healthy’ range of BMI, carries ‘increased’ risk. However, we believe that serious consideration should be given to the use of WHtR to replace the ‘matrix’.
Of course, any anthropometric measure is only the first step in identifying people at ‘early health risk’. More complex risk scores (eg, for diabetes) include further risk factors such as sex, age, ethnicity, socioeconomic status, and family history. Further screening for clinical risk factors should follow for those deemed at risk by these simpler measures.
Our results fully support an opinion expressed very recently: ‘… clinicians should look beyond BMI. Although assessing for total fat mass with BMI to identify patients at greater cardiovascular risk is a good start, it is not sufficient’.40 It is therefore timely that, in the UK, NICE intends to investigate the potential use of WHtR.28
Acknowledgments
The authors wish to thank Dr Kirsten Rennie for additional statistical advice on the manuscript.
References
Footnotes
Twitter Follow Margaret Ashwell @minashwell and Sigrid Gibson @sigridgibson
Contributors Both authors conceived the article and drafted the manuscript. SG analysed data from the NDNS. Both authors agreed the final manuscript.
Competing interests MA devised and copyrighted the Ashwell Shape Chart which is distributed to health professionals on a non-profit-making basis.
Provenance and peer review Not commissioned; externally peer reviewed.
Data sharing statement No additional data are available.