Article Text

Abstract
Objectives Systematic review and meta-analysis on the diagnostic accuracy of temporal artery thermometers (TAT).
Design Systematic review and meta-analysis. The index test consisted of temperature measurement with TAT. The reference test consisted of an estimation of core temperature.
Participants Clinical patients as well as healthy participants, with or without fever.
Interventions Literature search in PubMed, Embase, Cinahl and Web of Science. Three reviewers selected articles for full-text reading after which a further selection was made. Risk of bias was assessed with QUADAS-2. Pooled difference and limits of agreement (LoA) were estimated with an inverse variance weighted approach. Subgroup and sensitivity analyses were performed. Sensitivity and specificity were estimated using hierarchical models. Quality of evidence was assessed according to the GRADE system.
Primary and secondary outcome measures The primary outcome was measurement accuracy expressed as mean difference ±95% LoA. A secondary outcome was sensitivity and specificity to detect fever. If tympanic thermometers were assessed in the same population as TAT, these results were recorded as well.
Results 37 articles comprising 5026 participants were selected. Pooled difference was -0.19°C (95% LoA −1.16 to 0.77°C), with moderate quality of evidence. Pooled sensitivity was 0.72 (95% CI 0.61 to 0.81) with a specificity of 0.94 (95% CI 0.87 to 0.97). The subgroup analysis revealed a trend towards underestimation of the temperature for febrile patients. There was a large heterogeneity among included studies with wide LoA which reduced the quality of evidence.
Conclusions TAT is not sufficiently accurate to replace one of the reference methods such as rectal, bladder or more invasive temperature measurement methods. The results are, however, similar to those with tympanic thermometers, both in our meta-analysis and when compared with others. Thus, it seems that TAT could replace tympanic thermometers with the caveat that both methods are inaccurate.
Trial registration number CRD42014008832.
- INFECTIOUS DISEASES
- INTERNAL MEDICINE
- PRIMARY CARE
This is an Open Access article distributed in accordance with the Creative Commons Attribution Non Commercial (CC BY-NC 4.0) license, which permits others to distribute, remix, adapt, build upon this work non-commercially, and license their derivative works on different terms, provided the original work is properly cited and the use is non-commercial. See: http://creativecommons.org/licenses/by-nc/4.0/
Statistics from Altmetric.com
Strengths and limitations of this study
With 37 studies and 5026 study participants, this is the largest summary of the evidence for temperature measurements at the temporal artery.
The sensitivity analysis did not change the overall result notably.
A weakness is the large heterogeneity among included studies.
Introduction
Body temperature is one of the most commonly used parameters in healthcare. For this, reliable equipment must be used. There is no universal agreement on how accurate a thermometer must be, but the method is generally considered accurate and reliable if the mean difference is less than 0.2 to 0.5°C and the limits of agreement (LoA) are less than ±0.5°C.1–3 Reference methods for temperature measurement have traditionally been rather invasive with measurements taken from the nasopharynx, oesophagus, pulmonary artery, brain or urinary bladder. There is thus a need to find a less invasive method for body temperature measurement as a replacement for the ‘reference’ methods.
Temperature measurement over the temporal artery (TAT, temporal artery thermometry) is a method for temperature measurement that uses infrared technology to detect the heat that is radiated from the skin surface over the temporal artery.
For many years, rectal measurements have been used as the clinical reference method with an acceptable balance between accuracy and degree of invasiveness. Recently, it has to a large degree been replaced by infrared ear thermometry, measuring at the tympanic membrane. However, this method is regarded as suboptimal, mainly because of poor repeatability and a tendency to show false low results compared with core temperature.4–6
Previous literature reports have given mixed results of the value of TAT, and there are no recent systematic reviews of the method. The purpose was thus to perform a systematic literature review and meta-analysis of the measurement accuracy of TAT compared with reference temperature. A secondary aim was to compare the accuracy of TAT and tympanic temperature measurement when both temperatures were measured on the same samples.
The study was designed as a systematic review.
Method and materials
This systematic review has been registered in the PROSPERO International prospective register of systematic reviews (http://www.crd.york.ac.uk/PROSPERO), CRD42014008832.
Study identification
A literature search was performed by a librarian in the electronic databases PubMed/MEDLINE (search string “(temporal artery) AND (((temperature) OR thermometer) OR fever)”), Embase, Cinahl, Web of Science, The Cochrane Library, Trip, International Network of Agencies for Health Technology Assessment (INAHTA) and Centre for Reviews and Dissemination (CRD). Ongoing studies were searched via ClinicalTrials.gov. Reference lists of included studies were checked. The paper is based on the systematic search of literature published up to 29 September 2015.
Study selection and quality assessment
Three reviewers read all titles and abstracts independently. Obviously irrelevant articles were removed, whereas the full text of the potentially relevant articles was retrieved and assessed on the basis of the eligibility criteria for the inclusion in the current review. Disagreements were solved in consensus.
For selecting a study, all of these inclusion criteria should be fulfilled: (A) primary study; (B) temperature measurement at the temporal artery; (C) comparison with core temperature; (D) study performed in a healthcare setting. Exclusion criteria were (A) non-human studies; (B) review articles, editorials, letter or congress abstracts; (C) insufficient data to report or calculate bias or sensitivity/specificity; (D) language other than English, French, German or one of the Nordic languages.
The subject matter was delimited according to PICO7 (population—intervention (index test)—comparison (reference test)—outcome) to clinical patients as well as healthy participants, with or without fever. The index test consisted of temperature measurement with TAT. The reference test consisted of an estimation of reference temperature, expressed as measurement in the nasopharynx, oesophagus, pulmonary artery, rectum, brain and urinary bladder. However, participants received verification with the same reference standard within each study.
All included studies were assessed for methodological quality by three independent reviewers according to QUADAS-2.8 Disagreements were solved in consensus. Most focus was laid on the domain Flow and Timing since the timing between temperature measurements was deemed to be the most crucial part. The process of recording the temperature consisted simply of recording a figure, so blinding was not deemed to be as important.
Outcomes
The primary outcome was measurement accuracy of the index test compared to a reference standard, expressed as pooled estimates of mean temperature difference (systematic error) and 95% LoA (random error). The secondary outcome was average summary estimates of test sensitivity (SE) and specificity (SP) at a chosen test threshold. If tympanic thermometers had been assessed in the same population as the TAT, these results were recorded as well.
Data extraction
Two reviewers independently extracted the relevant data and resolved disagreements through discussion with other reviewers.
From each included study, we retrieved information on study and patient characteristics, type of the index test thermometer, reference standard and information on comparator test, if available, and relevant statistics: mean difference (TAT—reference) and SD of the differences in temperature readings. Mean differences and SD reported in Fahrenheit were converted into Celsius. When mean differences and/or SD of the differences were not directly reported, we computed them from other reported data using standard formulae. Thus, SD of the mean difference was computed from CIs, range of differences, SD for each thermometer and the correlation coefficient, or mean difference and t-statistic. In one study, the mean difference and SD were estimated after extracting individual values from the figures. When possible, we also extracted paired estimates of sensitivity and specificity.
Data analysis
Mean difference in temperature readings
To obtain pooled estimates of systematic error (bias) and random error (LoA), we used the inverse variance weighted approach to combine individual study estimates of the mean difference and SD. More details on the techniques used in this meta-analysis can be found in Williamson et al.9
Pooled estimates of the differences and limits of agreement were calculated using a random-effects approach.10
To explore possible reasons for heterogeneity, we performed subgroup analyses. We hypothesised a priori that age, type of thermometer, presence/absence of fever and reference standard may be sources of heterogeneity across studies, and performed subgroup meta-analyses according to these characteristics where sufficient data were available.
Several sensitivity analyses were performed in various combinations excluding studies with a high risk of bias (in the domain Flow and Timing); studies that used replicated data in pairs using differences for each pair of measurements and did not provide information on how they accounted for within-person correlation of observations11; or studies lacking information on whether SD of the difference was corrected,11 ,12 when means of repeated measurements by each of the two methods on the same participant were used to evaluate the agreement between the two methods (see online supplementary appendix for details).
Supplementary appendix
Sensitivity and specificity
We used coupled forest plots and a summary receiver operating characteristics (sROC) plot to display SE and SP estimates from individual studies, and obtained average summary estimates of SE and SP from studies that reported results at selected common positivity thresholds (t≥38.0°C) using bivariate random-effects meta-analysis.13 The bivariate model jointly analyses pairs of SE and SP to account for the patterns of correlation between the two measures. To check the robustness of the results, we performed sensitivity analysis by excluding influential studies and outliers. We used Cook's distance to identify influential studies and standardised level-2 residuals to identify outliers.14 ,15 We did not investigate publication bias, since standard tests for publication bias are not recommended in meta-analysis of diagnostic accuracy studies.16
Statistical analysis was performed using Stata 12/SE, including the user written programmes.14 ,15 A Stata programme, has been written incorporating formulae described in Williamson et al9 to obtain the pooled estimate of systematic error and LoA utilising random-effects methods.
Quality of evidence (GRADE)
We assessed the quality of evidence for the estimation of pooled difference and LoA according to the GRADE system taking into account risk of bias, consistency, directness, precision and publication bias.17
Health economy
A simplified health economic assessment was performed, comparing TAT and tympanic measurements. The time for performing measurements was assumed to be equal for the two thermometers.3
Results
The literature search resulted in 626 hits. Another 27 articles were added after a manual search of reference lists. After duplicate removal, 558 articles remained. Of these, 97 articles were selected for full-text reading. Thirty-seven of these fulfilled the inclusion and exclusion criteria and were selected for final analysis. Of these, the decision was unanimous in 34 cases. Two reviewers agreed on two cases, and in the final included case only one reviewer initially advocated inclusion. The selection process is shown in figure 1. Study characteristics are shown in table 1.
Study characteristics of the 37 included studies
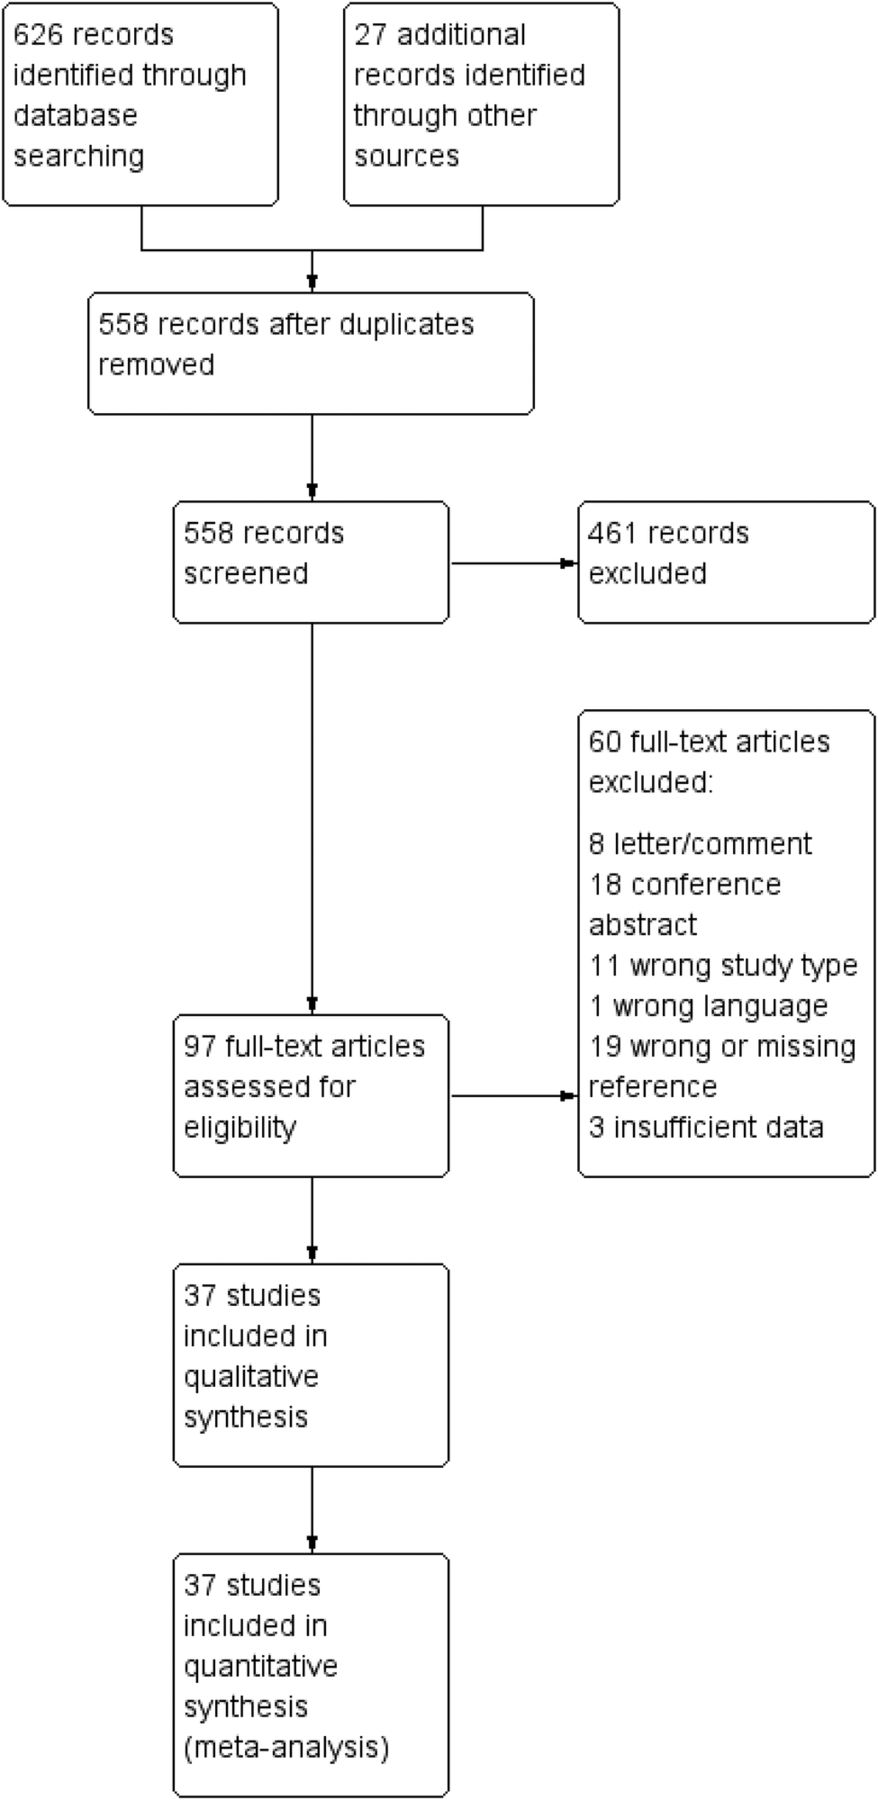
Study flow diagram.
A literature search in The Cochrane Library resulted in six hits, including two primary studies, of which one was included via the primary search.1 The search of ClinicalTrials.gov resulted in nine studies, of which seven were completed, one cancelled and one awaiting start of recruitment. One of the completed studies has been published.48 The search of the Trip database contributed nothing new while CRD gave three reviews but no new primary studies.
Risk of bias
The risk of bias and applicability concerns are summarised in figure 2. In general, the patient selection consisted of convenience samples that were not consecutive or randomised. Financial support was regarded as a possible source of publication bias. Seven articles reported support by grants from manufacturers.19 ,28 ,29 ,31 ,40 ,46 ,50 Another five studies were supported with instruments from the manufacturers.1 ,20 ,22 ,42 ,47

Risk of bias and applicability concerns summary.
Pooled mean difference in temperature readings
The 37 included articles comprise altogether 5026 study participants, 1301 adults and 3725 children. Thirty-six articles reported mean differences from the reference method, and some provided estimates for different subgroups resulting in 43 comparisons. The overall random-effects pooled mean difference in temperature readings from these 43 comparisons was −0.19°C (95% LoA −1.16 to 0.77°C) (figure 3).

Mean temperature difference (temporal artery thermometer –reference standard) and 95% limits of agreement by febrile status.
Subgroup and sensitivity analyses
There was a trend towards larger differences from the reference for febrile patients, with an underestimation of the temperature, mean difference −0.31°C (95% LoA −1.22 to 0.59°C), while the afebrile group was closer to the reference, mean difference 0.07°C (95% LoA −0.72 to 0.86°C) (figure 3). The results for adult and children subgroups were almost identical, mean difference −0.20°C (95% LoA −1.17 to 0.76°C) for children and −0.17°C (95% LoA −1.14 to 0.79°C) for adults (table 2). Grouping by reference standard did not show any differences. When grouping by type of TAT, the TAT-5000 thermometer (22 comparisons) had a result similar to all others.
Estimates of the pooled mean difference and 95% LoA between the temporal artery thermometer and reference standard. Random-effects meta-analysis*
Excluding studies with an ‘Unclear’ or ‘High’ risk of bias in the domain Flow and Timing, or studies lacking information on how they dealt with multiple measurements on the same participant, did not change results notably (pooled differences ranging from −0.09 to −0.19°C; see online supplementary appendix for details).
Average summary estimates of SE and SP at the t≥38.0°C cut-off value
Sixteen articles reported data on SE and SP. The SE varied between 0.26 and 0.94 while the SP varied between 0.46 and 1.00. The cut-off for test positivity ranged from t>37.8 to t≥39.0°C.
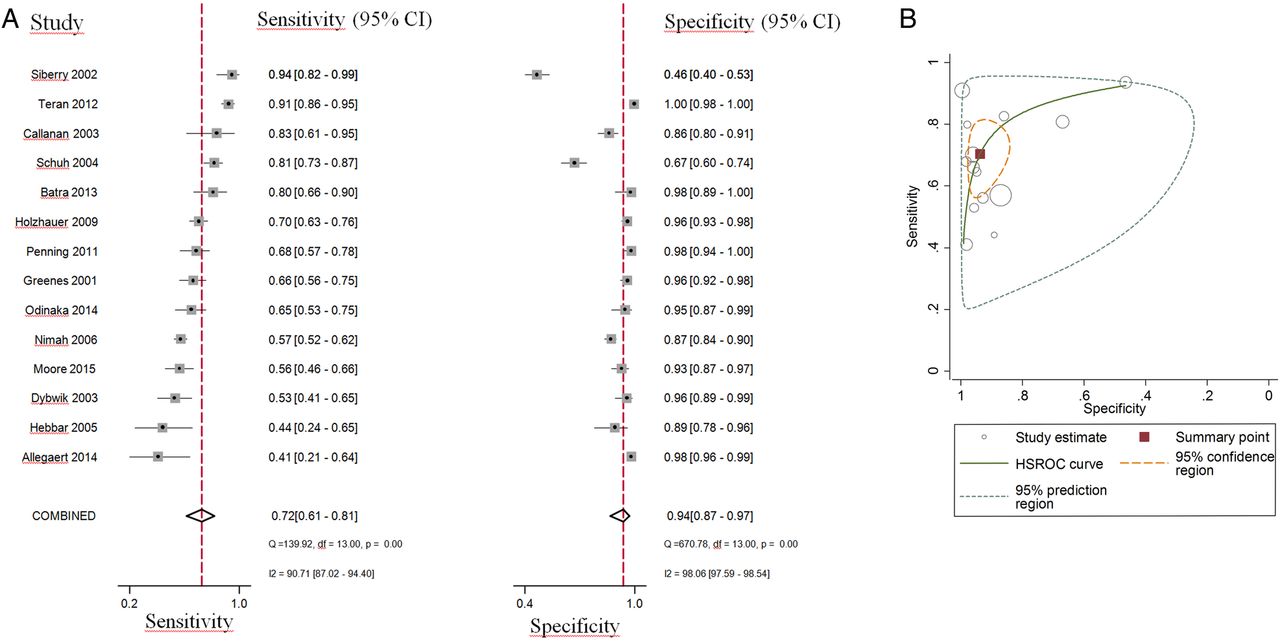
We pooled the results from 14 studies (1 adult and 13 paediatric) including 1568 participants with fever, and 2566 participants without fever to estimate summary estimates of SE and SP at the t≥38.0°C threshold. The reference test was rectal temperature in 13 studies, and bladder temperature in 1 study. SE and SP estimates and their 95% CI from each of these studies are displayed using coupled forest plots (figure 4A). The sROC plot (figure 4B) shows the 95% confidence and prediction regions. There was substantial heterogeneity for both SE and SP with greater variability in estimated SP than SE across studies. Bivariate random-effects meta-analysis produced the following summary estimates: SE 0.721 (95% CI 0.610 to 0.810), SP 0.939 (95% CI 0.865 to 0.973), positive likelihood ratio 11.8 (95% CI 5.3 to 26.1), and negative likelihood ratio 0.30 (95% CI 0.21 to 0.42). Since most studies had fewer participants with fever than without fever, estimates of SP are more precise than those of SE.

Accuracy of temperature measurement with a temporal artery thermometer measured through sensitivity and specificity. Pooled estimates obtained by a bivariate random-effects model (A) Coupled forest plot, (B) Summary receiver operating characteristics plot of sensitivity and specificity at t≥38.0°C cut-off value. Each circle shows individual study estimates; inner ellipse represents 95% confidence region, and outer ellipse represents 95% prediction region for a future study.
On the basis of Cook's distance, we found the studies by Teran et al51 and Siberry et al47 to be the most influential in the meta-analysis (in descending order) (figure 5). Of these, Teran et al was identified as an outlier having the highest standardised residuals for SP (figure 5). After refitting the model and leaving this study out, bivariate random-effects meta-analysis produced the following summary estimates: SE 0.690 (95% CI 0.590 to 0.780) and SP 0.92 (95% CI 0.84 to 0.96).

Influential and outlying studies.
Comparison with tympanic thermometers
Eleven articles included comparison with tympanic thermometers in the same population, comprising 1764 participants. In these articles, the mean difference from the reference method for TAT was −0.06°C (95% LoA −0.92 to 0.79°C) and for tympanic thermometers it was −0.29°C (95% LoA −1.15 to 0.57°C).
Four articles reported SE and SP for TAT and tympanic thermometers at the t≥38.0°C threshold in the same population, 734 participants.18 ,21 ,28 ,40 The results were similar with SE 0.70 (95% CI 0.28 to 0.93) and SP 0.99 (95% CI 0.85 to 1.00) for tympanic thermometers.
Quality of evidence (GRADE)
The quality of evidence was graded for the overall result of pooled difference from the reference method with LoA. The quality level was rated down by one point due to inconsistency between the trials (point estimates ranging from −1.50 to 0.66°C). We considered that having support from manufacturers was not enough risk to downgrade on publication bias. This resulted in a moderate evidence quality (⊕⊕⊕O) for a 95% LoA of −1.16 to 0.77°C (table 3).
GRADE evidence profile
Economic analysis
The local procurement price for the TAT is SEK 4200, and for a tympanic instrument it is SEK 895. For the tympanic instrument, a single-use protective cover is needed. With an interest rate of 2% and an assumed depreciation time of 6 years for the TAT and 4 years for the tympanic instrument, the cost per measurement would be equal at about 1100 measurements per year. For fewer measurements per instrument, the tympanic instrument would be cheaper.
Discussion
The present meta-analysis indicates that TAT has a pooled difference from the reference of −0.19°C with 95% LoA −1.16 to 0.77°C or about ±1.0°C. Common criteria for what is a clinically acceptable deviation from the reference temperature have been reported as LoA less than±0.5°C.1 ,2 TAT exceeds this level considerably, and it cannot be recommended as a replacement for one of the reference methods. The diagnostic accuracy was, however, very similar when compared with tympanic thermometers in the same participants. The subgroup analysis showed a trend towards lower temperature estimates in febrile patients, which in part may explain the rather low sensitivity of 0.72 and specificity of 0.94. In the literature, the minimum sensitivity acceptable to clinicians has been stated to be 0.9.32 ,46 ,47 Except for this, the performance was rather similar regardless of the reference method, adults versus children or type of instrument. The sensitivity analysis did not show any significant influence when we adjusted for study quality or statistical methods in the articles. The risk of bias analysis showed that the study populations were in general highly selected with convenience samples most common. Blinding was almost non-existent but was not judged to be a problem since most instruments give a digital figure that simply has to be recorded without interpretation. The timing between index and reference methods was, however, judged to be important since various parts of the body react differently when temperature is rising or falling.29 The quality of evidence was rated as moderate due to inconsistency between the included studies. Publication bias was difficult to evaluate, which is common in studies on diagnostic accuracy. The annual cost for temperature measurements is not high compared to other aspects of healthcare. The largest influence on cost is probably personnel cost, so an instrument with a long measurement process is probably more expensive than instruments with rapid measurements such as the TAT.
It has been shown that TAT gives less discomfort and pain to children compared with rectal and axillary instruments.24 ,28 ,32 ,36 The rectal thermometer has also been reported to be frightening and psychologically harmful for children and there is always a risk of perforation and infection.53 ,54 Long-term risks are not known, but rectal temperature measurements could together with other painful, stressful and integrity insulting procedures add to psychological suffering for the child. Another fact in favour of TAT is that the patient does not need to be awake for temperature measurement. If the most important issue is to have high accuracy and repeatability but the method is uncomfortable and integrity insulting, the frequency of temperature measurements should be reduced as much as possible.
The present systematic review is with 37 studies and 5026 study participants the largest summary of the evidence for temperature measurements at the temporal artery. Its strength is that the sensitivity analysis did not change the overall result notably. A weakness is the large heterogeneity among included studies.
Temperature measurements with TAT have been evaluated in a health technology assessment report from Scotland55 where it was considered as not exact enough when compared with a reference standard. A recent meta-analysis by Niven et al56 came to the same conclusion; they, however, included only 12 articles. When comparing with tympanic measurements, the results point in various directions. Barnason et al57 show evidence supporting the use in non-febrile adults and children 3 years and older, with clearer evidence supporting oral temperature measurements. Other reviews found no evidence supporting the use of TAT.58 ,59 Tympanic thermometer measurements in children have been evaluated in a systematic review and meta-analysis by Zhen et al.6 A pooled difference of 0.22°C (95% LoA −0.44 to 1.30°C) was found compared with reference. They concluded that tympanic measurements cannot replace rectal temperature measurements in these patients. Tympanic measurements have been reported as acceptable in critically ill patients in a systematic review by Jefferies et al,60 but had low sensitivity and high specificity in other systematic reviews.4 ,61
Our results indicate that TAT is not sufficiently accurate to replace one of the reference methods such as rectal, bladder or more invasive temperature measurement methods. Although inaccurate, the results are similar to those with tympanic thermometers, both in our meta-analysis and when compared with others. Thus, it seems that TAT could replace tympanic thermometers with the caveat that both methods are inaccurate. It is unlikely that further research would alter these conclusions. However, there is a need to find a refined non-invasive thermometer with high accuracy.
Acknowledgments
The authors thank Margareta Landin at the Medical Library at Örebro University who performed the literature search. Lars Hagberg, PhD, performed the health economic analysis. Ronny Carlsson assisted with technical information. Mia Svantesson-Sandberg, PhD, performed the ethical analysis. Monica Hultcrantz, Agneta Pettersson and Pernilla Östlund from the Swedish Council on Health Technology Assessment (SBU) participated in the assessment of methodological quality and in rating the quality of evidence.
References
Footnotes
Contributors HG performed the literature search together with a librarian. HG, GL and YN selected articles and assessed the methodological quality. RU performed the statistical analysis. This report was mainly written by HG and was critically reviewed, revised and subsequently approved by all authors.
Funding This research received no specific grant from any funding agency in the public, commercial or not-for-profit sectors.
Competing interests None declared.
Provenance and peer review Not commissioned; externally peer reviewed.
Data sharing statement No additional data are available.