Article Text

Abstract
Objectives To explore patterns of non-communicable diseases (NCDs) in the Australian Capital Territory (ACT).To ascertain the effect of the neighbourhood built environmental features and especially walkability on health outcomes, specifically for hospital admissions from NCDs.
Design A cross-sectional analysis of public hospital episode data (2007–2013).
Setting Hospitalisations from the ACT, Australia at very small geographic areas.
Participants Secondary data on 75 290 unique hospital episodes representing 39 851 patients who were admitted to ACT hospitals from 2007 to 2013. No restrictions on age, sex or ethnicity.
Main exposure measures Geographic Information System derived or compatible measures of general practitioner access, neighbourhood socioeconomic status, alcohol access, exposure to traffic and Walk Score walkability.
Main outcome measures Hospitalisations of circulatory diseases, specific endocrine, nutritional and metabolic diseases, respiratory diseases and specific cancers.
Results Geographic clusters with significant high and low risks of NCDs were found that displayed an overall geographic pattern of high risk in the outlying suburbs of the territory. Significant relationships between neighbourhood walkability as measured by Walk Score and the likelihood of hospitalisation with a primary diagnosis of myocardial infarction (heart attack) were found. A possible relationship was also found with the likelihood of being hospitalised with 4 major lifestyle-related cancers.
Conclusions Our research augments the growing literature underscoring the relationships between the built environment and health outcomes. In addition, it supports the importance of walkable neighbourhoods, as measured by Walk Score, for improved health.
- Geographical Information Systems
- Chronic Diseases
- Spatial Analysis
- Walkability
- Built Environment and Health
- Australia
This is an Open Access article distributed in accordance with the Creative Commons Attribution Non Commercial (CC BY-NC 4.0) license, which permits others to distribute, remix, adapt, build upon this work non-commercially, and license their derivative works on different terms, provided the original work is properly cited and the use is non-commercial. See: http://creativecommons.org/licenses/by-nc/4.0/
Statistics from Altmetric.com
- Geographical Information Systems
- Chronic Diseases
- Spatial Analysis
- Walkability
- Built Environment and Health
- Australia
Strengths and limitations of this study
This is one of the few studies to investigate the relationship between walkability and hospitalisations from heart disease and specifically myocardial infarction (MI) while simultaneously investigating other chronic conditions and built/social environment drivers of health.
This is the first study to report a significant relationship between heart attacks and walkability (measured using Walk Score).
While there have been many walkability studies in low socioeconomic and demographically mixed areas, this is one of the few to report significant results from a relatively egalitarian, well-educated, wealthy region.
The cross-sectional nature of this study makes it difficult to infer causal relationships.
Introduction
Background
Increasing rates of lifestyle-related non-communicable diseases (NCDs) such as cardiovascular disease and type 2 diabetes remain an area of public health concern in developed (and increasingly in developing) countries. In Australia, NCDs remain the predominant drivers of premature mortality and comorbidity.1 The Australian Capital Territory (ACT) is the wealthiesti 2 and best educated state in Australia.3 It has also been rated as one of the best places in the world to live by the Organisation for Economic Co-operation and Development,4 and has routinely been voted as the most liveable city in Australia.5 In the annual ‘Australian Cities Liveability Survey’, residents of Canberra have voted the city as being safe, affordable, having good employment and economic opportunities, as well as plenty of good schools/educational opportunities and an attractive natural environment with a wide range of opportunities for outdoor recreation activities.5 In addition, there is a relative absence of heavy industry in the ACT. Therefore, there is a general opinion that the ACT is an ‘exceptional’ city-state in Australia with regard to its environment and planning. It follows, therefore, that such a salubrious environment coupled with an educated population should encourage healthy lifestyle behaviours such as increased physical activity, which in turn should lead to significantly lower rates of lifestyle-related NCDs compared with the rest of Australia.
Paradoxically, however, this expectation is not reflected in the ACT’s burden of NCDs or lifestyle-related risk factors relative to the rest of Australia. For example, adult prevalence of obesity/overweight in the ACT is 62.2% compared with an Australian average of 63.48%.6 In addition, rates of childhood obesity in the ACT are similar to those reported nationally. Furthermore, key environmental indices such as walkability in the ACT are not significantly different from the walkability in other major metropolitan cities in Australia.7 While city-level measures of walkability are of questionable value, our research, as outlined later in this paper, shows that at the very least there are significant variations in walkability within the ACT, with the majority of suburbs being car dependent.
Unlike many other cities, a high degree of government ownership and control over land has resulted in a unique pattern of suburb development in the ACT.8 The planning has attempted to mimic a geographic ‘central place’9 hierarchy with each suburb having its own suburb centre with shops and other destinations. Suburbs are nested within larger districts. The ACT comprises eight populated districts. Each district has a central suburb, which is usually a very accessible, densely settled geographic central place with access to various local destinations including services, shops and other amenities. Some of these centres are also well served by public transport. Finally, in the centre of the ACT itself is the suburb of ‘Civic’, the central business district, with a very high degree of destination density. In spite of extensive planning, many suburb centres have, over the years, been affected by shop, school and other destination closures,8 resulting in a reduction in the number of local amenities and reduced walkability. Thus, planned and unplanned variations in the cityscape imply that residents are exposed to a variety of physical environments, which in turn may result in different health behaviours and resulting NCDs within the geographic boundaries of the ACT.
Investigation of the spatial patterns of key NCDs within the ACT and their associations with the physical and social environmental features can help identify environments that lead to adverse health outcomes and highlight which design features of these environments are significantly associated with specific health outcomes. In addition to spatial variations in the built environment, an additional aspect that makes the ACT ideal for studying such relationships is the relatively high socioeconomic status (SES) of the majority of its residents,2 ,3 though there are pockets of poverty.10 It has been repeatedly demonstrated that if beneficial relationships do exist between the built environment and healthy behaviours (and consequent health outcomes), they are more likely to be found in high SES locales such as the ACT,11 ,12 since the relationship between environment and behaviour is confounded by a negative perception of the environment in low SES individuals.13 Therefore, this research project had two aims: (1) to explore the spatial patterns of NCD-related hospital admissions in a relatively high SES Australian urban area—the ACT and (2) to investigate the built environmental correlates of NCDs, adjusted for key individual-level factors.
Methods
Conceptual framework
We start with a theoretical basis of the well-known public health triad of environment, behaviours and health outcomes. Health outcomes are influenced by health behaviours, which in turn are associated with the environment. We summarise this in figure 1. In Australia and elsewhere, a number of research papers have established the relationships between environment and behaviours (link A—see figure 1)14–18 or behaviours and health outcomes (link B—see figure 1).19 ,20 It logically follows that the environment is related to health outcomes through the individual lifestyle behavioural pathway. In addition, the built environment may directly influence health outcomes. For example, air pollution may be detrimental to respiratory and cardiovascular health,21 or perceptions on the environment may affect mental health.22 However, research on this relationship (link C—see figure 1) is limited, with most research, excepting a few,23 ,24 focusing on outcomes related to sedentary health behaviours such as obesity25 ,26 and conditions directly related to obesity.27 Our interest, therefore, was in investigating this relationship (link C—figure 1) between aspects of the physical environment and the four major NCDs in the ACT: circulatory system diseases, specific cancers, endocrine, nutritional and metabolic diseases (ENMDs) and respiratory diseases, using geocoded ACT hospitalisation data (from 2007 to 2013) and specific built environmental attributes. Note, however, that link C is mediated through multiple pathways, such as through health behaviours, and link C represents any relationship between environmental exposures and the chronic conditions described above, irrespective of mediating pathways.

Framework of relationships between environment, behaviours and health outcomes.
Investigating relationships
To investigate relationships between the built environment and NCD-related hospital admissions, we followed a combined exploratory-inferential approach. First, we asked ‘What are the spatial patterns of the four key chronic conditions in the ACT?’. This is addressed through exploratory mapping using spatial cluster analysis. Second, we investigated relationships between various individual and environmental predictors such as neighbourhood walkability, traffic volume and access to off-license alcohol outlets and the key NCD-related hospital admissions in the ACT. In the next section, we explain in detail the methods used to achieve this.
Data
Hospital data
The ACT Admitted Patients Data Collection (APDC) data were supplied by the ACT Health Directorate. This consisted of 75 290 unique hospital episodes representing 39 851 patients admitted to all ACT public hospitals between 1 January 2007 and 31 December 2013. Data were provided after ethics and other data regulation requirements from the data custodian (Executive Director Performance Information, ACT Government Health Directorate, Canberra) had been met. The data were deemed sufficiently anonymous to not require individual patient consent. Public hospitals capture around 80% of all hospitalisationsii in Australia.28 The patient hospital admission data had Australian Census—Australian Bureau of Statistics (ABS) Mesh Block (30–60 dwellings), Statistical Areas Level 1 (SA1s; 200–800 people) and Statistical Area Level 2SA2 (3000–25 000 people) geocodes attached to them; therefore, no additional geocoding was necessary. Each patient was geocoded to their place of residence. Geocoding completeness29 varied with geographical scale with 7284 records missing at Mesh Block level, but only 949 missing at the SA2 level. A single hospital episode included a primary diagnosis and up to a hundred other diagnoses.
Selection of NCDs
The Global Burden of Disease 2010 study30 and the Australia profile derived from this31 have demonstrated unequivocally the dominance of NCDs in the burden of overall disease in Australia. In 2010, 9 out of the top 10 risk factors, accounting for almost 50% of the total disease burden (in disability-adjusted life years), were lifestyle-related. The four broad NCD categories included in this study were chosen as they currently contribute the greatest burden in terms of healthcare resource cost in the ACT.
While all hospitalisations for four International Classification of Diseases (ICD)-10 codes: E, C, J and I were provided, we divided the data into specific subcodes, removing conditions with obvious genetic or familial drivers (ie, not directly related to lifestyle risk). Note that these ICD-10 codes could have been a primary or an additional diagnosis. Each condition was analysed separately and with comorbidity. The subsets of ICD-10 codes used in our analyses were:
Circulatory diseases: all diseases of the circulatory system, that is, ICD-10 (I00-I99) code ‘I’ (circulatory system diseases or CSDs). However, we also created a data subset of hospital admissions with a primary diagnosis for MI and subsequent infarctions (ICD-10 codes I21 and I22, respectively). MI or heart attack represents a serious and sudden event generally requiring immediate hospitalisation.
Cancers: we included cancers of the breast ‘C50’, colorectal cancers ‘C18-C21’, endometrial cancer ‘C54.1’ and lung cancers ‘C33-C34’. These cancers have been associated with lifestyle risk factors.32
Endocrine, Nutritional and Metabolic Diseases (ENMDs)—E10-E16 and E-66.
Diseases of the respiratory system—J00-J99, that is, all diseases of the respiratory system.
Table 1 describes the overall episodes of hospitalisation related to NCDs.
Total hospitalisations for each NCD category by year*
Of these conditions, CSDs and ENMDs are known to be associated with a sedentary lifestyle, as is obesity, colorectal and endometrial cancer.32 Lung cancers and respiratory diseases are driven to a great extent by smoking and air quality.
For statistical modelling and analysis, we used all hospital admission episodes (2007–2013), but for spatial mapping we further subdivided the hospital data to the years 2007 and 2011 because these link to the national censuses (2006 and 2011) with available reference population data. The individual-level covariates that were included in the hospital data were gender, age (years), marital status, private insurance and hospital insurance. The raw data included other variables that were not relevant to this study such as length of hospital stay, medical procedures performed and days (if any) in the psychiatric ward. The insurance variables may serve as proxy measures of SES. The covariates are summarised in online supplementary appendix S1 table S1.1.
supplementary appendix
Population data
In addition to the above data, population data were required for mapping rates of hospital admission. The smallest geography at which Australian demographic data (eg, age, gender, SES) are released is the SA1 (with an average of 500 people). SA1 is therefore a relatively small geographic area at which NCD-related hospital admission rates could be mapped. However, there were relatively smaller numbers of neoplasm and MI cases (table 1); hence, these conditions required a larger geography—the SA2 for mapping—because rates based on small numbers of expected cases are unstable and have large CIs. In this study, the term suburb is used to define the spatial boundary defined by the ABS in 2011 as SA2. Therefore, we aggregated up to the SA2 (suburb) level. In addition, while ENMDs and CSDs can be mapped at SA1s annually given their large annual numbers in the ACT (table 1), aggregate sums over multiple years were used for MI and neoplasms.
Australian census output geographies changed significantly between 2006 and 2011. While there are minimal differences between 2011 SA2 geographies and their 2006 counterpart Statistical Local Areas (SLAs) in the ACT,33 there was significant spatial mismatch between 2011 SA1s and their 2006 counterpart in the census hierarchy—Collection Districts (CDs). Thus, when mapping by SA1s or CDs (ENMDs, respiratory diseases and CSDs), we show separate maps for 2006 and 2011. Age-specific 2011 population counts at SA1s and 2006 counts at CDs were obtained from the ABS. For SA2 level maps of neoplasms and MI, counts of expected numbers of cases for the years 2007–2011 were required. Age-specific 2011 population counts and 2006 population counts were obtained at SA2s/SLAs. To obtain the age distribution for the intermediate years (2007–2011) at SA2s, we linearly interpolated the numbers in each SA2/age group between 2006 and 2011. This generated the fraction of people in each age group in a given year in an SA2. We then used an indirect age standardisation technique to calculate annual expected numbers of cases of an NCD using the annual age distributed ACT population as the standard population.34 Expected annual numbers were also calculated for the CD, SA1 and SA2 data. We used 2006 expected counts when mapping 2007 hospitalisation data since 2007 SA1 or CD population counts were not available.
Environmental data
As summarised in figure 1, we wanted to investigate relationships between various built environmental attributes and health events (hospital admissions). A number of environmental covariates were collected, collated and/or created in-house by the authors. Our choices of environmental drivers were informed by previous research but also constrained by the available data. For example, we did not have geocoded data for food outlets and hence could not explore any relationships between hospital admissions and the food environment. The environmental indices that were available are described below:
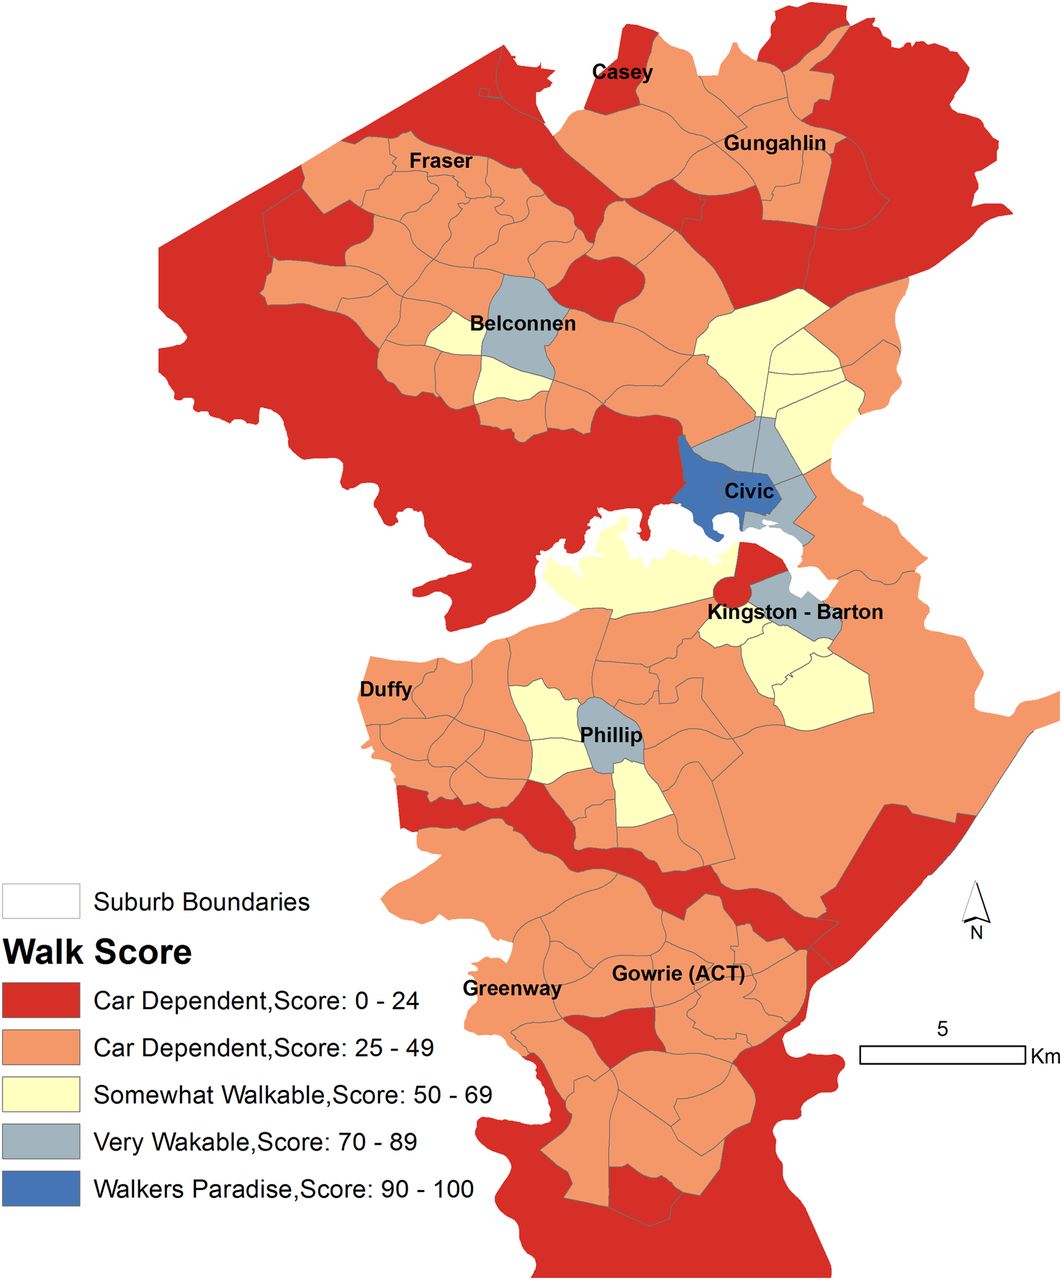
Walkability: walking is the most prevalent form of physical activity in the population.35 ,36 The degree of neighbourhood walkability predicts the degree of walking.37 We measured the physical activity environment through suburb-level walkability. While other aspects of the physical activity environment such as access to parks and leisure/exercise centres are also important, the walking network remains one of the most important built environmental attributes for overall physical activity.13 Walk Score is a measure of walkability produced by a United States (US)-based company that has been validated37 and has been used in a number of public health studies in the US. In the Australian context, it has been found to have strong relationships with walking for transport in a recent study,14 though relationships with health outcomes have not previously been found.23 Walk Score is a composite measure of destination density. The scores are normalised to a 0–100 scale, with 0 being the lowest walkability and 100 being the highest. A five-scale categorisation is used: ‘walkers paradise’ (Walk Score 90–100), ‘very walkable’ (70–89), ‘somewhat walkable’ (50–69), ‘car-dependent’ (25–49) and ‘car-dependent’ (0–24) by the developers of Walk Score,38 and these categories have been used by other researchers.16 Walk Scores for ACT suburbs/SA2s were obtained from the Walk Score website.38 A map of Walk Scores at ACT suburbs is provided in figure 2.
Access to general practitioners (GPs): access to primary care is an important predictor of admittance to tertiary facilities.39 ,40 Access to GPs is related to better health management and lesser use of hospital services.39 ,41 We created an access measure by drawing a circular buffer around the Mesh Blocks of the patients in the hospitalisation data. The circular buffers around the Mesh Blocks adaptively grew to different sizes, with each buffer growing until a total of 1000 people were included in the circle. The numbers of GP clinics in the buffer circles were then summed to provide an approximate measure of access as the number of GP clinics per thousand persons. GP clinic data for 2010 were provided by the ACT Medicare Local, while underlying 2011 census population data were obtained from the ABS.
Neighbourhood SES: neighbourhood SES is a well-established marker of social environment including crime and social cohesion and a mature literature supports the relationship between neighbourhood SES and a range of health outcomes.42 The Socio-Economic Indexes for Areas (SEIFA) are indices of area level of SES in Australia developed by the ABS. The Index of Relative Socio-Economic Advantage and Disadvantage (IRSAD) is one such index that measures both advantage and disadvantage. The index was created by incorporating a number of measures including per cent unemployed, car ownership and per cent disabled. SA1 IRSAD scores for 2011, the finest resolution at which they are available, were incorporated into these analyses.
Alcohol outlets: along with the food environment, alcohol outlets are powerful predictors of lifestyle-related health outcomes.43 While the food environment is best represented by summary measures of access to a range of food outlets, we did not have access to an integrated, clean, geocoded data set of food outlet locations in the ACT for this study (see Discussion section). Easy access to alcohol has been related to a number of negative health and social outcomes,44 ,45 and we have used a measure of alcohol access in our analyses. A list of all licensed off-licence liquor outlets was obtained from the ACT Department of Regulatory Services46 and geocoded to the SA1. Off-licence outlets are licensed to sell alcohol, but alcohol cannot be consumed within premises, examples of which include supermarkets and bottle shops. The road network distance from each residential parcel within each SA1 to the nearest off-licence liquor establishment was calculated. The mean distance for all residential parcels per SA1 was then derived. Off-licence outlets were included if they were within the same ACT defined district as the SA1 of interest.
Road traffic exposure: the presence of road traffic can act as an impediment to physical activity in a neighbourhood environment.47 Road traffic exposure was based on a ratio of road hierarchy (as a proxy for traffic volume) by length of road segments within an SA1. Methods for this have been published previously.47

Map of five categories of Walk Score by ACT suburbs. The five categories are ‘walkers paradise’ (Walk Score 90–100), ‘very walkable’ (70–89), ‘somewhat walkable’ (50–69), ‘car-dependent’ (25–49) and ‘car-dependent’ (0–24). ACT, Australian Capital Territory.
Analysis
Spatial patterning of hospital admissions related to NCDs was explored using a cluster detection tool, the Spatial Scan Statistic.48 Monte Carlo regression was then employed to investigate relationships between NCD-related hospitalisations and built environmental factors.29 ,49 Finally, a negative binomial model was also employed to test the relationship between NCDs and built environmental factors.
Exploratory spatial scan statistic
Exploratory methods allow us to generate hypotheses about relationships (Link C, figure 1) by visually correlating significant spatial patterns of NCD-related hospital admissions with spatial patterns of environmental variables. We used the well-validated and robust Spatial Scan Statistic to investigate significant spatial patterns.48 ,50 ,51 This method asks ‘What area or what combination of areas is most likely to have a statistically significantly ‘high’ or a significantly ‘low’ risk relative to areas outside the combination of areas?’ This would be framed as a ‘cluster detection problem’ in the spatial epidemiology literature.48
The Spatial Scan Statistic was implemented using the SaTScan software. This method implements a single maximum likelihood-based hypothesis test over geographic space to identify the regions where the distribution of cases relative to controls/population (or the expected number of cases) is most likely to be consistent with a significant excess risk. To implement this, SaTScan identified candidate clusters, which were circles of increasing radii, bound by a maximum population threshold radius (set here to 5% of the population), centred on prespecified locations such as SA1 centroids. The size of the cluster is sometimes sensitive to the threshold radius.52 The 5% threshold represents around a few hundred expected cases of most NCDs, and is sensitive enough to delineate small clusters, an early goal in our data exploration and analysis.
Over many candidate clusters SaTScan maximises the likelihood ratio, given by
where LLR represents the logarithm of the likelihood ratio, O refers to observed cases, E to expected cases, and n is the total number of cases in the entire region (ACT). The likelihood formula assumes that NCD cases are distributed as a Poisson random variable and the likelihood ratio is compared with simulated likelihood ratios generated from 999 Monte Carlo randomisations of the data to assess statistical significance. The area that has the highest likelihood value (or the lowest p value) is the primary cluster. If both low-risk and high-risk clusters are searched for, then the most likely (high and low) clusters will be identified and published by the software. Secondary or less likely clusters may also be reported. In our analyses, we restricted our results to primary or secondary clusters with a significant p value (p<0.05). Relative risks (RRs) at the significant clusters were reported as: (risk inside the cluster)/(risk outside the cluster).
SaTScan analyses were implemented for CSDs and respiratory diseases at the SA1 scale for 2011 and CD scale for 2007. Owing to an unexplained anomalously low number of hospitalisations for ENMDs in 2011 (table 1), we scanned 2012 SA1 and 2007 CD ENMD data. Owing to lower event rates, MI and selected cancers were analysed at the SA2 scale for the entire aggregated 2007–2011 period. Thus, SA2 observed and expected numbers were summed for the entire 5-year period 2007–2011. Results were mapped using ArcGIS V.10.1.
Associations between built environment factors and hospital admission rates
We used two different models to investigate the relationships between the various NCD-related hospital events and built environment characteristics. The hospital admission data were complex, with multiple cross-classifications and nesting. For example, each person in the data could be hospitalised multiple times (nesting of hospitalisation episodes within people), people were nested in geographic neighbourhoods such as suburbs, and the temporal nature of the data implies likely temporal trends and seasonal patterns. In addition, the distributions of a number of predictors such as suburb-level Walk Score or GP density were not normal, which would render traditional linear models unusable, or require complex statistical transformations and/or models. To overcome this problem, we first modelled relationships using a robust method: Monte Carlo logistic regression.29 ,49 The approach was as follows:
Randomly sample 50% of the data;
Fit logistic regressions (or any other model to be tested) to estimate best explanatory model, store parameter estimates: intercept and slope values;
Repeat steps 1 and 2, N times (in our simulations, N=1000);
Calculate mean and 95% CIs for estimated model parameters from stored values in step 2.
We used logistic regressions as our explanatory model, with each hospitalisation event with a primary diagnosis of respiratory diseases as the control condition. The dependent variable was a hospitalisation event (1/0) with a primary diagnosis of each of the NCDs described in the Data section—cancers, CSDs, MI, ENMDs and comorbids being coded as 1. Separate models were run for each of the MIs, CSDs, specific neoplasms, ENMDs and comorbids. Respiratory diseases were chosen as the control condition, or coded as 0, because the drivers of respiratory diseases, with the exception of smoking, generally differ from the environmental drivers of the other three conditions. (While ideally we would have liked to use all hospitalisations as controls, these data were not available at the time of analysis.) When modelling neoplasms, since lung cancers have somewhat different environmental drivers than the remaining cancers, we ran the model with and without lung cancer. We also attempted to model hospitalisations with comorbid CSDs, specific neoplasms, ENMDs and respiratory disease conditions by coding hospitalisation with more than one condition as 1, and the rest as 0. The independent variables in these models included: sex, age, marital status, payment with private insurance (yes/no) of the person hospitalised. All these covariates, with private insurance as a marker of SES, are known to be associated with chronic conditions.53 In addition, ecological-level independent variables (described in the Data section) include the hospitalised person's access to GPs, neighbourhood walk score, IRSAD score, access to alcohol and logged traffic exposure.
We also report McFadden's pseudo R2 for the Monte Carlo regression analyses. We understand that the use of pseudo R2 is controversial,54 and publish these values for researchers who prefer to see them reported. These values were not used for model selection or for any other judgement on model quality.
Finally, for NCDs with significant environmental correlates in the Monte Carlo model, we also modelled the total number of hospitalisation events of a given condition in a given suburb as a function of counts of different predictors. The models can be written as:

where Yj is the total count of a given condition in suburb j and xjk is the count of the kth predictor in the jth suburb, for example, the total number of insured patient hospitalisations in a suburb or total number of female patient hospitalisations in a suburb. Yj was considered to be negatively binomially distributed with mean μj and variance κ. A negative binomial model was used after it was found that the data were overdispersed, rendering a Poisson model unsuitable. The mean μj or suburb-level count of a given outcome was modelled as an exponential function of an intercept term β0 and a slopes term βk. These models require aggregate counts or summaries at the suburb level, and variables were recoded to satisfy this requirement. Thus, for example, discrete variables such as the marital status of a hospitalised person (1/0) translated to the total number of hospitalisations of married people in a given suburb. Continuous variables were similarly recoded, such as the number of hospitalisations of people in the topmost quartile of traffic exposure, number of hospitalisations of people in the lowest decile of IRSAD, number of hospitalisations of people with good GP access and so on. People with a GP density of one or more in their immediate buffer neighbourhood were considered to have good access.
We were interested in modelling counts of a hospitalisation outcome (eg, heart attack hospitalisations) in a small area as a function of counts of the characteristics of the hospitalised population in the negative binomial models. Note that the population size of a suburb does not necessarily predict the number of hospitalisations, which is a function of a number of neighbourhood compositional characteristics such as age, sex and SES. Counts of hospitalisations that capture these characteristics were included in the model. While modelling heart attacks as a fraction of all hospitalisations could be an alternative model, the results of the count negative binomial model, as described in the next section, converge with the results from the logistic Monte Carlo model, underscoring the strength of our analyses. The models were implemented using R and Stata.
Results
Figures 3⇓⇓–6 display the results of the Spatial Scan Statistic analyses. We report all significant clusters of ‘high’ and ‘low’ risk. Reporting all significant clusters instead of the ‘most likely’ cluster has been shown to enhance exploratory analyses.52 ,55 The scan results displayed a general trend of higher risk of hospital admissions in the outer suburbs and lower risk in the inner suburbs. Thus, the suburbs of Civic and Kingston-Barton either had a significantly lower risk of CSDs (figure 3), MI (figure 6) and respiratory diseases (figure 5) or were not significantly different clusters (figures 3⇓⇓–6). While maps of all CSDs showed some random variation from 2007 to 2011, sections of West Belconnen around Fraser and areas south of Gowrie and north of Gungahlin showed consistent high risk of CSDs (figure 3). Some of these areas also showed consistent high risks of ENMDs (figure 4).

Spatial patterns of CSD risk. Maps showing (A) clusters of Collection Districts in 2007 and (B) Statistical Area Level 1 in 2011 with statistically significantly different risks of hospitalisation for all CSDs. Expected counts for 2007 were calculated using 2006 census populations. Relative risk for a given contiguous cluster was calculated relative to the risk in the rest of the ACT. ACT, Australian Capital Territory; CSD, circulatory system disease.

Spatial patterns of ENMD risk. Maps showing (A) clusters of Collection Districts in 2007 and (B) Statistical Area Level 1 in 2012* with statistically significantly different risks of hospitalisation for selected ENMDs. Expected counts for 2007 were calculated using 2006 census populations and census 2011 for 2012. Relative risk for a given contiguous cluster was calculated relative to the risk in the rest of the ACT. *See text for clarification. ACT, Australian Capital Territory; ENMD, endocrine, nutritional and metabolic diseases.

Spatial patterns of respiratory disease risk. Maps showing (A) clusters of Collection Districts in 2007 and (B) Statistical Area Level 1 in 2011 with statistically significantly different risks of hospitalisation for respiratory diseases. Expected counts for 2007 were calculated using 2006 census populations. Relative risk for a given contiguous cluster was calculated relative to the risk in the rest of the ACT. ACT, Australian Capital Territory.

Spatial patterns of MI and cancer risk. Maps showing Statistical Area Level 2 (suburbs) with statistically significantly different rates of hospitalisation for (A) MI and (B) selected cancers. Relative risk for a given contiguous cluster was calculated relative to the risk in the rest of the ACT. ACT, Australian Capital Territory; MI, myocardial infarction.
The spatial patterns of MI and cancer risk (figure 5) did not show a consistent pattern, though we can see that highly walkable suburbs such as Civic, Kingston-Barton and Belconnen were either low risk (RR<0.13) clusters or non-significant clusters. One of the recognised problems with SaTScan is its propensity at larger geographic aggregations to detect large low-risk clusters in rural, sparsely populated areas. Thus, areas North East of Gungahlin and some areas south east of Kingston-Barton appear as low-risk clusters, which in reality have very few residents (figure 6).
The results of Monte Carlo logistic regressions showed significant relationships between suburb-level Walk Score and the risk of MI (table 2). Specifically, there was a 4% 1.04 (95% CI 1.01 to 1.07) increased odds of being hospitalised for a heart attack from living in a neighbourhood that is not a ‘walker's paradise’. Similarly, there was a significant progressively increasing risk of being hospitalised with cancer when living in increasingly less walkable suburbs. When lung cancers were removed from the set of four cancers (not shown), the effect sizes remained the same, but the CIs widened, becoming marginally non-significant. This probably indicates that the relationship with neoplasms is most likely valid, but the regressions are underpowered due to the small numbers. A high pseudo R2 of around 95% in the MI model was reported, underscoring our earlier comment that these values should be interpreted with care.
Summary of robust Monte Carlo logistic regression derived ORs with 95% CIs for each NCD hospitalisation outcome*
The relationships were supported by the negative binomial model (table 3). For example, there are 4% less hospitalisations with myocardial infractions from neighbourhoods that are a walker's paradise relative to car-dependent neighbourhoods. Somewhat counter-intuitive relationships with hospital admissions from neoplasms were found, where those living in a neighbourhood with more hospitalisations of low SES people or having less access to GPs decreased the likelihood of a neoplasm-related hospitalisation, which may suggest the potential for missed diagnoses.
Summary of rate ratios (CI)†
Being female was protective for circulatory disease, MI, ENMD or hospitalisation with more than one condition but was a risk factor for selected neoplasms (table 2). Being married (or in a de facto relationship) increased the risk of being hospitalised with any condition but decreased the risk of being hospitalised with multiple conditions (table 2). Results from the ecological model (table 3) also support the findings from the Monte Carlo model. In Australia, while public hospital services are free, patients may have the choice of accessing private services for a fee, usually paid through insurance. Paying with private insurance was positively associated with MI hospitalisation or hospitalisation with selected neoplasms.
Overall, the results of the regressions agreed with results of exploratory mapping—that is, the outlying low walkability suburbs have higher rates of key NCD-related hospital admissions.
Discussion
We found that Walk Score was significantly associated with hospital admission for MI. The spatial patterns of MI admission rates and Walk Score supported this finding. Thus, individuals residing in a neighbourhood considered a ‘walker's paradise’ (eg, Civic) have significantly lower risks of admission for MI after adjustment for age, gender, marital status and insurance status. A similar relationship existed with certain neoplasms, though further investigation is required to support this finding. The highest risks of neoplasms and MI admission rates were found in Kambah (Walk Score 28) and Kaleen (Walk Score 39), which were classified as ‘car-dependent’ by Walk Score. While a number of studies have shown that Walk Score is related to walking for recreation and transportation14–16 ,37 ours is one of the few studies23 ,24 that showed a significant relationship between Walk Score and hospital admissions.
Our analyses used suburb-level Walk Scores. It is known that there are significant differences in walkability within suburbs, and therefore individual residential-level Walk Scores could capture more of the variation in walkability in the ACT, and perhaps help in obtaining more robust estimates of the relationships between key NCD-related hospital admission and walkability. Walk Score itself has been criticised by some researchers as a measure of walkability, though some of these criticisms—such as the use of ‘as the crow flies’ distance—have been rectified in the newer versions of Walk Score which we have used.38 Another shortcoming with the Walk Score and other environmental data used in these analyses is that they are from a single time point over the analysis period. While theoretically temporal synchronisation between the environmental data and the health data is ideal, accessing archived spatial data sets for different time periods of interest was not possible in a reasonable time frame for this study.
Our data are from public hospital data, and we did not have access to private hospital data. While there is a possibility that this may cause biases, public hospitalisations cover the majority of hospitalisations in the ACT, and therefore are mostly representative of hospitalisations in this population.28 Nevertheless, it is possible that there are suburb-level (or smaller area) variations in the proportion of private hospital admissions relative to public hospital admissions. This may cause biases the extent of which are not known. Some of the areas with consistent low risk, such as Civic and Kingston-Barton (at the centre of the ACT), are areas with high residential density, easy access to shops and public transport. These areas also tend to draw a higher proportion of individuals who are younger and mobile, and are less likely to be hospitalised for any condition whatsoever. Since our regression models do not incorporate underlying population data, it is possible that variations in area-level populations may affect our analyses. Nevertheless, exploratory cluster mapping does incorporate underlying population and we note that areas such as Civic, Phillip and Kingston-Barton were generally low-risk clusters. Therefore, the relationships are unlikely to be biased by population heterogeneity in hospitalisation rates.
A recent similar study from Australia found no significant association between Walk Score and the likelihood of ischaemic heart disease (IHD).23 There could be multiple reasons for this, including the fact that Walk Score at geographic centroids of SLAs were used to summarise the Walk Score in a given SLA. Since there is considerable variation of Walk Score within an SLA, a geography much larger in size than SA2s in the aforesaid study, using centroid Walk Scores, may not be appropriate. In contrast, we used an SA2/suburb-level Walk Score, which represents the average Walk Score at the suburb level. Another reason as to why significant associations were not found in the study23 could be the outcome investigated—IHD. This condition, like CSD, may remain undiagnosed in the population, resulting in a hospitalisation data set that is not representative of the true patterns of the condition in the population. MI, which is a severe acute outcome of undiagnosed IHD or CSD, is less likely to suffer from diagnostic bias. To the best of our knowledge, at least one other study, in this case reporting results from the USA, has reported an association between mixed land use, better access to fitness facilities and a lower risk of coronary heart disease in low-income women.24 The local government area of ACT is high SES and relatively egalitarian, being at the middle of the income inequality league relative to other local governments in Australia.56 Car ownership in the ACT (603/1000 people) is well above the Australian average (568/1000) with only two states, Victoria and South Australia, having higher ownership rates. In addition, public and active transport modes of travel to work are less popular in the ACT compared with other capital cities.57 The combination of high SES, low walkability and high car ownership is known to discourage walking (recreational or transportation walking),11 ,12 which in turn may influence the risk of heart disease or cancer, as demonstrated in this study. It is possible that cars may enable informed individuals to shop for healthy foods, but the food environment beyond alcohol is not explored in this study. Incorporating the food environment in our analyses is an area of future work. Further work will include additional environmental measures (eg, air quality and crime will be included in the next phase), further refinement of indices (eg, mix of food outlets, nutritional quality of food available), closer analysis of the metric and distributional properties of each measure and better quality data on individual behaviours. In addition, future research should assess whether the present findings are replicated in similar, as well as in different, populations and settings.
This study uses an ecological cross-sectional design which may generate bias. In addition, patients could have a condition and not be hospitalised (eg, death from MI before hospitalisation). Cancer registries could supply better quality and more comprehensive data than hospitalisation from neoplasms. Another limitation of our study is that we used respiratory diseases as our control condition in the regressions. This is because the drivers of respiratory conditions are generally different from the drivers of heart attacks, ENMDs, etc. While our data, which were limited to the four conditions, constrained the analyses to this specific control, future analyses will attempt to incorporate all hospitalisations as a control condition. We showed that there are relationships between walkability as measured by Walk Score and key NCDs providing support of the logical link between environment, behaviours and health outcomes (figure 1: link C). Nevertheless, we remain interested in investigating link A, the relationship between environment and behaviours, since 2013 data on lifestyle risk behaviours at the suburb level such as smoking/alcohol and body mass index have become available through the ACT Adult Health Survey. Incorporation of these data into further analyses remains an area of future exploration. Furthermore, if individual-level address information of the survey respondents were available, this would allow a more precise and accurate investigation of the effects of the built environment on lifestyle risk behaviours and NCDs.
Conclusion
Our analyses form a unique and systematic investigation into the effect of built environment and consequent NCD-related hospital admissions. This research highlights the significant role that walkability plays in health and in use of healthcare resources, that is, hospitals. While this research could have a significant bearing on local policymaking, it also captures a niche in the broader built environment and health literature with its investigation of relationships between the built environment and health outcomes.
Acknowledgments
The authors would like to thank the ACT Health Directorate for funding this research and providing the hospitalisation data from the ACT Admitted Patients Data Collection. The authors are grateful to both the Health Improvement Branch and Epidemiology Section for providing expert advice during the course of this research project. Spatial data were sourced from a variety of ACT Government Directorates (including Environment and Planning, Territory and Municipal Services and Justice and Community Safety) and the authors are very grateful for Directorate staff assistance with regard to data access and technical advice which made this research project possible.
References
Footnotes
Contributors SM, VL and TC implemented the data cleaning, statistical analyses and the writing. RD, HP and BO provided analytical oversight, reviewed the manuscript and helped with the writing.
Funding The research was funded by the Australian Capital Territory Health Directorate (http://www.health.act.gov.au).
Disclaimer The opinions expressed in this paper are those of the authors and not those of the funding body.
Competing interests None declared.
Ethics approval The research was approved by the ACT Health Human Research Ethics Committee (Ref.: ETH.11.14.310) on 8 December 2014.
Provenance and peer review Not commissioned; externally peer reviewed.
Data sharing statement The hospital data were provided after ethics and other data regulation requirements from the data custodian at HealthInfo@act.gov.au. Anyone with the appropriate ethics clearances can request the data custodian for the data.
↵i Median household income/week in 2011–2012 was $A2124 compared with a national average of $A1612.
↵ii This is a national statistic. The ACT government does not collect and/or publish private hospitalisation data, but it is unlikely to differ significantly, since states that do publish data report similar fractions of public and private hospitalisations.