Article Text

Abstract
Objectives To perform a meta-analysis to evaluate the diagnostic efficacy of diffusion-weighted imaging (DWI) in differentiating malignant from benign thyroid nodules.
Design A meta-analysis.
Data sources and study selection Medical and scientific literature databases were searched for original articles published up to August 2015. Studies were selected if they (1) included diagnostic DWI for differentiating malignant from benign thyroid lesions, (2) included patients who later underwent biopsy and (3) presented sufficient data to enable the construction of contingency tables.
Data synthesis For each study, the true-positive, false-positive, true-negative and false-negative values were extracted or derived, and 2×2 contingency tables were constructed. Methodological quality was assessed using the Quality Assessment of Diagnostic Accuracy Studies (QUADAS) instrument. The heterogeneity test, threshold effect test, subgroup analyses and publication bias analyses were performed.
Results From the 113 identified search results, 15 studies, representing a total of 765 lesions, were included in the meta-analysis. We detected heterogeneity between studies but found no evidence of publication bias. The methodological quality was moderate. The pooled weighted sensitivity was 0.90 (95% CI 0.85 to 0.93); the specificity was 0.95 (95% CI 0.88 to 0.98); the positive likelihood ratio was 16.49 (95% CI 7.37 to 36.86); the negative likelihood ratio was 0.11 (95% CI 0.08 to 0.16); and the diagnostic OR was 150.73 (95% CI 64.96 to 349.75). The area under the receiver operator characteristic curve was 0.95 (95% CI 0.93 to 0.97).
Conclusions Quantitative DWI may be a non-invasive, non-radiative and accurate method of distinguishing malignant from benign thyroid nodules. Nevertheless, large-scale trials are necessary to assess its clinical value and to establish standards regarding b values and cut-off values for DWI-based diagnosis.
- thyroid nodules
- Diffusion-weighted imaging
- Meta-analysis
This is an Open Access article distributed in accordance with the Creative Commons Attribution Non Commercial (CC BY-NC 4.0) license, which permits others to distribute, remix, adapt, build upon this work non-commercially, and license their derivative works on different terms, provided the original work is properly cited and the use is non-commercial. See: http://creativecommons.org/licenses/by-nc/4.0/
Statistics from Altmetric.com
Strengths and limitations of this study
The Preferred Reporting Items for Systematic reviews and Meta-Analyses statement was used to improve the reporting of our research.
Hierarchical summary receiver operating characteristic (HSROC) curves were constructed to assess sensitivity (SEN) and specificity (SPE).
We presented a new point: using a high b value may provide higher diagnostic accuracy.
Studies included in our meta-analysis lacked a description of apparent diffusion coefficient reproducibility and the sample size of included studies was relatively small.
Introduction
Thyroid nodules, the most common pathology involving the thyroid gland, consist of discrete lesions within the thyroid gland that are often palpable and typically sonographically distinct from the surrounding thyroid parenchyma.1 Less than 5% of palpable thyroid nodules are malignant; however, these nodules must be distinguished from benign thyroid nodules to correctly and efficaciously treat patients suffering from this pathology.2
Because clinical findings do not provide a definitive diagnosis, several useful, non-invasive imaging tests (such as ultrasonography (US) and radionuclide scintigraphy) can be used to determine which nodules should be histopathologically evaluated to rule out the possibility of thyroid malignancy. US has been used as a first step in the assessment of these nodules, but no single US criterion has been demonstrated to accurately differentiate benign nodules from malignant nodules. Furthermore, the hazards associated with radiation exposure during radionuclide scintigraphy are unavoidable, and some functioning nodules (hot nodules) found on scintigraphy are malignant.
Diffusion-weighted imaging (DWI) is a type of functional MRI that is based on the diffusion of water molecules through the tissue of interest (ie, tumour tissue). DWI can provide crucial information regarding the molecular profile of the underlying pathology and pathophysiological mechanisms.3 Specifically, the diffusion of water molecules in malignant tumours is restricted, which results in a decreased apparent diffusion coefficient (ADC); this difference in the ADC facilitates the differentiation of benign tumours from malignant tumours.4
Many studies1 ,5–18 have shown that DWI has the potential to differentiate benign from malignant thyroid nodules. However, the sample sizes of these studies were relatively small, and the findings have been inconclusive. The aim of this study was to systematically review all of the studies related to the ability of DWI to differentiate benign from malignant thyroid nodules. Moreover, based on the extracted data, an analysis of the technical aspects of DWI and its additional value for tumour characterisation is presented.
Methods
As this meta-analysis was based on previously published studies, ethical approval was not necessary.
Literature search
The PubMed, EMBASE, Cochrane Library and China National Knowledge Infrastructure (CNKI) databases were searched by two independent observers. The terms ‘Diffusion-Weighted Imaging (MeSH)’ or ‘DWI’ were used for the diagnostic test, and the terms ‘thyroid nodules (MeSH)’, ‘thyroid lesions’, or ‘thyroid’ were used for the clinical domain (Search Strategy S1). We limited our search to publications that met the following criteria: published in the English or Chinese language; the presence of the search term within the title or abstract of the article; and a publication date no later than May 2014. Review articles, letters, comments, case reports and unpublished articles were excluded. The reference lists of all retrieved articles were manually cross-checked.
Selection of articles
Two authors initially screened the titles and abstracts of the search results and retrieved the full texts of all potentially relevant reports. Next, the authors independently reviewed all relevant reports according to the predefined inclusion criteria. Disagreements were resolved by consensus or arbitration by a third author, who assessed all of the involved items. The majority opinion was used to determine whether a particular study met the selection criteria.
Studies were considered as eligible if the following criteria were met: (1) the study included a diagnostic DWI for differentiating malignant from benign thyroid lesions; (2) the controls underwent histopathological analysis (surgery/biopsy) and/or follow-up analysis and (3) the data were sufficient to accurately determine the true-positive or false-negative results.
Studies were excluded if (1) there were fewer than 20 patients; (2) multiple reports were published for the same study population (in this case, the most detailed or recent publication was chosen) or (3) the study included patients who had previously undergone treatment for thyroid lesions.
Quality assessment and data extraction
The aforementioned three authors extracted data from the selected reports. The methodological quality of the included studies was independently assessed by two observers using the Quality Assessment of Diagnostic Accuracy Studies (QUADAS-2) tool, which was specifically developed to systematically review the diagnostic accuracy of studies.19–21 Additionally, relevant data, including author, the study nation, the description of the study population, the study design characteristics, the magnetic field strength, the pulse sequences and descriptions of the interpretations of the diagnostic tests, were extracted from each study. To resolve disagreements between the reviewers, a third reviewer assessed the disputed material, and the majority opinion was used in the analysis.
For each study, the estimated true-positive (TP), false-positive (FP), true-negative (TN) and false-negative (FN) values, sensitivity (SEN), specificity (SPE), positive likelihood ratio (PLR) and negative likelihood ratio (NLR) for the detection of lesions were extracted, and 2×2 contingency tables were constructed.
Meta-analysis
Exploring study heterogeneity is important in understanding the possible factors that influence accuracy estimates and in evaluating the appropriateness of statistical pooling of accuracy estimates from various studies. Visual inspection of the forest plots, standard χ2-tests and the inconsistency index (I2) were used to estimate the heterogeneity of the individual studies, using Stata software (Stata Corporation, College Station, Texas, USA). p<0.1 or I2 >50% suggested notable heterogeneity.22 If notable heterogeneities were detected, the relevant data were pooled using a random-effects coefficient binary regression model; otherwise, a fixed-effects coefficient binary regression model was used.23
In the diagnostic test, one primary cause of heterogeneity is the threshold effect, which arises when different cut-off values, or thresholds, are used to define a positive (or negative) test result between different studies. When a threshold effect exists, there is a negative correlation between SEN and SPE.24–26 The Spearman correlation coefficient between the logit of SEN and the logit of (1−SPE) was computed to assess the threshold effect, using Meta-Disc V.1.4; a strongly positive correlation (p<0.05) suggests a threshold effect. We constructed hierarchical summary receiver operating characteristic (HSROC) curves to assess SEN and SPE.27 The areas under the ROC curves (AUCs) were used to analyse the diagnostic precision of DWI in differentiating thyroid nodules.
In addition to the threshold effect on systematic review results, several other factors can result in variations in accuracy estimates between different test accuracy studies. In this study, meta-regression was used to identify such heterogeneity by comparing the accuracy measurement to study-level covariates (study nation, study design, MRI field strength, reference standard, enrolment, disease spectrum, patient spectrum or b value). Then, subgroup analyses were performed. Stratification was performed according to the following parameters: (1) the b value; (2) studies with a prospective or retrospective design; (3) magnetic field strength; (4) reference standard and (5) enrolment.
Using Stata software, the presence of publication bias was assessed by producing a Deeks funnel plot and performing an asymmetry test. Publication bias28 ,29 was considered to be present if there was a non-zero slope coefficient (p<0.05), which suggested that only small studies reporting high accuracy had been published; alternatively, p>0.1 suggested that there was no evidence of notable publication bias.
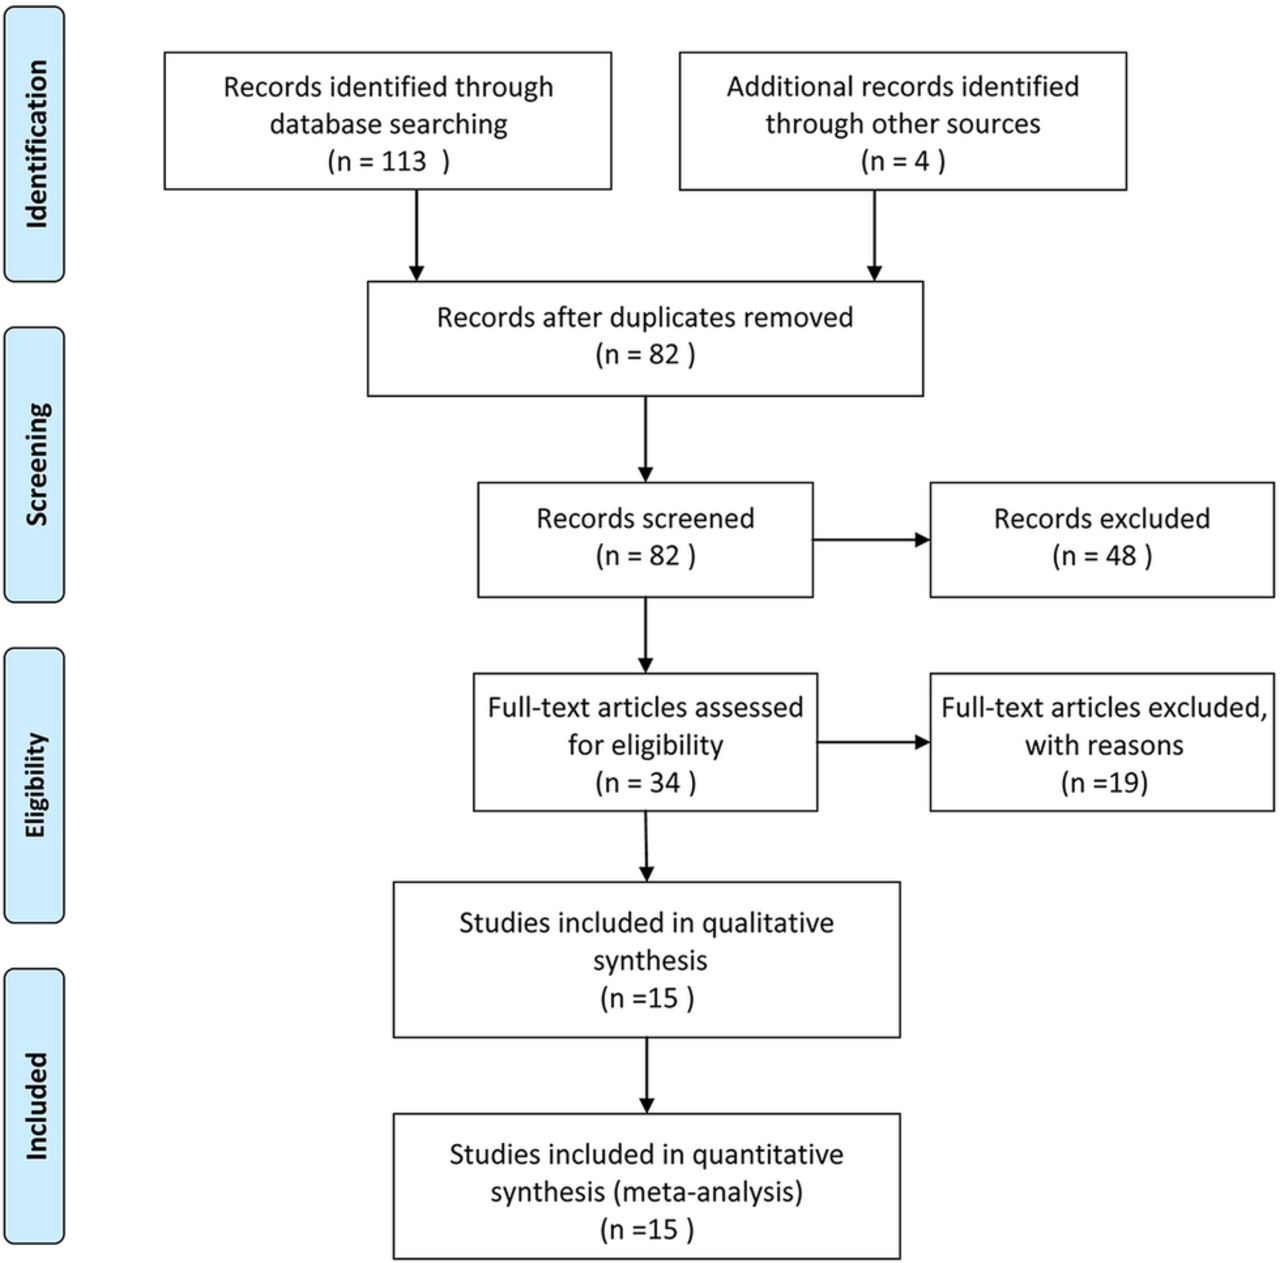
The Preferred Reporting Items for Systematic Reviews and Meta-Analyses statement30 was used to improve the reporting of our research (figure 1 and Checklist S2).

Flow chart illustrating the selection of studies.
Results
The database search initially yielded 113 potential literature citations; 4 additional results were identified by searching the grey literature (figure 1). After reviewing the titles and abstracts, 48 of these studies were excluded because they were duplicate publications or not relevant to this analysis. After reading the full texts, 19 of the remaining 34 articles were excluded because (1) the patients had previously undergone treatment, (2) the article lacked sufficient information to complete a 2×2 contingency table or (3) the study was not published in English or Chinese. Following the final screening process, 15 published studies were considered to have met all of our inclusion and exclusion criteria. The data abstracted from these individual studies are summarised in table 1. The quality was moderate in 15 studies, according to the QUADAS-2 items; the results for the distribution of the study design are shown in figure 2.
Characteristics of the included studies

Methodological quality of the 15 included studies. (A) Methodological quality graph: each methodological quality item is presented as the percentages across all included studies. (B) Methodological quality summary.
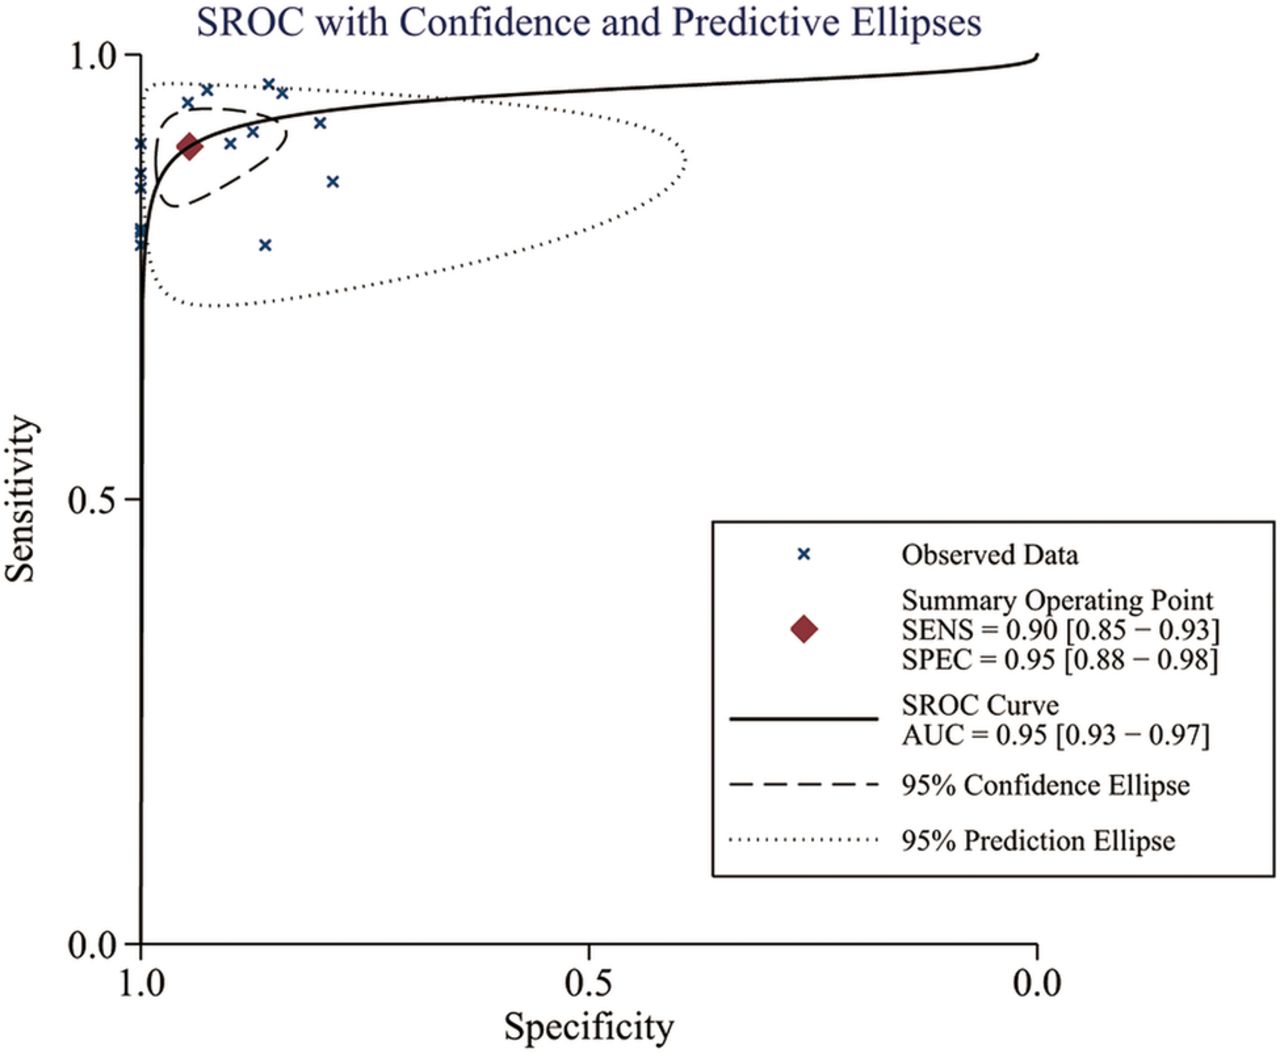
Significant heterogeneity was found based on the pooled analysis (I2=54.5%, p=0.055). Therefore, SEN, SPE, PLR and NLR were pooled using a random-effects coefficient binary regression model. The pooled weighted values were as follows: SEN 0.90 (95% CI 0.85 to 0.93); SPE 0.95 (95% CI 0.88 to 0.98); PLR 16.49 (95% CI 7.37 to 36.86); NLR 0.11 (95% CI 0.08 to 0.16); and diagnostic OR (DOR) 150.73 (95% CI 64.96 to 349.75). The AUC was 0.95 (95% CI 0.93 to 0.97). The forest plots and HSROC curves for the 15 studies are shown in figures 3⇓–5.

Forest plots of sensitivity (SEN) and specificity (SPE) with corresponding 95% CIs for diffusion-weighted image in the detection of thyroid nodules.

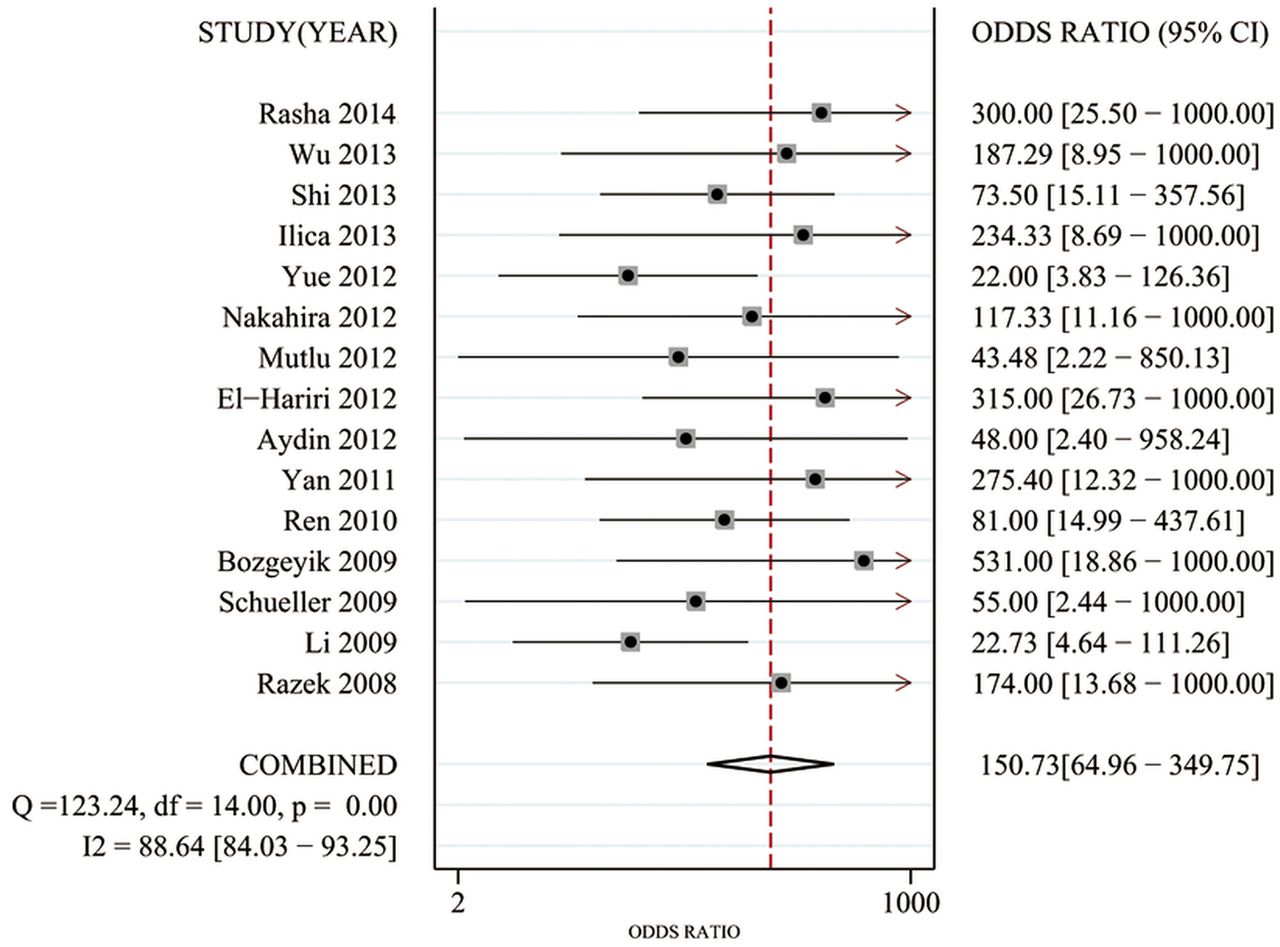
Forest plots of the diagnostic OR (DOR) with corresponding 95% CIs for diffusion-weighted image in the detection of thyroid nodules.

Hierarchical summary receiver operating characteristic (HSROC) curves from the bivariate model of diffusion-weighted image in the detection of thyroid nodules.
A Spearman rank correlation was performed as a further assessment of the threshold effect; the Spearman correlation coefficient was determined to be 0.081 (p=0.775). This result indicated that no notable threshold effect was detected in the accuracy estimates among individual studies.
The results of meta-regression indicated that study nation, study design, MRI field strength, reference standard, enrolment, disease spectrum, patient spectrum and b values were not strongly correlated with accuracy. The estimated SEN and SPE for each subgroup are presented in table 2.
Sensitivity and specificity estimates for each subgroup
The results of the Deeks funnel plot asymmetry test (p=0.786) showed no evidence of notable publication bias (figure 6).

The funnel plot of publication bias. Linear regression of the inverse root of the effective sample size (ESS) against the log DOR (diagnostic OR) was performed to assess funnel plot asymmetry.
Discussion
Thyroid nodules are highly prevalent and clinically difficult to manage. Compared with benign thyroid nodules, malignant thyroid nodules have larger nuclei, denser stroma and higher cell counts, all of which lead to increased cellularity and reduced extracellular space.31 Many studies11–14 ,18 ,32 ,33 and a systematic review34 demonstrated that the ADCs of malignant thyroid nodules are significantly smaller than those of benign nodules. A meta-analysis35 that included seven studies regarding the potential of DWI to differentiate between malignant and benign thyroid nodules was published in 2014, and suggested that DWI can be used as a diagnostic tool to distinguish benign from malignant thyroid nodules by measuring the ADC. In our study, eight additional references were included that were not present in the aforementioned meta-analysis. Unlike the previous meta-analysis, our meta-analysis examined the technical aspects of DWI and its additional value in tumour characterisation. Our results revealed for the first time that using a high b value may provide better results. The results of our meta-analysis showed that the pooled weighted SEN and SPE of the 15 included studies were 0.90 (95% CI 0.85 to 0.93) and 0.95 (95% CI 0.88 to 0.98), respectively. These results demonstrated that DWI has a high SEN and SPE for differentiating malignant from benign thyroid nodules.
The DOR represents the ratio of the odds of correctly diagnosing the diseased patients (true-positives) relative to the odds of obtaining a positive result among the non-diseased patients (false-positives). The DOR is closely linked to existing indicators and is particularly applicable to meta-analyses of diagnostic test performance. Because the DOR is derived from logistic models, it is possible to include additional variables to correct for heterogeneity.36 In our meta-analysis, we found that the estimated DOR for DWI was 150.73 (95% CI 64.96 to 349.75). This result indicated that DWI is an accurate modality for detecting malignant thyroid lesions.
We observed that the Spearman correlation coefficient was 0.081 (p=0.775); this result indicated that no significant threshold effect was detected. Additionally, our results indicated that none of the factors potentially impacting the meta-regression analysis results contributed to the observed heterogeneity. To determine whether there were other sources of heterogeneity, a subgroup analysis must be performed to detect the factors that impact heterogeneity.
The b value is a very important factor affecting image quality and ADC measurements. When low b values are applied, the ADCs tend to be higher due to the contribution of perfusion. Applying high maximum b values may be preferable when ADC measurements are performed to differentiate malignant from benign tissues exclusively based on their water diffusion characteristics. However, the signal-to-noise ratio decreases as the b value increases, thus limiting the maximum b value. Six of the studies included in this review used three or more pairs of b values to compute the ADC. Three of these six studies demonstrated that lower b values had a higher SEN and accuracy for differentiating benign from malignant nodules, whereas the remaining studies reported the opposite results. In our subgroup analysis, the results demonstrated that the pooled DORs of the 300, 500 and 1000 s/m2 subgroups were 47.04 (95% CI 11.55 to 190.54), 53.13 (95% CI 17.95 to 219.34) and 115.21 (95% CI 28.42 to 298.76), respectively. The diagnostic accuracy may be greater in the higher b value subgroups than in the lower b value subgroups. However, there were no notable differences in the DOR or the AUC between these subgroups.
Our study contains several inherent limitations that should be considered when interpreting our results. First, most of the studies included in our meta-analysis lacked a description of ADC reproducibility and were performed in Asian countries, and no studies were from Europe or North America. Some studies37 ,38 have noted that selective reporting is higher among Chinese studies than elsewhere, across several fields. This issue may represent one source of heterogeneity. Second, the sample size of these studies was relatively small, which is a particular problem in diagnostic studies.39 This limitation may result in an overestimation of the diagnostic accuracy, particularly in studies including non-representative samples of patients and invalid reference standards.40 Third, our meta-analysis was based only on published studies, which are prone to report positive or significant results; the studies in which results are not significant or negative are often rejected or not even submitted. Although it is suggested that the quality of the data reported in articles accepted for publication in peer-reviewed journals is superior to the quality of unpublished data,41 including only published studies may ultimately lead to reporting bias.
Conclusions
In conclusion, DWI has a high SEN and SPE, and may be a reliable, non-invasive and non-radiative imaging modality for the detection of thyroid nodules. Using a high b value may provide higher diagnostic accuracy. Nevertheless, large-scale trials are necessary to assess the clinical value of DWI, and to establish standards regarding b values and cut-off values for DWI-based diagnosis.
Acknowledgments
The authors thank AJE for help in English language editing.
References
Footnotes
LC and JX are co-first authors.
Contributors LC, JX, YX and JW conceived and designed the experiments. LC, JX and JW performed the experiments. JB, XH and XH analysed the data. JB, XH, XH and YX contributed reagents/materials/analysis tools. LC, JX and JW wrote the paper.
Funding This research received no specific grant from any funding agency in the public, commercial or not-for-profit sectors.
Competing interests None declared.
Provenance and peer review Not commissioned; externally peer reviewed.
Data sharing statement Additional data can be accessed via the Dryad data repository at http://datadryad.org/ with the doi:10.5061/dryad.s0s76.