Article Text

Abstract
Objective A liver biopsy is the ‘reference standard’ for diagnosing and staging liver fibrosis but with many disadvantages. Therefore, developing a non-invasive index for predicting fibrosis is very valuable. We developed and validated a novel non-invasive index for predicting significant fibrosis in patients with chronic hepatitis B infection.
Design A retrospective cohort study.
Setting Chronic hepatitis B virus-infected patients were recruited in the Department of Infectious Disease in the First Affiliated Hospital of Zhejiang University.
Participants A total of 506 patients were enrolled, and patients were randomly divided into estimation (n=253) and validation (n=253) cohorts.
Primary and secondary outcome measures Chronic hepatitis B virus-infected patients were studied retrospectively using routine parameters. A novel index was developed from an estimation cohort and validated in another cohort. Liver histology was assessed for fibrosis according to the Xi'an Meeting Scoring System. The novel index using α-fetal protein (AFP) and activated partial thromboplastin time (APTT; denoted AA index) was compared with 10 other indices using receiving operating characteristics curves. Multivariate forward stepwise regression analysis revealed that AFP and APTT were significantly associated with the Xi'an Meeting Scoring System, and were used to calculate the AA index (log index=−9.164+0.114×AFP+0.236×APTT).
Results The AA index predicted significant fibrosis with an area under the curve of 0.822, exhibited a significantly higher area compared with the other 10 indices in the estimation cohort, and was validated in the validation cohort.
Conclusions The AA index can be used to predict significant fibrosis, and may decrease the need for liver biopsy in patients with chronic hepatitis B infection.
- HISTOPATHOLOGY
- INFECTIOUS DISEASES
This is an Open Access article distributed in accordance with the Creative Commons Attribution Non Commercial (CC BY-NC 4.0) license, which permits others to distribute, remix, adapt, build upon this work non-commercially, and license their derivative works on different terms, provided the original work is properly cited and the use is non-commercial. See: http://creativecommons.org/licenses/by-nc/4.0/
Statistics from Altmetric.com
Strengths and limitations of this study
The AA index had an area under the receiver operating characteristic (AUROC) curve of 0.822, 0.845 and 0.893, respectively, for all patients, patients with alanine aminotransferase <2×upper limit of normal, and patients with hepatitis B e antigen negative for predicting significant fibrosis.
The AA index exhibited a significantly higher AUROC for the prediction of significant fibrosis compared with some non-invasive indices.
According to the cut-off values of 0.007 and 0.127, the presence of significant fibrosis was predicted with high sensitivity (90.5%) and high specificity (88.2%).
Hepatic fibrosis was evaluated only using the Xi'an stages.
Introduction
Chronic hepatitis B (CHB) virus infection poses serious public health problems, and can progress to liver fibrosis, liver cirrhosis and hepatocellular carcinoma.1 The degree of liver fibrosis is an important parameter in the determination of appropriate antiviral treatment and prognosis for patients with CHB.2 ,3
The ‘reference standard’ for evaluating the degree of liver fibrosis is liver biopsy.3
However, liver biopsy has some recognised limitations, such as its invasive nature, pain, sampling error, interobserver variability, non-dynamic evaluation of liver fibrosis and even a small risk of life-threatening complications.2 ,3 Owing to these limitations and risks, it is desirable to investigate novel non-invasive methods to evaluate liver fibrosis.4 These methods include biological approaches based on serum biomarkers of fibrosis and physical approaches based on the measurement of liver stiffness using transient elastography 3. In recent years, some non-invasive indices based on routine serum biomarkers have been demonstrated to have high diagnostic accuracy and cost-effectiveness in identifying significant fibrosis and cirrhosis in patients with CHB and/or hepatitis C.5 ,6
The aim of this study was to develop a novel predictive index based on routine parameters for predicting significant fibrosis according to the Xi'an Meeting Scoring System7 in patients with CHB. The diagnostic performance of the new index was then compared with that of several indirect non-invasive indices, including an aspartate aminotransferase (AST) to alanine aminotransferase (ALT) ratio (AAR),8 AST to platelet ratio index (APRI),9 Forns index,10 platelet count (PLT), age, AST, and international normalised ratio index (FIB-4),11 fibro-quotient (Fibro Q),12 AST, platelet, γ-glutamyl transpeptidase (GGT), and α-fetal protein (AFP) index (APGA),13 platelet, age, phosphatase, AFP, and AST index (PAPAS),14 Göteborg University Cirrhosis Index (GUCI),15 red cell distribution width (RDW) to platelet ratio (RPR),16 and globulin-platelet model (GP).17
Participants and methods
Participants
Seven hundred and eighty-seven consecutive urban and rural patients with CHB, including 476 male and 311 female aged 18–84 years (40.0±11.4 years) seen by the hepatology specialty Department of Infectious Disease, The First Affiliated Hospital, College of Medicine, Zhejiang University (China) between July 2010 and December 2013, were considered for inclusion in the study if they had received liver biopsy and a fasting serum sample collected on their first admission. A diagnosis of CHB infection required a previous history of hepatitis B or hepatitis B surface antigen (HBsAg) positivity for >6 months, and persistently positive HBsAg and/or hepatitis B virus (HBV) DNA.18 Exclusion criteria included age under 18 years; concurrent infection with hepatitis C virus (HCV), hepatitis D virus, hepatitis G virus and/or HIV; any autoimmune liver disease; hepatocellular carcinoma; metabolic liver disease; alcoholic liver disease (20 g/day for females, 30 g/day for males); liver transplantation; and decompensated cirrhosis. Two hundred and eighty-one patients were excluded because of the above reasons. Finally, 506 patients (337 male and 169 female, 37.45±9.60 years) were enrolled retrospectively. Written consent was obtained prior to liver biopsy. After receiving a liver biopsy (as described below), the cohort was randomly divided into estimation (n=253) and validation (n=253) cohorts for derivation of the prediction model for significant fibrosis and subsequent validation (figure 1).
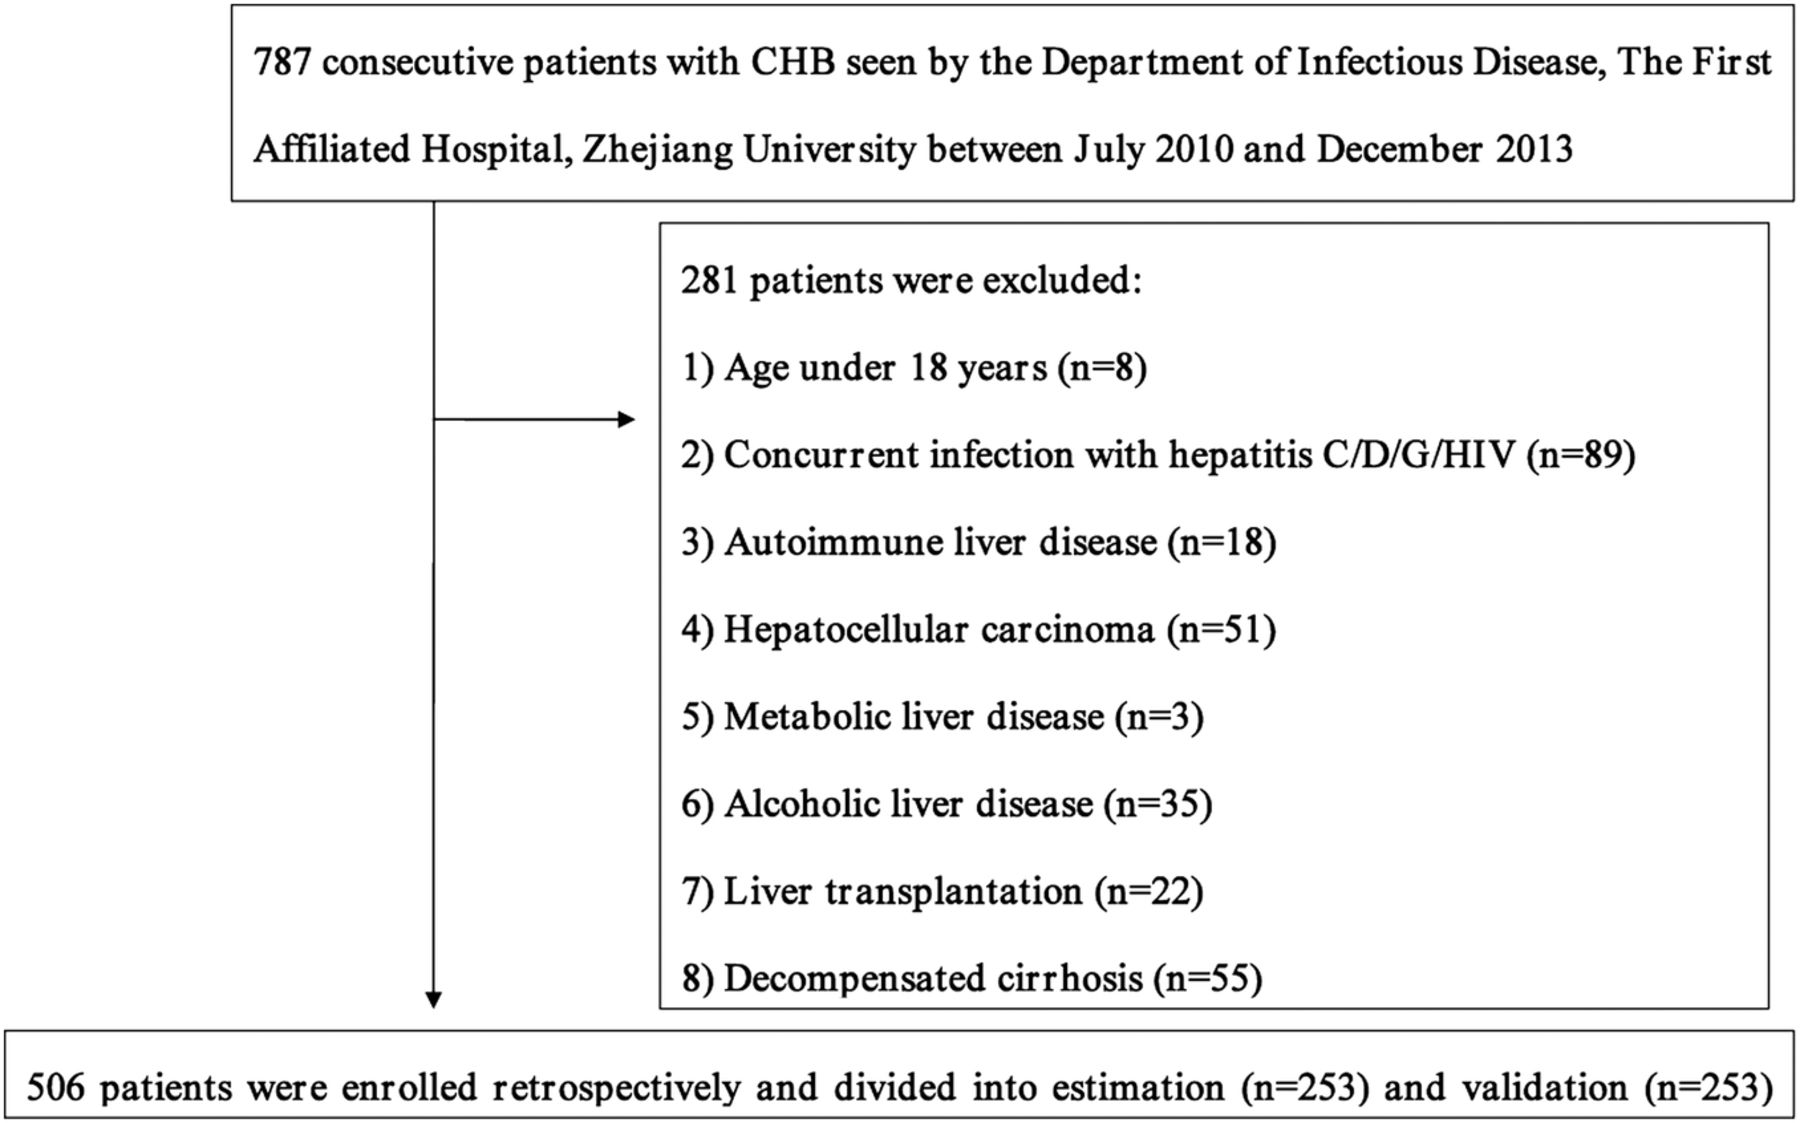
The flow diagram of the study (CHB, chronic hepatitis B).
Data collection
Patient demographics and laboratory parameters were recorded on the first admission. These included age, gender, HBsAg and hepatitis B e antigen (HBeAg) status, HBV DNA levels, ALT, AST, total bilirubin (TBIL), triglyceride (TG), total cholesterol (Tch), total protein (TP), albumin (ALB), alkaline phosphatase (ALP), GGT, fasting plasma glucose (FPG), AFP, activated partial thromboplastin time (APTT), D-dimers, fibrinogen, prothrombin time (PT), haemoglobin, RDW, white cell count (WCC), red blood cell (RBC) and PLT. The upper limit of normal (ULN) of ALT was 40 U/L in men and 35 U/L in women. The real-time fluorescent PCR system (7300; Applied Biosystems, Inc, Carlsbad, California, USA) was used to detect HBV DNA levels, with a lower limit of detection of 20 IU/mL. The ALT, AST, TBIL, TG, Tch, TP, ALB, ALP, GGT and FPG levels were measured on a Hitachi 7600 automatic biochemical analyser (Hitachi Ltd, Tokyo, Japan) using Roche Diagnostics GmbH reagents (Roche Diagnostics, Mannheim, Germany). HBsAg, HBeAg and AFP levels were measured on an Architect Ci8200 automated immunoassay analyser (Abbott Laboratories, Abbott Park, Illinois, USA) using Abbott reagents. APTT, PT and fibrinogen were measured by a coagulation method using a Sysmex CA7000 system (Sysmex, Kobe, Japan) and Siemens reagents (Siemens, Marburg, Germany).19 ,20 WCC, RBC and PLT was assessed using a Sysmex XE-2100 automated haematology analyser (Sysmex Corp, Kobe, Japan) using Sysmex reagents.
Liver biopsy
Liver biopsy enables the reliable diagnosis of hepatic lesions, and is an important aid to treatment and prognosis. For patients with HBV, liver biopsy is used for grading, staging, exclusion of comorbidities, evaluation of the degree of fibrosis and/or inflammation and is an important factor in the choice of an antiviral treatment strategy.21 The indications for liver biopsy in the current study were: viral hepatitis, autoimmune hepatitis, cholestatic liver diseases, storage diseases and metabolic diseases, acute liver failure, liver transplantation, tumour, and hepatopathy of unknown cause.21 All patients underwent percutaneous liver biopsy guided by ultrasonography. Liver biopsy was performed using 18G BioPince biopsy needles (InterV-MDTech, Gainesville, Florida). A minimum of 1.5 cm of liver tissue with at least five portal tracts was required for appropriate diagnosis. The specimens were fixed, paraffin-embedded and stained with H&E. The histological staging of liver fibrosis (S0–S4) of liver biopsy specimens was analysed according to the Xi'an Meeting Scoring System7 by a single pathologist who was unaware of patient characteristics. Hepatic fibrosis was assessed using the Xi'an Meeting Scoring System as follows: S0, no fibrosis; S1, fibrosis confined to portal tracts, periportal spaces and perisinusoidal spaces, or fibrous scar in the hepatic lobule; hepatic lobular structure integrity; S2, bridging fibrosis, mainly caused by bridging necrosis; most of the hepatic lobular structure integrity; S3, a lot of fibrous septa are separated and/or involve the hepatic lobule with distortion of the lobular structure, but without obvious cirrhosis; possible with portal hypertension and oesophageal varices; S4, early cirrhosis, liver parenchyma is damaged extensively, with diffuse fibre hyperplasia, liver cells are in various degrees of regeneration, and false flocculus is formed.7 S0 and S1 were considered to indicate no fibrosis, while S2, S3 and S4 were considered to indicate significant liver fibrosis.
Published non-invasive indices for predicting significant liver fibrosis
Some published non-invasive indices for significant fibrosis were calculated for each patient on the basis of previously described formulas which have been summarised in table 1. The indices included AAR,8 APRI,9 Forns index,10 FIB-4,11 Fibro Q,12 APGA,13 PAPAS,14 GUCI,15 RPR16 and GP.17
Summary of non-invasive indices for predicting significant liver fibrosis
Statistical analysis
Statistical analysis was performed using SPSS V.16.0 (SPSS Inc, Illinois, USA) and MedCalc V.9.3 software (MedCalc, Mariakerke, Belgium). Data are presented as mean±SD or median (range), and categorical data are presented as percentages. For continuous variables, the differences between two groups were assessed with an independent samples t test or the Mann-Whitney U test, as appropriate. Categorical variables were analysed using the χ2 test. Spearman’s rank correlation test was used for correlation analysis. Multivariate forward stepwise regression analysis was used to assess the association between the clinical/laboratory parameters and the Xi'an Meeting Scoring System fibrosis stages and to develop an index for predicting significant fibrosis. A predictive index was constructed by modelling the values of independent variables and their coefficient of regression. The receiver operating characteristic (ROC) curve was used to assess the diagnostic performance of the novel index. Differences between the diagnostic performance of the novel index and other non-invasive indices were compared by using ROC curves and the area under the ROC (AUROC) curves. Statistical significance was defined at two sides as p<0.05.
Results
Baseline characteristics of the patients
The enrolled patients with CHB were divided into two cohorts: the estimation cohort and the validation cohort. The demographic, laboratory and histological characteristics of the estimation cohort, validation cohort and entire cohort are shown in table 2. There were no significant differences in demographic and laboratory parameters between the estimation and validation cohorts, except that the ALT levels were significantly higher in the estimation cohort than those in the validation cohort.
Baseline characteristics of the patients in the estimation and validation cohorts
Development of a novel index for predicting significant fibrosis
The relevant variables of the estimation cohort based on the Xi'an Meeting Scoring System (S0–1 and S2–4) are shown in table 3. The RDW, GGT, ALP, PT, APTT and AFP levels were significantly higher in the S2–4 group than those in the S0–1 group, while the PLT, TP, ALB, TG and Tch levels were significantly lower. Other demographic and laboratory parameters were not significantly different between the S2–4 and S0–1 groups. Among these variables, AFP (p=0.039) and APTT (p<0.001) were identified as independent predictors for significant fibrosis based on multivariate forward stepwise logistic regression analysis. The relationship between the Xi'an Meeting Scoring System stages and AFP and APTT separately are displayed in figure 2. It was clear from figure 2 that as the fibrosis progressed, the AFP and APTT levels increased. The Spearman correlation coefficient for AFP and APTT, and the Xi'an Meeting Scoring System stages (Xi'an stages) were 0.305 (p=0.001) and 0.289 (p<0.001), respectively. A novel index (denoted the AA index) for predicting significant fibrosis was constructed and expressed by a formula consisting of AFP and APTT:
Variables associated with significant fibrosis in the estimation cohort

Box plots displaying the values of α-fetal protein and activated partial thromboplastin time based on the Xi'an Meeting Scoring System. The top and bottom of each box represents the 25th and 75th centile intervals. The line through the box in the median and the error bars are the 5th and 95th centile intervals (APTT, activated partial thromboplastin time).
The χ2 Hosmer-Lemeshow test was 4.215 (p=0.837), and the Spearman correlation coefficient for the new index and Xi'an stages was 0.416 (p<0.001).
Diagnostic performance of the AA index
The diagnostic performance of the AA index for predicting significant fibrosis was assessed using the ROC curve. It was found that the AA index had an AUROC curve of 0.822 (SE=0.055; 95% CI 0.714 to 0.930; p<0.001) for predicting significant fibrosis in the estimation cohort.
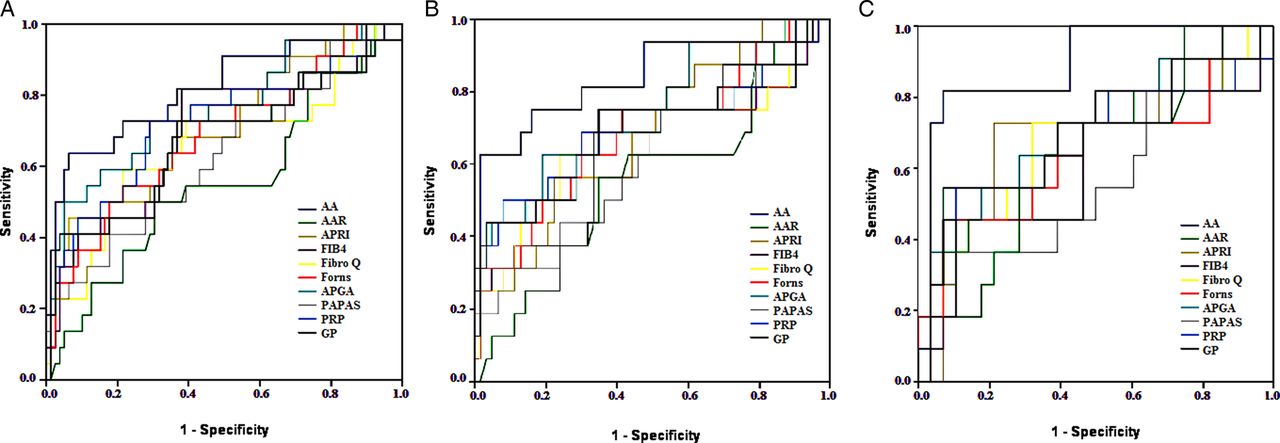
The AA index was compared with 10 other published non-invasive indices, as shown in table 1. The AA, FIB-4, APRI, Forns, Fibro Q, APGA, GUCI, RPR and GP indices were all correlated with significant fibrosis (r=0.465, 0.247, 0.229, 0.253, 0.182, 0.367, 0.261, 0.272 and 0.253, respectively (all p<0.05)) in the estimation cohort, except AAR (r=0.039, p=0.566) and PAPAS (r=0.183, p=0.063). The AUROC of the AA and other indices for predicting significant fibrosis in all patients, patients with ALT levels lower than the twofold ULN (ALT <2×ULN), and patients with HBeAg negativity in the estimation cohort are shown in table 4. The ROC curves for AA and these 10 indices for all patients, patients with ALT <2×ULN, and HBeAg-negative patients are shown in figure 3A–C, respectively. The AA index exhibited a significantly higher AUROC for the prediction of significant fibrosis compared with AAR (p=0.003) and PAPAS (p=0.033). No significant differences were observed between the AUROCs of FIB-4 (p=0.141), Forns (p=0.123), APGA (p=0.444), GP (p=0.101), APRI (p=0.177), Fibro Q (p=0.078), GUCI (p=0.262), and RPR (p=0.262) indices and AA index in the prediction of significant fibrosis.
AUC of AA and other non-invasive indices in the estimation cohort
Receiver operating characteristic curves for prediction of significant fibrosis in the estimation cohort using the new index in comparison with several other calculated indices. (A) All patients; (B) patients with ALT <2×ULN; (C) patients HBeAg negative. AA, the new index consisted of α-fetal protein and activated partial thromboplastin time; AAR, aspartate aminotransferase to ALT ratio; ALT, alanine aminotransferase; APGA, α-fetal protein index; APRI, aspartate aminotransferase to platelet ratio index; FIB-4, international normalised ratio index; GP, globulin-platelet model; HBeAg, hepatitis B e antigen; PAPAS, aspartate aminotransferase index; RPR, red cell distribution width to platelet ratio; ULN, upper limit of normal.
Definition cut-off values
We selected low (0.007) and high (0.127) cut-off values that achieved an excess of 90% for both sensitivity and specificity in the diagnosis of significant fibrosis in the estimation cohort. The sensitivity, specificity, positive predictive value, negative predictive value, positive likelihood ratio (+LR) and negative likelihood ratio (−LR) of AA are shown in table 5.
Diagnostic accuracy of AA index in the estimation and validation cohorts
Validation cohort
Applying the new AA index to the validation cohort, the AUROC for predicting significant fibrosis was 0.773 (SE=0.053; 95% CI 0.669 to 0.877; p<0.001). The AUROC in the total cohort was 0.795 (SE=0.038; 95% CI 0.720 to 0.871; p<0.001). There were no significant differences in the areas under curve (AUCs) between the estimation and validation cohorts (Z=0.642, p=0.521). The AA, FIB-4, APRI, Forns, Fibro Q, APGA, PAPAS, GUCI, RPR and GP indices all correlated well with significant fibrosis (r=0.358, 0.247, 0.271, 0.285, 0.168, 0.323, 0.211, 0.291, 0.274 and 0.256, respectively (all p<0.05)) in the validation cohort, except AAR (r=−0.023, p=0.736). The AUROCs of AAR, FIB-4, APRI, Forns, Fibro Q, APGA, PAPAS, GUCI, RPR and GP indices were 0.412, 0.670, 0.707, 0.708, 0.592, 0.745, 0.672, 0.722, 0.689 and 0.716, respectively. The AA index exhibited a significantly higher AUC in the prediction of significant fibrosis compared with AAR (p<0.001) and Fibro Q (p=0.008). No significant difference was observed between the AUROCs of FIB-4 (p=0.079), Forns (p=0.154), APGA (p=0.366), GP (p=0.209), APRI (p=0.181), PAPAS (p=0.113), GUCI (p=0.249), and RPR (p=0.132) indices and the AA index in the prediction of significant fibrosis. The AUROCs of AA, AAR, FIB-4, APRI, Forns, Fibro Q, APGA, PAPAS, GUCI, RPR and GP indices were 0.792, 0.187, 0.448, 0.556, 0.606, 0.390, 0.683, 0.564, 0.633, 0.579 and 0.595, respectively, for HBeAg-negative patients, and were 0.762, 0.407, 0.665, 0.696, 0.677, 0.618, 0.698, 0.570, 0.692, 0.693 and 0.698, respectively, for patients with ALT <2×ULN. According to the cut-off values of 0.007 and 0.127, the presence of significant fibrosis was predicted with high sensitivity (90.5%) and high specificity (88.2%) in the validation cohort (table 5).
Discussion
Many studies have indicated that non-invasive indices containing simple serum markers are valuable in the evaluation of liver fibrosis in patients with chronic liver diseases.8–17 Most of the non-invasive methods were developed in patients with chronic hepatitis C (CHC) virus infections.9–12 ,15 In recent years, these indices have been used to evaluate patients with CHB.13 ,14 ,16 ,17 In CHB, evaluation of liver fibrosis is crucial since HBV cannot be eradicated completely from the patient by treatment for the persistence of covalently closed circular DNA in the nucleus of infected hepatocytes.22 ,23 The European Association for the Study of the Liver (EASL) guidelines have stated that non-invasive evaluation of fibrosis would be of interest in CHB.24 Although these methods cannot replace liver biopsy in chronic liver diseases, they narrow the group which really needs biopsy and provides an evaluation of liver damage without biopsy.24 Many clinicians have already used these tests for patients with CHB in the same way as for CHC.21
The AA index was based on two routine serum parameters: AFP and APTT. The Spearman correlation found that AFP and APTT were significantly correlated with the Xi'an stages. The addition of other variables in our study did not further improve the accuracy of the index. AFP has been shown in previous studies to be associated with significant fibrosis in CHB.13 ,14 ,17 ,25 ,26 AFP is related to hepatic impairment and chronic fibrosis and can aid in the differential diagnosis of hepatic diseases.25 APTT measures the intrinsic pathway of coagulation, and the APTT values are in accordance with the fact that the degree of impairment of clotting factors is related to the severity of liver damage.27 There were some non-routine parameters used in some indices for predicting fibrosis, including hyaluronic acid, α-2 macroglobulin, haptoglobin, apolipoprotein A1 and Golgi protein 73; however, the use of these parameters in predictive models might hinder the widespread use of these indices.22 ,25 ,28 ,29
Liver biopsy also has its limitations and the AUROC cannot be compared with that of other studies when the prevalence of the different stage of fibrosis are not the same. The AUROC in evaluating non-invasive indices of fibrosis never reached a perfect value of 1.0, and barely reached 0.90.30 ,31 Indices such as FIB-4, GUCI, APRI, Fibro Q and Forns were developed based on patients with CHC,9–12 ,15 while APGA, PAPAS, RPR and GP indices were developed based on patients with CHB.13 ,14 ,16 ,17 Even with use of the same indices, a different study population will lead to different results; only the APGA, RPR and GP indices were based on a Chinese population. The AUROCs of FIB-4, GUCI, APRI, Fibro Q and Forns indices for patients with CHB in our estimation and validation cohorts were all lower than those of previous studies with patients with CHC.9–12 ,15 A study by Erdogan et al32 also evaluated the AUROC of FIB-4, GUCI, APRI, Fibro Q and Forns indices in patients with CHB and found that the AUROC of these indices in patients with CHB were lower than the AUROC in patients with CHC.9–12 ,15 which is similar to the current results. The pathogenesis of liver fibrosis in CHB is different from that of CHC.33–36 First, the total amount of liver fibrosis reflected by the fibrosis area is significantly lower in CHB than in CHC.34 Second, patients with hepatitis B tend to progress to cirrhosis with larger nodules (macronodular cirrhosis) than patients with hepatitis C.34 Third, bridging necrosis is the main pathogenic change of fibrosis progression in CHB. However, CHC has a more progressive natural history with persistent inflammation associated with liver fibrosis and cirrhosis.33 Fourth, hepatic stellate cells (HSCs) have a key role in the development of fibrosis in chronic liver disease, and activated HSCs synthesise and secrete chemokines, extracellular matrix proteins and other factors, all of which contribute to remodel liver fibrosis.35 ,36 HBV Dane particles and X and C protein may induce HSC proliferation through the platelet-derived growth factor (PDGF)-B/PDGF receptor-β signal pathway.36 However, HCV core protein may directly activate hepatic fibrogenesis by a toll-like receptor 2-dependent manner.35 Fifth, the liver biopsies in these studies were assessed for fibrosis stages according to different staging systems,9–12 ,14–16 except that APGA was based on liver stiffness measurements.13 The Scheuer,10 Ishak9 ,14 ,15 and METAVIR11 ,12 ,16 staging systems are often used in clinical pathology, but the Xi'an stages7 are widely used in China. These staging systems all have advantages and disadvantages.37 A comparison of the four staging systems for chronic hepatitis fibrosis stages are listed in table 6; the selection of the staging system depends on the comfort of the pathologist and the needs of the involved clinicians.37 ,38 Compared with FIB-4, GUCI, APRI, Fibro Q and Forns, which were developed based on patients with CHC by ROC analyses,9–12 ,15 the AA index is more suitable for patients with CHB, FIB-4, GUCI, APRI, Fibro Q; Forns is more suitable for patients with CHC. The APGA, PAPAS, RPR and GP indices were developed based on patients with CHB.13 ,14 ,16 ,17 However, the APGA was based on liver stiffness measurements, and not on liver biopsy, and the study population of the PAPAS was not Chinese.
Four stage systems for chronic hepatitis fibrosis stages
Defects in the design of diagnostic studies include problems with the study population and bias. Despite the fact that ROC analysis is widely used in diagnostic test evaluations, a proper design with a broad study population and avoidance of bias are required to obtain valid and reliable conclusions in the assessment of diagnostic test evaluations.39 A broad study population is required to evaluate the accuracy and specificity. Bias can manifest in many different ways, including different diagnosis procedures and a non-blind design. Bias can lead to a false low or high sensitivity/specificity and, therefore, a false low or high AUC.39 In this study, we included varying degrees of fibrosis (S0–S4). Although the prevalence of severe fibrosis (S4) was low, hepatic fibrosis was assessed using the Xi'an staging system, which led to a limitation in the comparison of AUCs. Low (0.007, absence of fibrosis) and high (0.127, presence of fibrosis) cut-off values that achieved high sensitivity and specificity for the diagnosis of significant fibrosis were selected. A clinician may choose not to perform a liver biopsy with an AA index <0.007 or >0.127, avoiding biopsy-associated risks and costs, and may choose a clinical follow-up instead. International guidelines of CHB suggest that patients with CHB with ALT >2×ULN should be treated. However, recent reports have suggested that patients with CHB with persistently normal ALT levels may experience severe histological liver damage.29 ,40 HBeAg-negative patients with CHB are usually asymptomatic for the first 30–40 years.41 The characteristics, therapy and prognosis of HBeAg-negative CHB are different from those of positive ones, spontaneous recovery of HBeAg-negative CHB is rare, and the long-term prognosis is poor with rapid evolution to cirrhosis and hepatocellular carcinoma.41 ,42 Therefore, the degree of hepatic fibrosis can guide treatment decisions and monitor progress in patients with ALT <2×ULN and that are HBeAg negative.43 ,44 Only a few studies have addressed ALT <2×ULN and HBeAg-negative patients with CHB with hepatic fibrosis.43 ,44 Our study found that the AUCs of the AA index in our study were higher than those of other indices, and may be useful to predict significant fibrosis in patients with CHB with ALT <2×ULN who are HBeAg negative.
This study has several limitations. First, hepatic fibrosis was evaluated only using the Xi'an stages by a single pathologist, and APPT and AFP are not available in some developing countries. Second, some liver tissue had only five portal tracts in the liver biopsy. Since this is less than the recommended 11 portal tracts,45 this is a clear limitation of this study. Third, the AA index was developed for patients with CHB, and the prevalence of severe fibrosis in the Chinese CHB population was low; thus, the AA index may not be applicable to patients with CHC or other causes of hepatic fibrosis and other ethnic populations. Fourth, some non-routine parameters used in some indices for predicting fibrosis, including hyaluronic acid, α-2 macroglobulin, haptoglobin, apolipoprotein A1 and Golgi protein 73, were not available for use in this study.22 ,25 ,28 ,29 Fibrotest (Fibrosure in the USA) is a non-invasive index for predicting significant fibrosis in patients with CHC or CHB. The laboratory parameters for calculating Fibrotest include α-2 macroglobulin, apolipoprotein A1, haptoglobin, GGT and TBIL obtained on the same day as liver biopsy. However, α-2 macroglobulin and haptoglobin were not routinely available in our hospital. Therefore, it was not possible to perform Fibrotest, and compare the AUROC of the AA index for predicting significant fibrosis with that of Fibrotest. The AUROC of the Fibrotest index for predicting significant fibrosis was reported by Leroy et al22 to be 0.77 (95% CI 0.71 to 0.83), which was smaller than that of our study. In contrast, Kim et al46 found that the AUROC was 0.903 (0.838 to 0.968), which was larger than that of our study. Moreover, FibroScan can calculate liver elasticity using a low frequency elastic wave transmitted through the liver, and has been considered the most accurate non-invasive model to assess liver fibrosis among patients with chronic liver diseases due to various aetiologies.47 While FibroScan certainly has value as a non-invasive measure of liver fibrosis, the instrument was not available in our institution. Therefore, we were unable to compare results and also our index with these indices. Fifth, although the AA index can be accurately used to predict significant fibrosis, it cannot truly replace histological fibrosis staging. The AA index is likely to be most useful as a supplement to liver biopsy. Sixth, larger sample sizes as well as multicentre and multiethnic studies will be necessary to validate the clinical application of the AA index. These non-invasive indices were used to diagnose significant fibrosis (F2) and/or cirrhosis (F4) using various AUROC and cut-off values. However, we only studied a binary comparison of no fibrosis (S0, S1) versus some fibrosis (S2, S3, S4). If only a small number of patients with advanced fibrosis were included in the studies, the accuracy of the non-invasive indices for higher stages of fibrosis (F3 and F4) can influence the validity of the serum markers investigated.5 ,15 ,16 A small number of patients with advanced fibrosis is a limitation of this study. In conclusion, we found that an index (AA) containing AFP and APTT can accurately predict significant fibrosis in patients with CHB with ALT <2×ULN that are HBeAg negative. The AA index is more accurate than the AAR, APRI, Forns, FIB-4, Fibro Q, APGA, PAPAS, GUCI, RPR and GP indices. The parameters used in the AA index are widely available, and can be used as a non-invasive index to predict significant HBV-related fibrosis. Use of the AA index may decrease the need for liver biopsy in patients with CHB.
Acknowledgments
The authors thank Medjaden Bioscience, Limited for helping in proofreading and editing the manuscript.
References
Footnotes
Contributors YZ and LF contributed to the study conception/design. LF, KS, JZ and GF contributed to the data collection. YZ and LF conducted the data analysis, critically revised the article and reviewed the draft of the article.
Funding This work was supported by grants from the Department of Education Foundation of Zhejiang Province, China (numbers Y201017380 and Y201330146).
Competing interests None declared.
Patient consent Obtained.
Ethics approval This study was approved by the ethics committee of the First Affiliated Hospital of Zhejiang University School of Medicine, China.
Provenance and peer review Not commissioned; externally peer reviewed.
Data sharing statement No additional data are available.