Article Text

Abstract
Objectives Reducing cancer screening inequalities in England is a major focus of the 2011 Department of Health cancer outcome strategy. Screening coverage requires regular monitoring in order to implement targeted interventions where coverage is low. This study aimed to characterise districts with atypical coverage levels for cervical or breast screening.
Design Observational study of district-level coverage in the English Cervical and Breast screening programmes in 2012.
Setting England, UK.
Participants All English women invited to participate in the cervical (age group 25–49 and 50–64) and breast (age group 50–64) screening programmes.
Outcomes Risk adjustment models for coverage were developed based on district-level characteristics. Funnel plots of adjusted coverage were constructed, and atypical districts examined by correlation analysis.
Results Variability in coverage was primarily explained by population factors, whereas general practice characteristics had little independent effect. Deprivation and ethnicity other than white, Asian, black or mixed were independently associated with poorer coverage in both screening programmes, with ethnicity having the strongest effect; by comparison, the influence of Asian, black or mixed ethnic minority was limited. Deprivation, ethnicity and urbanisation largely accounted for the lower cervical screening coverage in London. However, for breast screening, being located in London remained a strong negative predictor. A subset of districts was identified as having atypical coverage across programmes. Correlates of deprivation in districts with relatively low adjusted coverage were substantially different from overall correlates of deprivation.
Discussion These results inform the continuing drive to reduce avoidable cancer deaths in England, and encourage implementation of targeted interventions in communities residing in districts identified as having atypically low coverage. Sequential implementation to monitor the impact of local interventions would help accrue evidence on ‘what works’.
- PREVENTIVE MEDICINE
- EPIDEMIOLOGY
- PUBLIC HEALTH
This is an Open Access article distributed in accordance with the Creative Commons Attribution Non Commercial (CC BY-NC 4.0) license, which permits others to distribute, remix, adapt, build upon this work non-commercially, and license their derivative works on different terms, provided the original work is properly cited and the use is non-commercial. See: http://creativecommons.org/licenses/by-nc/4.0/
Statistics from Altmetric.com
Strengths and limitations of this study
This study reports on an analysis of breast and cervical screening coverage rates to identify district-level factors associated with high and low coverage.
This is the first study to characterise English districts with atypically high or low cervical or breast screening coverage using a risk adjustment approach.
At district level, high rates of deprivation, urbanisation and ethnic minority groups other than Asian, black or mixed remain independent predictors of lower coverage for both programmes, and explain most of the lower cervical screening coverage seen in London.
Districts with atypically low screening coverage displayed distinct correlation patterns between their population characteristics, in particular with regard to deprivation: these districts may benefit from the development of new approaches to target the low-attending communities living within their boundaries.
This study deals only with area-level rather than individual-level factors. However, this is often the only data available on participation in public health interventions; the method used is fairly simple and could easily be applied to other settings.
Introduction
The English National Cervical and Breast Screening Programmes aim to either prevent cancer by treating precancerous changes or diagnose cancer at earlier stages when treatment outcomes are more successful.1 ,2 Their success is dependent on high levels of participation.3
Reducing cancer screening inequalities in England is a major focus of the 2011 Department of Health cancer outcome strategy to promote early diagnosis and save lives.4 ,5 There is a need to characterise districts that require most support in reducing inequalities, or those which could be used as leading examples.
Funnel plots overlapped with control limits have been shown to be a useful tool for comparing proportional outcomes between centres or districts.6–8 The outcome is plotted against a measure of precision for each district, and control limits are set around the target value. Districts lying outside the limits are subject to ‘special-cause variation’ and may benefit from further investigation. Control limits can be adjusted to incorporate sources of variation, such as demographic and socioeconomic factors, in order to identify districts with atypically high or low outcomes, given their known characteristics.8 ,9
Identification of atypical districts might be expected to be a simple matter. It is, however, challenging due to the necessarily incomplete nature of aggregate data, the possible collinearities in such data, and the multiplicity of model choices even with the relatively small numbers of potential risk factors.
Factors associated with variation in screening coverage in England have previously been identified: deprivation, non-Caucasian ethnicity and poorer levels of primary care service have been found linked with lower attendance at both cervical10 ,11 and breast12 ,13 screening. In addition, coverage in London has generally been observed to be lower than the national average.1 ,2
We constructed funnel plots to display the scatter of cervical and breast screening coverage around the national average in areas defined by former English Primary Care Trusts (PCTs), which were the commissioning groups for GPs at the time of data collection. We developed risk adjustment models based on demographic, socioeconomic and primary care characteristics, and control limits were adjusted accordingly. Districts with atypically high or low coverage were identified, and associations among district characteristics were investigated in an attempt to highlight those districts where further investigation may be beneficial in informing policy to improve coverage.
Methods
Data source
Coverage data were available in 151 PCTs (referred to in this paper as districts) defined by the commissioning groups of GPs at the time the data were collected, that is, from the English PCTs. Data from April 2011 to March 2012 were sourced from the Health & Social Care Information Centre (HSCIC).1 ,2 Cervical screening coverage was defined as the percentage of eligible women registered with a general practice who had an adequate screening test performed within the last 3.5 years for patients aged 25–49 years, and within the last 5 years for patients aged 50–64 years. District-level data were obtained for the two age groups separately. Breast screening coverage was defined as the percentage of eligible women registered with a general practice, who had an adequate screening mammogram within the last 3 years. Data for women aged 50–64 years were obtained to match the older cervical screening group.
The percentage of urbanisation within each PCT was derived from the urban-rural classification.14 For two PCTs with missing data (Stockton-on-Tees, Isle of Wight), the local authority urbanisation score was used instead.
The income deprivation domain score from the English Indices of Multiple Deprivation 2010 was obtained and the percentage deprivation calculated as a population-weighted average of Lower Super Output Area income deprivation score.15
Ethnicity data and the percentage of the total population without any higher education were sourced from the Office of National Statistics 2011 Census.16 ,17 For ethnicity, two explanatory variables were derived: the percentage of Asian, black, or mixed ethnic minority groups, and the percentage of ‘other’ ethnic minority groups, which includes Asian and African Arabs, and any other ethnic minority groups (eg, Polynesians, Melanesians and Micronesians).
Data relating to general practice characteristics were sourced from the HSCIC18 and included average list size, percentage of single-handed practices (only 1 working provider or salaried/other general practitioner (GP) with possible additional GP registrar/retainer), practitioner headcount (excluding retainers and registrars) per 105 population, practice staff (excluding GPs and registrars) full-time equivalent (FTE), and percentage of GPs who attained their primary medical qualification outside the UK.
Statistical analysis
Grouped logistic regression was applied to coverage data aggregated at district level.19 A generalised linear model with quasi-binomial error distribution was used to account for within-district extra-binomial variation.20 For the purpose of the analysis, variables were classified as ‘population’ and ‘general practice’ risk factors (table 1). Continuous covariates were mean-centred. Covariates found to be significant at the 1% level using Wald tests in univariate analyses21 were considered for inclusion in two multiple regression submodels, the first including population factors only, and the second including general practice factors only. Correlation and collinearity were evaluated based on Pearson correlation coefficients (see online supplementary file table A1), and generalised variance-inflation factors for covariate coefficients, respectively.22 Differences in correlation coefficients between independent groups were assessed for significance by applying Fisher's z test on z-transformed correlations.23
District-level summary of population factors, general practice factors, and screening coverage in England in 2012 (n=151)
The full regression model was built by including both population and general practice factors that were significant at the 5% level in the submodels. Per cent of deviance (−2 log-likelihood statistic) explained by the adjusted model compared with the null (unadjusted) model was used as a descriptive measure of attribution of variation.19
Funnel plots of coverage against eligible population in each district were constructed.9 The covariate-adjusted coverage proportion for each district was calculated as the product of the national average by the ratio of observed to expected values from the full regression model. The national average for coverage was used as a target value, and the 95% and 99.8% control limits were plotted around it using the asymptotic normal approximation, with a variance inflation factor for extra-binomial variation (details available from NJM).24 All statistical analyses were performed in R version 3.0.2 (2013-09-25).
Results
Data description
District-level data on cervical (age groups 25–49 and 50–64) and breast (age group 50–64) screening coverage are summarised in table 1, overall, and separately for London and the rest of England. Between-district variability was more pronounced for the breast screening group (median 76.9, IQR 6.5) and the cervical screening age group 25–49 (median 74.6, IQR 5.9) than for the cervical screening age group 50–64 (median 77.5, IQR 3.5, table 1). The difference in coverage level between London and the rest of England was also larger for the breast and younger cervical screenings groups, with median coverage 7–8% lower in London.
Relationships between population, general practice factors, and coverage
Tables 2–⇓4 show the unadjusted and adjusted ORs of the associations between population and general practice risk factors, and coverage. Each factor was found to be univariately associated with coverage in all screening groups, except for the percentage of population with no higher education and the practitioner headcount, which were only significant for the cervical screening group aged 25–49 years.
Regression modelling for cervical screening coverage among women aged 25–49 years
Regression modelling for cervical screening coverage among women aged 50–64 years
Regression modelling for breast screening coverage among women aged 50–64 years
Variability in coverage was primarily explained by population factors, with general practice characteristics only accounting for a small fraction of the residual variability (<2% of total deviance after adjustment for population factors). Population covariates explained a lesser percentage of the total deviance among the cervical screening group aged 50–64 years (45%, table 3) than the cervical screening group aged 25–49 years (78%, table 2) or the breast screening group (72%, table 4); overall variability was also lowest among the former group (IQR 3.5 vs IQR 5.9 and 6.5, respectively, table 1).
With regard to general practice factors, only staff FTE remained positively associated with cervical screening coverage after accounting for population factors (table 3).
After adjusting for deprivation, ethnicity and education, residing in London and urbanisation were no longer significantly associated with lower cervical screening coverage, but both remained associated with lower breast screening coverage.
Deprivation remained inversely associated with coverage in all screening groups, but displayed some collinearity with other factors for the cervical screening group aged 25–49 years (table 2).
Absence of higher education remained associated with higher coverage in the cervical screening group aged 25–49 years after adjusting for other population factors (table 2). In this latter group, the effect of deprivation and education were no longer significant when the model accounted for the percentage of registered women aged 25–29 years (see online supplementary file table A2.1).
After adjusting for other population factors, the percentage of ‘other’ ethnic minority groups remained negatively correlated with coverage in all screening groups, whereas the percentage of Asian, black or mixed ethnic minority groups was no longer associated with lower breast screening coverage (tables 3 and 4).
Identification of districts with atypical coverage
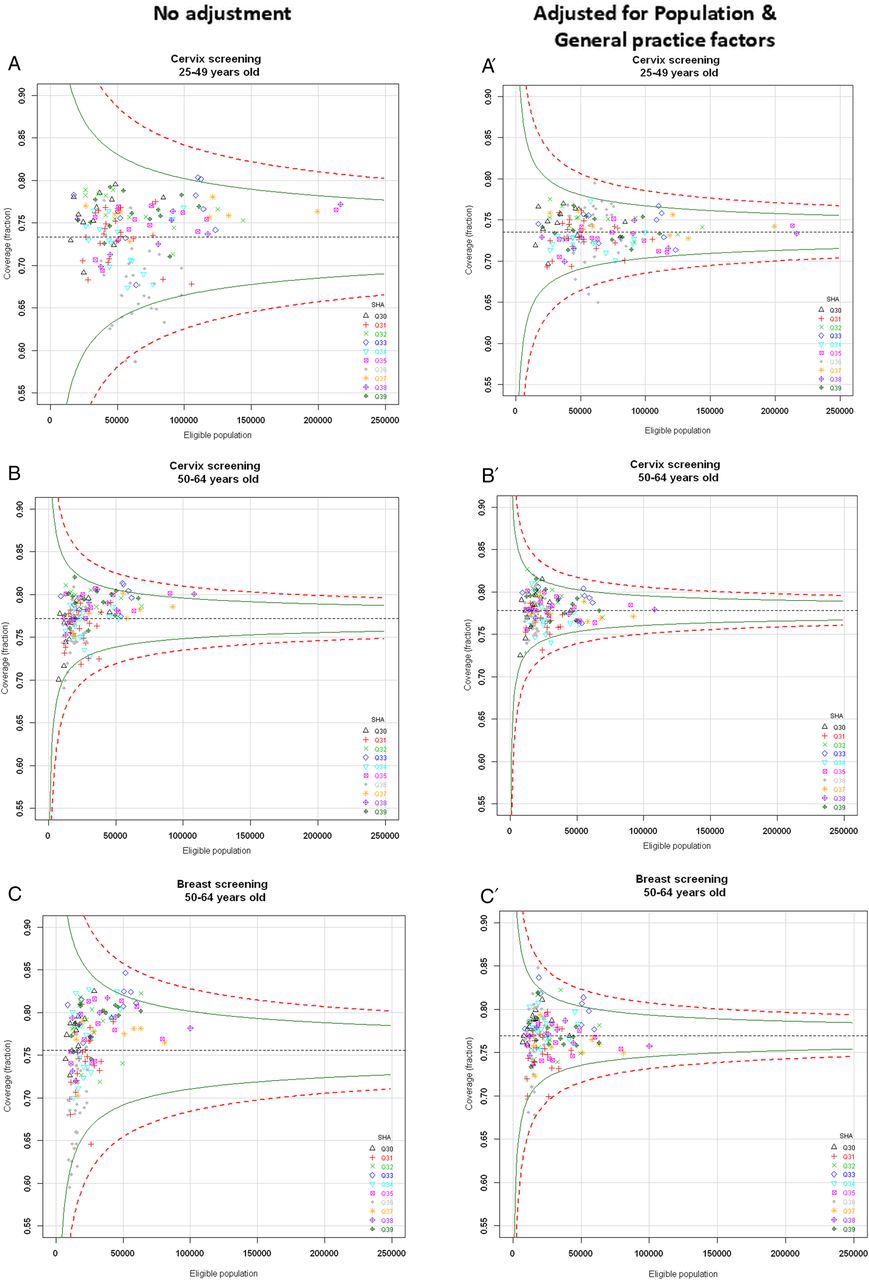
Figure 1 illustrates the districts with coverage estimates lying outside the control limits prior to (figure 1A–C) and after (figure 1A′–C′) full covariate adjustment. The geographical location of districts with atypical coverage is shown in figure 2.

Funnel plots of screening coverage and list of districts lying outside the 95% control limits prior to and after risk adjustment. Top left panel: funnel plots of screening coverage prior to any adjustment. (A) Cervical screening in women aged 25–49 years. (B) Cervical screening in women aged 50–64 years. (C) Breast screening in women aged 50–64 years. Top right panel: funnel plots of screening coverage after adjustment for population and general practice factors. (A′) Cervical screening in women aged 25–49 years. (B′) Cervical screening in women aged 50–64 years. (C′) Breast screening in women aged 50–64 years. Green line shows 95.0% control limits; Red dotted line shows 99.8% control limits. SHA, strategic health authority; Q30, North East; Q31, North West ;Q33, East Midlands; Q34, West Midlands; Q35, East of England; Q36, London; Q37, South East Coast; Q38, South Central; Q39, South West. Table: number of districts lying outside the 95% control limits prior to and after risk adjustment. The number of districts within London SHA (Q36) is shown in brackets.⇓

Geographical location of atypical districts. Map: map of Primary Care Trust 2006 boundaries with districts lying below the 95% lower control limits after risk adjustment coloured in red and districts lying above the 95% upper control limits after risk adjustment coloured in green. Table: districts lying outside the control limits are listed with corresponding percentiles given in brackets. Districts with coverage ranking among the 15 lowest (rank ≤15) or 15 highest (rank ≥137) are specified. All districts lying outside the control limits had relative coverage rankings ≤15 for lower 95% limit and ≥137 for upper 95% limit. SHA, strategic health authority; Q30, North East; Q31, North West; Q33, East Midlands; Q34, West Midlands; Q35, East of England; Q36, London; Q37, South East Coast; Q38, South Central; Q39, South West.⇓
Continued
Over two-thirds of the districts initially lying below limits for cervical screening—for most, located within London—no longer lay below limits after adjustment. For the breast screening group, only one out of the four initial outliers (Kensington & Chelsea in London—data not shown) was found to lie within limits after adjustment, while a new London district was uncovered as atypically low (Wandsworth, London). For two London districts, the adjusted coverage remained below the 99.8% lower limit for the cervical screening group aged 25–49 years, and ranked among the 15 lowest districts for the other two screening groups (Hammersmith and Fulham, and Camden, figure 2).
By contrast with what was observed for the districts lying below limits, the districts lying above the 95% upper limits after adjustment were mostly different from those identified prior to adjustment: only 1 in 2 districts for the cervical screening group aged 25–49 years, 1 in 5 for the cervical screening group aged 50–64 years, and 2 in 5 for the breast screening group would have been identified as atypically high performers without adjustment (figure 2 and data not shown). Two districts displayed atypically high coverage of all screening groups irrespective of age (Enfield, London and Nottinghamshire County Teaching, East Midlands).
Characteristics of districts with relatively high and low adjusted coverage
Districts were ranked according to their adjusted coverage values (see online supplementary file tables A3.1 and A3.2). Associations between population factors were investigated among the 15 lowest (figure 3B) and the 15 highest ranking districts (figure 3C).

Correlations between population factors, overall, and among the 15 highest and 15 lowest ranking districts after risk adjustment. Correlation coefficients are displayed in each cell: (A) all districts; (B) 15 lowest ranking districts and (C) 15 highest ranking districts. For the 15 lowest and 15 highest ranking districts, correlation coefficients which are significantly different from zero at the 1% level are highlighted in green for positive correlations, and in red for negative correlations. (D). Fisher's z test for significant differences in correlation coefficients between two independent groups. Bold represents p values < 0.05. Italic represents p values not significant at the 10% level. 1, % deprivation; 2, % urbanisation; 3, % Asian, black or mixed ethnic minority groups; 4, % ‘other’ ethnic minority groups; 5, % no higher education.⇓
For all screening groups, we noted strong positive associations between deprivation and non-white ethnicities among the highest ranking districts, which differed significantly from the associations seen among lowest ranking districts (Fisher's z test p<0.05 for cervical screening and p=0.05 for breast screening group among ethnic minorities groups only, figure 3D).
For cervical screening, a strong positive correlation between deprivation and absence of higher education was observed among the lowest ranking districts (ρ=0.77 and 0.68 for age group 25–49 and 50–64, respectively), which tended to not be as strong overall, or among highest ranking districts, in particular for the younger age group (Fisher's z test p=0.04).
Lowest ranking districts tended to have populations of ethnicity other than Asian, black or mixed with a higher level of education (ρ=−0.88, −0.77 and −0.70 for cervical age groups 25–49 and 50–64, and breast age group 50–64, respectively) compared with overall or highest ranking districts, in particular for cervical screening (Fisher's z test p=0.1 for both cervical age groups).
Discussion
The aim of this analysis was to identify and characterise districts that displayed atypically high or low cervical or breast screening coverage given population and general practice risk factors at district level. We found that a subset of districts with atypical coverage levels was common to both programmes, while other sets were more specific to the programme or age group.
Our risk adjustment results confirm the importance of demographic and socioeconomic characteristics for coverage levels, and highlight the comparatively minor impact of various aspects of primary care. This suggests that strategies targeted at raising awareness or addressing barriers among socially diverse and culturally diverse populations are likely to be the most effective at increasing coverage.
The number of practice staff FTE remained positively associated with cervical screening coverage, but not with breast screening coverage after adjusting for population factors. The finding that cervical screening coverage is more likely to be influenced by general practice factors is unsurprising since many women are screened at their local practice,25 and previous studies have shown the number of nurses per practice to be associated with cervical screening coverage in deprived areas.10
Coverage in London has generally been observed to be lower than the national average,1 ,2 in spite of some other public health features (eg, obesity rates) being better in London.26 We found that urbanisation, ethnicity and deprivation, largely accounted for the lower cervical screening uptake in London. For breast screening, however, being located in London, remained a strong independent negative risk factor, which warrants further investigation.
Deprivation was an independent negative risk factor for all screening groups, as also found for cervical screening by Bang et al.27 In the cervical screening group aged 25–49 years, this effect was, in part, explained by the numbers of women under 30 years old, as was the positive impact of lack of higher education on coverage. Cervical screening coverage has been reported to be lower in younger women;28 however, younger women of lower socioeconomic status or with fewer educational qualifications, regardless of ethnicity, have also been shown to be positively influenced by the 2009 Jade Goody's story with respect to cervical screening behaviour,29 giving hints for potential strategies for improving the uptake.
The impact of Asian, black or mixed ethnic minority groups on coverage differed between programmes after controlling for other population factors. For breast screening, it was no longer significant. For cervical screening, we found it negatively influenced coverage in the age group 25–49, but was associated with greater coverage in the age group 50–64. Previously, only an overall negative association after adjustment for other population factors had been reported for cervical screening in women aged 25–64 years.27
For both programmes, and regardless of age, ‘other’ ethnic minority groups were still associated with poorer coverage after accounting for deprivation and urbanisation, with a particularly strong effect in breast screening. In addition, our results suggest that women of ‘other’ ethnic minority background, who may be well educated and living in areas with smaller Asian, black or mixed ethnic minority populations, are less likely to go for screening. Arab communities account for a moderately large subset of the ‘other’ ethnic minority groups (40%), and uptake of cervical and breast screening has been shown to be low in these populations for a number of reasons, including religious beliefs, emotional barriers (embarrassment/fear), language barriers or taboos surrounding sexual activity (for cervical screening).30–32 These communities may, therefore, require newly targeted interventions to promote screening.
Our correlation analyses suggest that districts with atypical coverage levels differ from one another not only in respect of a number of population-level and general practice-level characteristics, but also in how these characteristics relate to each other. Correlates of deprivation in districts with relatively low adjusted coverage were substantially different from the general results, and even more so for cervical screening. In particular, the nature of the relationship between deprivation and non-white ethnicity differed, with an inverse relationship between deprivation and non-white ethnic groups among lowest ranking districts.
Using funnel plots based on crude performance data to assess quality of care at area level may overestimate the number of ‘underperforming’ districts, and overdispersion needs to be addressed a priori. We chose a risk adjustment approach to uncover districts with atypical coverage given particular population and general practice characteristics. Districts with adjusted coverage values lying outside control limits display a behaviour which cannot solely be explained by the area-level risk factors investigated (ie, they present with special cause-variation).
Districts with atypically high coverage were singled out and could be investigated to identify any local health interventions and policies that might help improve coverage in districts with similar characteristics but lower performance. Unfortunately, there is a general lack of reporting in the research literature across districts on the impact of local interventions that have been implemented to improve screening uptake (ED, unpublished PhD thesis), so identifying ‘what works’ is challenging.
Simultaneously, districts with atypically low coverage were distinguished from those lying within bounds after accounting for urbanisation, deprivation and ethnicity, in particular, for the London region. These districts may benefit from further investigation to uncover the features driving their atypically low coverage and help design population-specific strategies. Additional risk factors that may explain low coverage, as well as differences in district performance between programmes, include the percentage of women who are disabled,33 incarcerated,34 have greater difficulty in accessing services as indexed by time-to-screening centre,13 and differential utilisation behaviour as a result of sociocultural factors, such as marital status,35 occupation,36 sexual orientation,37 and overseas birthplace or religious beliefs,11 ,38 that might apply to particular programmes.
Our results are limited by the aggregated nature of the data, which may conceal ecological associations within districts. This could account for the weak association seen between coverage and general practice characteristics after adjustment for population factors. However, similar trends were observed when analysing general practice-level data for cervical screening coverage.27
The district boundaries used in this study (151 PCTs) are no longer in place; however, the findings may be applied to the newly defined boundaries (210 Clinical Commissioning Groups) by 1:1 mapping for the most part.39
The strength of the approach of combining risk adjustment modelling with funnel plots was to allow us to identify districts with an unusual level of screening coverage after accounting for some of the important demographic and socioeconomic characteristics of their populations and their primary care settings known to affect coverage level. Such an approach could be implemented sequentially to monitor the impact of local interventions in a centralised fashion. This method could also be adapted for use with other health indicators.
Our results demonstrate that population factors largely explain the lower coverage in London. In addition, districts in London and other urban centres with specific population characteristics, such as non-deprived ethnic minority groups, were identified as requiring targeted intervention to improve coverage levels. Bilingual outreach and community-based advocacy, such as support from family and community leaders including GPs, has been found to be valuable in increasing uptake of cancer screening in ethnic minorities.40
We hope these results will inform the continued drive to reduce inequalities in cancer screening and avoidable deaths, and encourage implementation of targeted interventions in communities residing within districts identified as having atypically low coverage.
Acknowledgments
The authors would like to thank the Knowledge and Intelligence Team (KIT)—East for supplying the PCT digital boundary information and creating contrast maps according to our results, in particular, Aphrodite Niggebrugge, and acknowledge all who contributed to the collection and maintenance of HSCIC, ONS and APHO data.
References
Supplementary materials
Supplementary Data
This web only file has been produced by the BMJ Publishing Group from an electronic file supplied by the author(s) and has not been edited for content.
- Data supplement 1 - Online supplement
Footnotes
Contributors NJM performed the statistical analysis, interpreted the results and wrote the manuscript. ED carried out the data informatics and data checks, and co-wrote the manuscript. JoW and JaW provided general expert guidance. SWD provided general statistical guidance. All authors reviewed and approved the final manuscript.
Funding This work was supported by a grant from the UK Department of Health (no. 106/0001).This work was part of the programme of the Policy Research Unit in Cancer Awareness, Screening and Early Diagnosis. The Policy Research Unit in Cancer Awareness, Screening, and Early Diagnosis receives funding for a research programme from the Department of Health Policy Research Programme. It is a collaboration between researchers from seven institutions (Queen Mary University of London, University College London, King's College London, London School of Hygiene and Tropical Medicine, Hull York Medical School, Durham University and Peninsula Medical School).
Competing interests None declared.
Provenance and peer review Not commissioned; externally peer reviewed.
Data sharing statement Data are freely available from the HSCIC: Cervical screening: http://www.hscic.gov.uk/catalogue/PUB10339/bres-scre-prog-eng-2011–12-tab.xls. Breast screening: http://www.hscic.gov.uk/catalogue/PUB07990/cerv-scre-prog-eng-2011–12-tab.xls