Article Text

Abstract
Objective To estimate the cost-effectiveness of adalimumab plus methotrexate (MTX) versus MTX monotherapy in early, aggressive rheumatoid arthritis (RA) when explicitly modelling short-term (reversible) and long-term (irreversible, ie, joint damage) disease activity and physical function.
Methods A microsimulation model was developed to unify, in a single cost-effectiveness model, measures of reversible and irreversible disease activity and physical function based on data from the PREMIER trial. Short term, reversible disease activity was modelled using DAS28 variables, including swollen joint counts, tender joint counts, C reactive protein concentration and pain. The DAS28 variables were then used in a logistic regression to predict short-term American College of Rheumatology (ACR) responses, which informed treatment continuation and switches. Long term, irreversible, radiographically documented joint damage was modelled using modified Total Sharp Score (mTSS). The model then linked both short-term disease activity and mTSS to the Health Assessment Questionnaire score, which was used to calculate direct and indirect costs, and quality adjusted life-years (QALYs).
Results When both reversible and irreversible effects of therapy were included, combination therapy was estimated to produce 6-month 50% ACR responses in 75% of patients versus 54% in MTX monotherapy. Compared to MTX monotherapy, combination therapy resulted in 2.68 and 3.04 discounted life years and QALYs gained, respectively. Combination therapy also resulted in a net increase in direct costs of £106 207 for a resulting incremental cost/QALY gain of £32 425. When indirect costs were included in the analysis, the ICER (incremental cost-effectiveness ratio) decreased to £27 238. Disregarding irreversible effects increased the incremental cost-effectiveness ratio to £78 809 (when only direct costs were included).
Conclusions Starting with adalimumab plus MTX combination therapy in early, aggressive RA is cost-effective when irreversible damage is adequately considered.
- Rheumatoid arthritis
- cost-effectiveness
- disease-modifying antirheumatic drugs
- biological therapy
- methotrexate
This is an Open Access article distributed in accordance with the Creative Commons Attribution Non Commercial (CC BY-NC 4.0) license, which permits others to distribute, remix, adapt, build upon this work non-commercially, and license their derivative works on different terms, provided the original work is properly cited and the use is non-commercial. See: http://creativecommons.org/licenses/by-nc/4.0/
Statistics from Altmetric.com
- Rheumatoid arthritis
- cost-effectiveness
- disease-modifying antirheumatic drugs
- biological therapy
- methotrexate
Strengths and limitations of this study
Many published models consider only short-term outcomes and thus do not fully capture the benefits of successful treatment in terms of preventing or slowing radiographic progression of rheumatoid arthritis (RA). The present approach better reflects the potential impact of therapy on patients through explicit and separate modeling of the short- and long-term effects of adalimumab combined with methotrexate (MTX) versus MTX monotherapy in patients with early RA.
Clinical pathways applied in RA management in the UK were included in the present model. Specifically, after initial therapy with disease-modifying antirheumatic drugs, UK patients are usually offered biologics. Their disease is monitored, and non-responders are switched to the next therapy in their treatment sequence.
The results of the present analysis only reflect the population (ie, early, aggressive RA) and comparators (ie, first-line therapy with adalimumab+MTX or MTX monotherapy) included in the PREMIER trial, on which this analysis is based, and therefore cannot be readily extrapolated to other populations and other therapies.
The effectiveness of therapies given after first line represent patients with more established RA. It is possible that treatment efficacy would be higher in the modelled cohort because patients with early RA would be expected to have a greater probability of treatment response.
Although the model considered UK clinical pathways, some specific aspects were not accounted for, including (1) the assumption that response would be assessed earlier in the care pathway due to the early, aggressive nature of the type of RA studied and (2) the use of ACR criteria to measure response instead of DAS28, which is more often used in the UK.
Introduction
Rheumatoid arthritis (RA) is a progressive, inflammatory disease that affects synovial tissue, resulting in joint swelling, stiffness, pain and tenderness.1 The short-term course of RA is characterised by alternating periods of flares—in which reversible, clinical signs of inflammation and pronounced symptoms are present—and periods of symptom-free remission.2 ,3 Inflammation of the affected joint(s) throughout the course of the disease may lead to erosion of articular cartilage and marginal bone, resulting in irreversible joint destruction.3 Radiographic studies have shown that joint damage typically occurs as early as 6 months after onset of RA and may progress rapidly during the first 2 years.4 ,5 Consequently, the optimal therapeutic window to prevent or inhibit this damage, and the associated health impairments and costs may be early in the disease course.
In contrast to symptomatic anti-inflammatory and analgesic treatment options for RA, methotrexate (MTX) and other non-biological disease-modifying antirheumatic drugs (DMARDs) are efficacious in reducing the reversible symptoms of RA and preventing or slowing its irreversible course, and are currently recommended as first-line therapy.6–9 Several biological DMARDs, such as tumour-necrosis factor (TNF) antagonists adalimumab, etanercept, infliximab and golimumab have demonstrated effective disease modification and symptom control with acceptable benefit-risk profiles in patients with early moderate-to-severe RA.10–13
Clinical trials have demonstrated better clinical response rates and radiographic outcomes with MTX in combination with anti-TNF agents compared with either monotherapy.14–22 A disadvantage of anti-TNF agents compared with non-biological DMARDs is that these are relatively expensive and, as such, tend to be relegated for use after DMARD failure. However, in some RA populations—such as those with an early and/or aggressive form of RA—the benefits of earlier treatment with anti-TNF agents may outweigh their costs. From a cost-effectiveness perspective, differing conclusions regarding the health economic value of initial anti-TNF therapy have been reported, with some studies reporting favourable cost-effectiveness results,23–25 although others have been less favourable.26–29 However, firm conclusions about the cost-effectiveness of RA treatments may be difficult to draw because of important differences across studies, including selection of analytical perspectives and assumptions concerning long-term efficacy, safety of treatment, stopping rules and source of efficacy data. For instance, in previous cost-effectiveness analyses of anti-TNF agents for early RA, the stopping rules (ie, whether response and continuation of therapy are based on explicit criteria) have varied widely, from American College of Rheumatology (ACR) response criteria to Disease Activity Scores to literature-based evidence; and no two papers used the same source of evidence to estimate the efficacy of comparator treatments.23–25 ,27–29 In particular, in previous economic analyses, the long-term impact of RA (in terms of radiographically documented joint damage), if included at all, was generally modelled implicitly via measured changes in the functional outcomes (ie, Health Assessment Questionnaire (HAQ)—a generic functional questionnaire assessing patient's ability to carry out everyday activities that may be affected by both reversible and irreversible components of RA)23 ,24 or indirectly via the impact of radiological damage on HAQ.25 ,26 Modelling joint damage captures the cumulative effects of treatment over time, yet the irreversible radiographic damage itself has never been explicitly and directly modelled. This represents an important potential gap because the impact of long-term irreversible disease progression on health-related quality of life (HRQL) and costs is an arguably critical driver of cost-effectiveness and to a large degree, one of the main reasons, if not the main reason, for why early, aggressive RA should be treated as effectively as possible.
The model presented herein was, therefore, designed to fill this important gap and explore how—when explicitly and separately modelled—the short term, symptomatic effects and long term, radiographic progression of RA affect costs and quality of life in measurable and different ways. This conceptual framework was applied to assess the cost-effectiveness of adalimumab plus MTX combination therapy in early, aggressive RA. By unifying these attributes into a single modelling framework, the hope is that ultimately such a model may be used to make predictions about the outcomes of clinical trials for these therapies.
Methods
Model overview
The incremental cost-effectiveness ratio (ICER) of adalimumab+MTX versus MTX monotherapy was assessed by modelling, via microsimulation, the associated direct (and, in a scenario, indirect costs) and quality-adjusted life-years (QALYs) over 30 years from a UK (UK) National Health Service (NHS) perspective.
The PREMIER study is the principal evidence source used to derive model parameter values. Detailed results of this pivotal randomised clinical trial conducted over 2 years in MTX-naïve patients with early aggressive RA, comparing adalimumab as monotherapy (n=274) or combined with MTX (n=268) versus MTX monotherapy (n=257), have been described elsewhere.15 Additionally, economic data were derived from the health economic companion study to PREMIER, Study DE032.30 The characteristics of patients in the companion study (N=664) were similar to those included in the full PREMIER trial (N=799) in terms of age, gender, disease duration, prior DMARD use, disease activity, HAQ score and discontinuation.15 ,30 Response rates were slightly higher in DE032 (72% in adalimumab+MTX vs 50% in MTX in DE032 vs 62% in adalimumab+MTX vs 46% in MTX in the full PREMIER data). Since the relationships between modelled variables (eg, the effect of disease activity and Total Sharp Score on HAQ, and the estimation of resource use as a function of HAQ) are independent of treatment effect, data from all Study DE032 patients were used in the quantification of these relationships.
Model structure, relationships and key inputs
The microsimulation model generates individual patient histories. These histories tell the story of each individual patient's disease pathway in terms of his/her therapy and its consequences on disease activity and joint damage, and the subsequent consequence of these on survival, costs and quality of life. While side effects and mortality may occur any moment, treatment decisions are made in 26-week cycles, for 1000 patients initiated on adalimumab plus MTX therapy or MTX monotherapy (figure 1).

Model schematic. ACR, American College of Rheumatology; DAS, Disease Activity Score; HAQ, Health Assessment Questionnaire.
The histories are generated using analyses which have been carried out on the information available in the PREMIER clinical trial.15
Each patient history starts when they enter the model (figure 1) with a given score on the “28-joint Disease Activity Score” (DAS28): which reflects the number of tender joints (0–28), number of swollen joints (0–28), a pain score (0–100 mm visual analogue scale), and a value for the C reactive protein (CRP) concentration. This is a short-term reflection of disease activity. Additionally, each patient is given a score on the modified Total Sharp Score (mTSS), which assesses radiological damage among 44 joints and which reflects long-term irreversible damage.
For each patient, the starting scores on the four DAS-28 domains are computer generated by drawing at random from a multivariate normal distribution which was estimated using the sample means and covariance of the logit of the four domains. The effect of therapy was modelled by shifts in the distribution means, reflecting improvements. These shifts are again generated using a multivariate normal distribution as estimated by the sample means and covariance as observed in PREMIER. Naturally, while the shifts in the means capture the improvements in the scores, the covariance matrix captures the positive correlation between the four domains. As a consequence of the fact that this correlation is not perfect, one will find that patients improve on one, but not necessarily on another, domain of the DAS score.
The initial score for the mTSS is generated by drawing from the sample distribution at the start of the model. This variable assesses radiological damage among 44 joints and captures joint destruction or deformity which may result from irreversible joint erosion and joint space narrowing, the long-term effects of RA. The effect of treatment on mTSS was modelled as a linear function of treatment (tx) and time (months). The effect for subsequent treatment strategies are assumed to be the same as those applied for MTX (please refer to supplementary material for additional information).
The DAS28 variables are then used in an ordered logistic regression to predict ACR responses at 26 weeks. After 26 weeks, patients who failed to meet the 50% improvement criteria of the ACR50 switched to the next treatment in the sequence of three other treatment strategies, which was identical for both treatment arms: first MTX+hydrochloroquine, then leflunomide monotherapy and then gold monotherapy. This sequence of treatments was chosen because it includes therapies that target RA in different ways. Each treatment is thus considered a suitable alternative for patients who failed on the previous treatment in the sequence. The order of the treatments in the sequence was chosen such that the cost of treatments increases with each failed option. Further, the sequence of treatments that we apply has been used previously in economic modelling of biologics in RA.24
Patients reaching ACR50 on a given therapy remained on that therapy until discontinuation due to adverse events (AEs). If an ACR50 response was not reached in a given cycle, patients discontinued their current treatment and switched to the next therapy in the sequence. Patients failing to reach ACR50 on any of the four treatment strategies were assumed to switch back to, and remain on, the therapy that provided best response (which was estimated in the same way as when prescribed the first time) until discontinuation due to AEs. AE-related discontinuations were estimated to have occurred in 2% of patients annually regardless of therapy on the basis of the PREMIER randomised clinical trial.15 Assumptions about the efficacy of secondary DMARDs after insufficient response to either primary treatment were obtained from a Swedish study of patients with established RA.31 Details of model estimates are provided in the online supplementary appendix.
Disease activity and mTSS were linked to an individual's HAQ using an equation that was based on an analysis of PREMIER and adjusted for the observation that the relationship between mTSS and HAQ was more pronounced in patients when in remission (please refer to supplementary material for additional information) (3).
The probability of death at any point in time was related to the patient's age and HAQ score using the relationship reported by Sokka et al,32 for the data from PREMIER were not suitable to estimate survival rates.
Economic data (from the PREMIER health economic subset), which included employment status (employed, unemployed, self-employed, homemaker, student, retired, other), work-related information (average working time, work days missed and self-reported visual analogue scale measuring the degree to which RA affected normal work or homemaking performance), and healthcare resource use (number of hospital visits and duration of hospital stays and number of visits to a general practitioner (GP)), were mathematically linked to a patient's HAQ score at any point in time. Again, these links are described elsewhere.33
Further details on the relationships described above can be found in the online supplementary appendix.
Quality of life inputs
Utilities, derived from the Health Utilities Index Mark 3 (HUI3), were estimated based on data from PREMIER. A logistic curve was applied, with utility as the dependent variable and HAQ score as the explanatory variable (see online supplementary appendix).
Cost inputs
Treatment costs were based on estimates from the September 2013 British National Formulary.34 The cost of adalimumab therapy was based on 40 mg treatment every other week by self-injection, whereas the cost of MTX assumed a treatment strategy of 7.5 mg weekly, administered orally. The annual costs of MTX and adalimumab therapies were estimated to be £22.92 and £11 269.18, respectively, taking into account the PREMIER-based proportion of patients who received dose escalations. The annual costs of other DMARD therapies were estimated to be £31.33, £248.14 and £700.96 for hydrochloroquine, leflunomide and gold, respectively. Unit costs for hospital and GP visits were taken from the Personal Social Services Research Unit Costs of Health and Social Care, and are inflated to 2012 prices using the Hospital and Community Health Services Index.30 ,35 ,36 A hospital visit cost £290.00 per hospital bed day, and a GP visit cost £29.83. The cost of a day missed from work was estimated to be £89.60,37 considering the UK average weekly wage.
Analyses
The primary outcome was the discounted ICER, which was assessed in the base case analysis and various scenario and probabilistic sensitivity analyses. Unless otherwise specified, the costs and QALY outcomes were discounted at 3.5%, as per current National Institute for Health and Care Excellence (NICE) research guidelines.38
The following alternative scenarios were considered: (1) the effects of the mTSS on HAQ (ie, the irreversible effects of untreated RA) were ignored; (2) mortality effects were ignored; (3) treatment response was defined as 70% (ie, ACR70); (4) the impact of an additional HAQ point on utility was assumed to be halved to test the impact of choosing an HRQL measure other than the HUI3 to model utility; (5) the model analytical horizon was shortened to 2, 5 and 10 years (alternating between including and ignoring the irreversible damage); and (6) discontinuation rates of 0% and 4% were tested.
A probabilistic sensitivity analysis (PSA) combined bootstrapping with random draws from uncertainty distributions. By bootstrapping the data from the randomised clinical trial using normal and Poisson distributions, we obtained uncertainty margins surrounding the annual increase in mTSS; the distribution of initial response; the relationship between clinical response variables and HAQ; and the relationship between HAQ and utility, loss of work, days in hospital, doctor visits and mortality.
All remaining estimates were from sources other than PREMIER. For these estimates, uncertainty distributions were defined as follows and were used to draw from each bootstrap. The base case annual incidence of AEs was multiplied with a factor that followed a Programme Evaluation and Review Technique (PERT) distribution, a version of the β distribution, with mean=1, minimum=0.5, and maximum=1.5. A similar approach was chosen for the parameter modelling the dependency between HAQ and mTSS and those for the efficacy and AEs of later therapies. Less uncertainty was assumed concerning the unit costs of days missed from work and costs of hospital stays and GP visits (PERT distributions for multiplication with mean=1, minimum=0.8 and maximum=1.2). The PSA generated 250 simulations each with 1000 patients per treatment arm. Results are presented via a cost-effectiveness acceptability curve.
This research was conducted by Pharmerit International with the financial support of AbbVie Inc. AbbVie Inc. participated in the design and conduct of the study and in the interpretation of the data.
Results
Primary model
The clinical outcomes at 2 years mimic the data observed in PREMIER despite the fact that, in contrast to the trial, the model assumed that patients would begin to switch medications after 6 months and could try up to three other agents before reverting to the treatment on which they experienced the best response. Unless otherwise specified, all results exclude indirect costs.
Figure 2 presents the distribution over time of the 1000 patients on the various treatment sequences for each arm of the model. As depicted on figure 2, there is a precipitous drop of patients on initial MTX monotherapy after 26 weeks because 46% of these patients did not achieve ACR50. This drop is less pronounced for combination therapy because 75% of patients achieved ACR50. These estimates are slightly higher than the response rates seen in the patient-level data. This may be explained by the use of data from all Study DE032 patients to inform the estimates of intervariable relationships. Thereafter, patients switched from their initial therapy only because of AEs. Response rates for the next treatment lines were estimated to be much lower, and a sizeable percentage of patients ended up in the last option of best previous treatment (17% MTX patients, 5% combination patients). The average mTSS increases almost linearly from a base line value of 18 to an average value of 106 with combination therapy and an average value of 157 with MTX.

Distribution of patients on each treatment sequence over time by initial therapy. The bottom stratum represents the number of patients on initial therapy (MTX monotherapy or adalimumab+MTX, labelled ⓪), and the stratum above it represents the number of patients on the first of three treatment sequences (MTX+hydrochloroquine, labelled ①), and so on (leflunomide, labelled ②; gold, labelled ③). Patients who have failed the initial therapy and all 3 subsequent lines switched to the therapy with the best response. Patients in this group are presented in the fourth stratum (labelled ④). The top portion represents those who have died (labelled ⑤).
The differences in clinical response presented in figure 2 result in differences in HAQ scores and associated modelled consequences in terms of resource utilisation (GP visits, hospital days), survival and utilities, which are illustrated in figure 3. Patients started with a relatively high average HAQ score of approximately 1.5, which decreased to an average of approximately 0.7 for patients who started on combination therapy (black line, top left panel, figure 3) and to approximately 0.9 for patients who started on MTX monotherapy (grey line, top left panel, figure 3). These curves reflect a weighted average of responders and non-responders. MTX monotherapy was also associated with lesser HRQL (average difference of 0.21 on the utility scale between the two treatment arms) and greater resource use in terms of both GP visits and hospitalisations. Table 1 presents an overview of the estimated differences in clinical and costs outcomes after 30 years.
Clinical outcomes and costs over 30 years: alternative scenarios
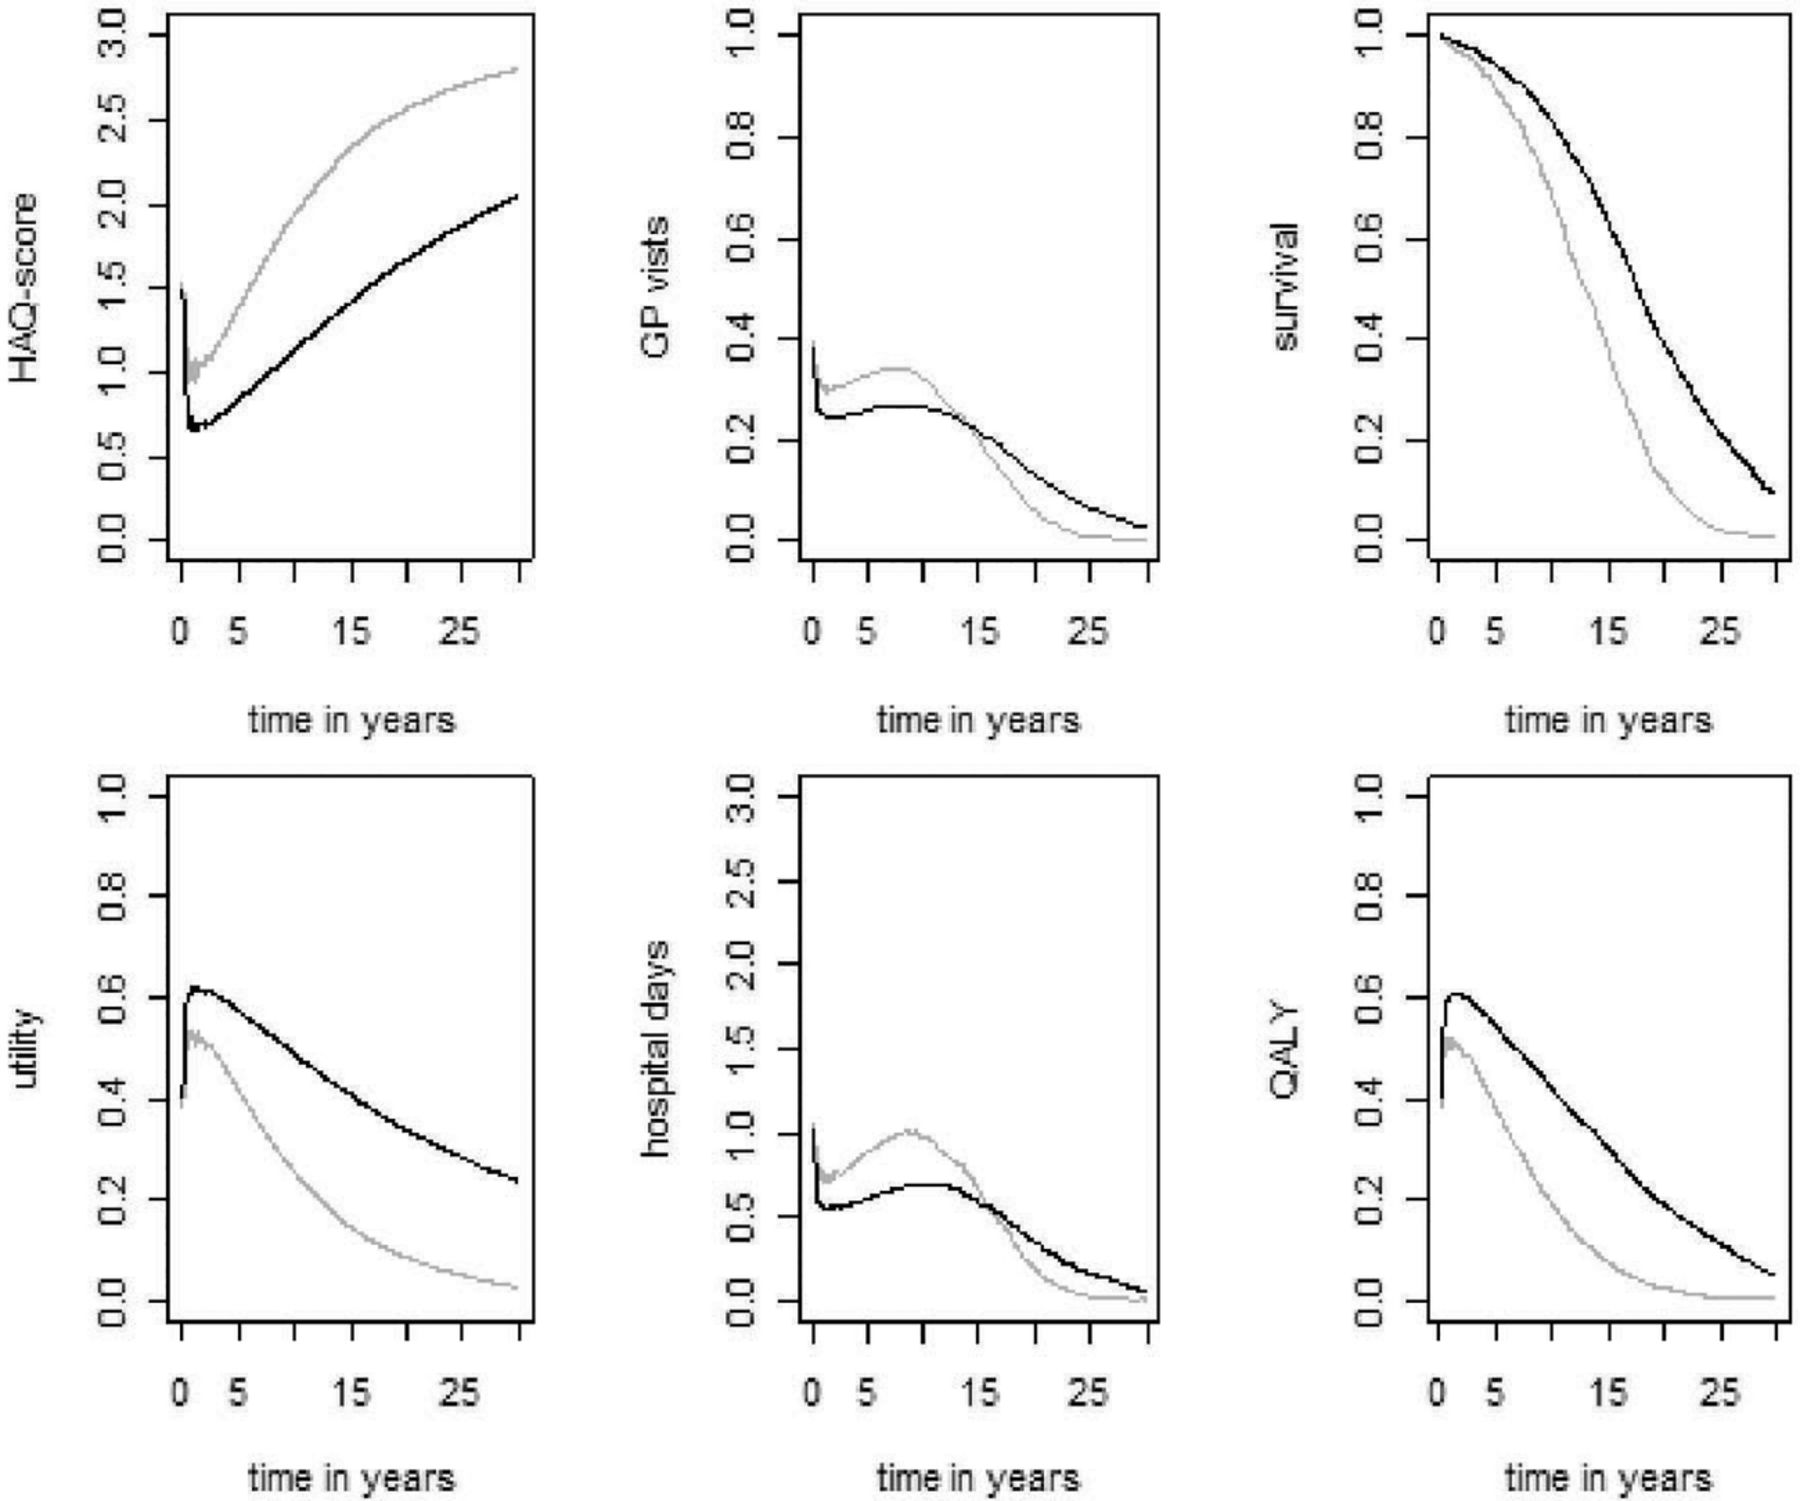
Consequence of treatments. Grey lines represent patients who started on methotrexate (MTX) monotherapy. Black lines represent patients who started on combination therapy (adalimumab+MTX). HAQ, Health Assessment Questionnaire; GP, general practitioner; QALY, quality-adjusted life-years.
Discounted life expectancy was estimated to be 12.62 versus 9.94 for combination therapy versus MTX monotherapy, respectively, an incremental gain of 2.68 life years in the combination treatment arm. Discounted QALYs were 6.83 versus 3.79, respectively, a gain of 3.04 QALYs in the combination treatment arm. Patients who started on combination therapy were estimated to remain on their initial therapy for an average of 13.32 years compared with 6.62 years for patients who started on MTX monotherapy. The associated discounted cost of medication were estimated to be £108 805 and £2 589, respectively, corresponding to a net cost of £106 217 favouring MTX. However, the more effective combination therapy was also associated with savings in terms of hospitalisations and GP visits, such that the total net cost for combination therapy was estimated to be £98 558. Accordingly, the ICER excluding indirect costs was estimated to be £32 425. When indirect costs were included in the analysis, the ICER decreased to £27 238.
Alternative scenarios
Table 1 also shows the balance between costs and effects when four key alternate scenarios are modelled. Specifically, excluding the effects of irreversible damage on HAQ led to more modest increases in patient lifespan and incremental QALYs, which had a dramatic effect on the cost-effectiveness ratio; it increased to >£70 000. When survival benefits were ignored, the ICER improved to approximately £23 000. This improvement was driven primarily by increased costs associated with more patients surviving in the MTX arm, which resulted in decreased incremental costs. When therapy was stopped and replaced with the next treatment in the sequence in patients who did not achieve an ACR70 response, fewer patients received biologics in the combination therapy arm and less time was spent on this therapy. However, this change did not have a marked effect on the ICER: the costs decreased but the savings and the benefits also decreased, with the ICER changing from £32 425 to £30 198/QALY. Assuming an attenuated relationship between HAQ and utility (as may be expected if a utility measure other than the HUI3 is used to model patient-related quality of life) increased the ICER to £38 611/QALY owing to fewer incremental QALYs observed.
Using analytic horizons of 2, 5 and 10 years resulted in ICERs of £95 947, £56 014 and £37 948, respectively.
When shorter time horizons were assumed, the full benefit of treatment in terms of preventing or slowing the progression of RA was not realised. This is demonstrated by the modest differences in QALYs seen between the treatments in the shorter term. Further, when the effects of mTSS on HAQ were also excluded, the ICERs for the 2, 5 and 10 years horizon analyses increased to £190 481, £126 756, and £90 249, respectively. The relative contribution to the ICER of the irreversible damage component is thus 49.6%, 55.8% and 58% at 2, 5 and 10 years, respectively. When the discontinuation rate was set to 0% and 4%, the ICERs were £32 494 and £32 315, respectively.
Probabilistic sensitivity analyses
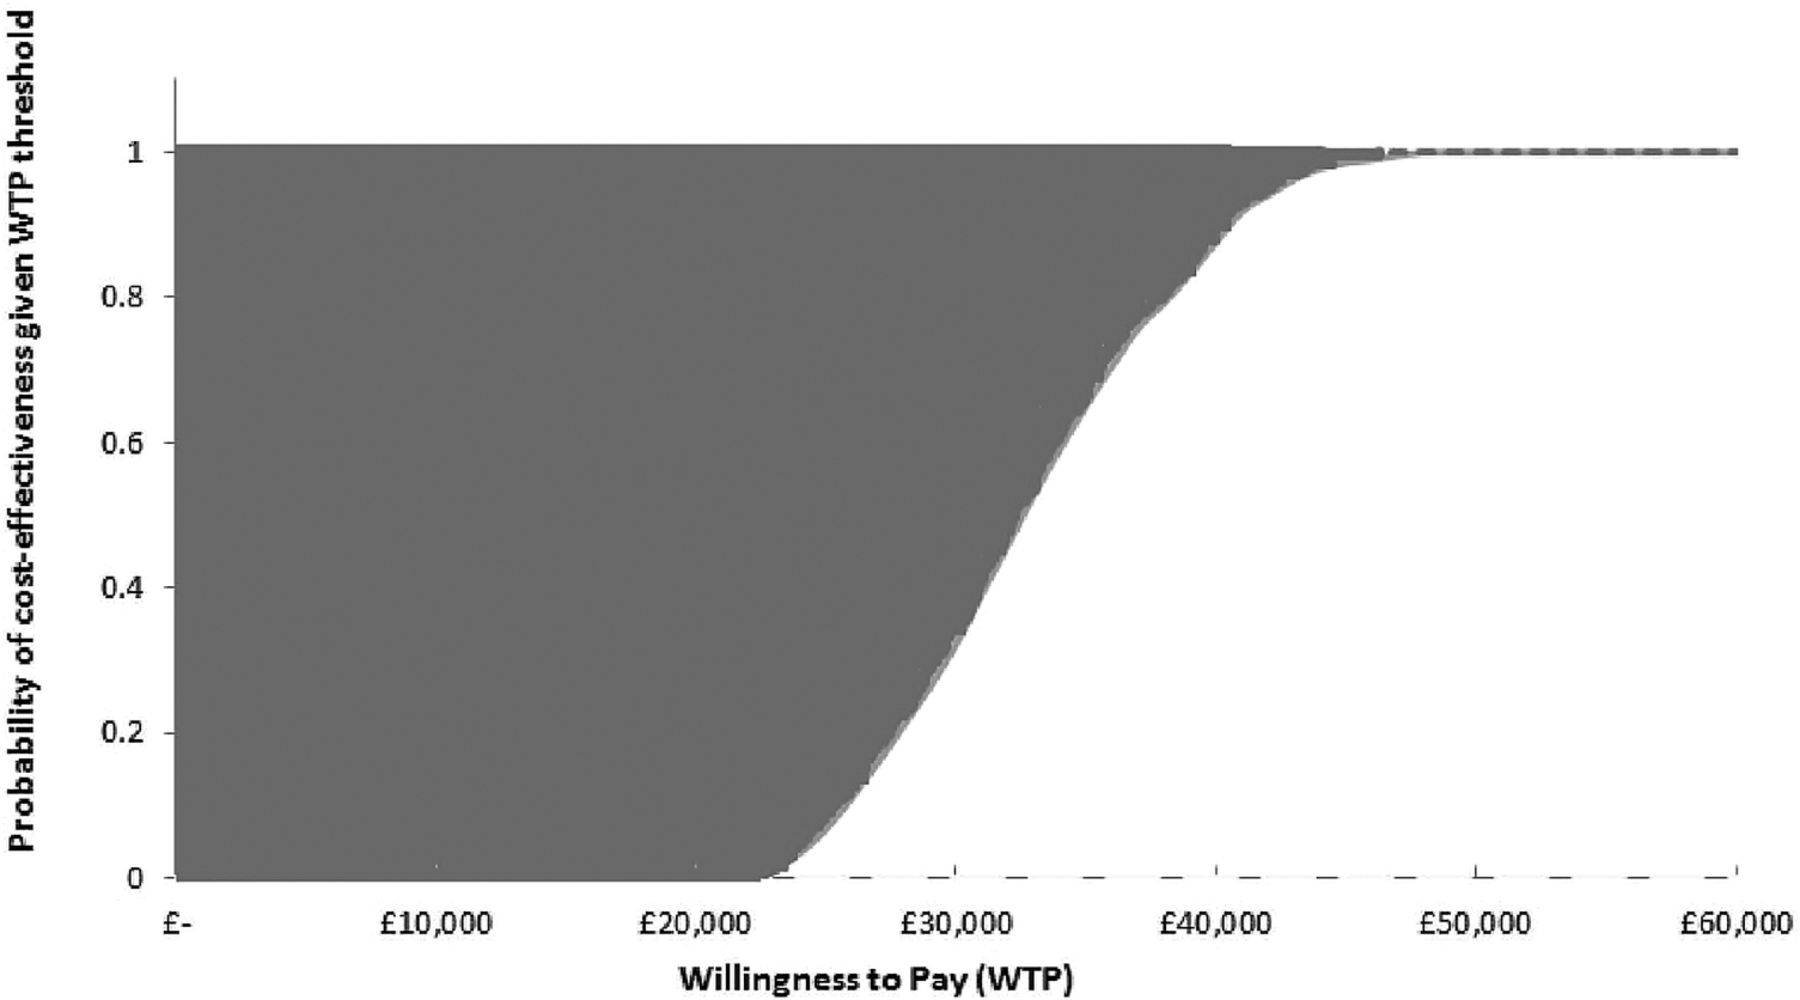
Figure 4 presents the cost-effectiveness acceptability curve. The probability that combination therapy is cost-effective was estimated to be 100% at willingness-to-pay thresholds of £45 000 and above when the base case model assumptions were applied (figure 4). The estimates, conditional on the model used in the base case here, were extremely robust.

Cost-effectiveness acceptability curve. The space between 100% and the upper dark grey dotted line defines the probability that the treatment was more expensive and less effective (0% in this case). The space between 0% and the lower light grey dashed line defines the probability that the treatment was less expensive and more effective (0% in this case). QALY, quality-adjusted life-years. WTP, willingness to pay.
Discussion
Decision-making for chronic disease therapies should consider both short-term and long-term effects. Accordingly, models for RA treatments that look only at short-term outcomes (ie, 2–10 years)25 ,27 ,28 do not fully capture the benefits that successful treatment may bring in terms of preventing or slowing the radiographic progression of RA, which may lead to improved physical function, reduced direct medical costs and increased productivity and HRQL. Likewise, measures of short-term reversible disease activity and therapeutic response are only part of the story because the potential to prevent or slow irreversible damage may be far more important. Thus, models of biologics that have focused on short-term disease activity, measured as DAS2828 or with HAQ23 ,24 as the single explicitly modelled variable, offer a limited perspective.
The present model was designed specifically to provide a unifying view in which parameter inputs for both short-term and long-term outcomes were modelled explicitly and separately in patients with a specific early, aggressive form of RA. The different components of the reversible short-term disease activity were captured using a multivariate normal model with shifted means of the DAS28 variables to accurately reproduce the results of the PREMIER trial. The irreversible joint damage of RA was modelled using the mTSS—which assesses radiographic damage in 44 different joints—independently from the short-term disease activity and HAQ, to reflect the results of adalimumab+MTX and MTX monotherapy as observed in PREMIER. Ultimately, this unifying modelling approach is designed to allow simulation and prediction of clinical trial results.
The analyses presented herein indicate that relative to MTX monotherapy, combination with adalimumab+MTX offers an acceptable ICER and a reasonable treatment choice for patients with early, aggressive RA. The treatment choice for combination adalimumab+MTX therapy relative to MTX monotherapy resulted in gains of 3.04 discounted QALYs and net discounted direct costs of £98 558 over 30 years. Hence, the ICER was estimated to be £32 425. These results were shown to be consistent in univariate deterministic and multivariate probabilistic sensitivity analyses. Importantly, separate scenario analyses demonstrated that when the analytical horizon was reduced to 2 years, the ICER increased to £95 947. When the irreversible effects of RA were ignored, the ICER increased to over £70 000/QALY gained. When considering alternative time horizons and at the same time omitting the impact of irreversible effects, we found that the irreversible effects of RA have the greatest impact on cost-effectiveness in the longer-term (49.6% in the 2-year analysis vs 58.9% over 30 years) and that the reversible effects are larger drivers of the short-term outcomes.
Finally, when indirect costs were included (ie, a UK societal perspective was taken), the ICER decreased to £27 238/QALY gained.
Similar to this study, Davies et al24 concluded that early anti-TNF therapy in combination with MTX was cost-effective relative to MTX alone. Like the current model, this study adopted a patient simulation approach that allowed patients to switch treatments if they did not respond. As patients progressed through the sequences of treatment, the modelled HAQ score deteriorated over time, with periods of response resulting in slower disease progression. HAQ scores were then linked to costs and utilities via regression equations. Cost-effectiveness was further improved by including productivity costs and mimicking the impact of irreversible radiographic progression. Kobelt25 showed early treatment with etanercept plus MTX to be cost-effective versus MTX monotherapy.
Here, irreversible joint damage was assumed to affect HAQ. However, both approaches were not so explicit as in the current model.
Based on the current analysis and evidence from previously published models, it is apparent that the assumptions made concerning longer term effects meaningfully affect the conclusions of an economic modelling study in RA. The choice of the perspective, stopping rules, and the target patient population will affect cost-effectiveness results. Schipper et al28 did not demonstrate positive cost-effectiveness results with biological therapy in patients with early RA. This model, however, did not include radiographic damage and adopted a short-term (5-year) perspective. The stopping rule applied in the model was based on DAS28 variables (patients not in remission at 3 months, ie, DAS-28 >2.6, switched to the next treatment in the sequence). Progression was also based solely on changes in DAS28, rather than incorporation of a combination of DAS28 and HAQ scores, which occurs in the majority of published models, including the present one. Finckh et al26 in a very early patient with RA population (symptoms onset <3 months) concluded that the cost-effectiveness with biologics remains uncertain. This conclusion mainly stemmed from concerns surrounding the data applied in the economic model. The two most notable concerns were (1) that many of the statistical relationships were estimated based on a cohort of patients with established RA, and (2) that extrapolating efficacy data from such a patient population could underestimate the benefit of more aggressive early treatment.
Several limitations should be considered when generalising conclusions from our model. Specifically, it was based on patients in PREMIER, who were classified as having early, aggressive RA. Hence, the results of the present analysis cannot be extrapolated to other patient populations. Second, the comparator arm included in this model for first-line therapy (ie, MTX monotherapy) reflects the comparator arm of the PREMIER trial. In practice, a combination of DMARD therapy is usually given to patients with RA. However, because of the lack of data, it was not possible to include a comparison with a combined DMARD therapy arm. As a result, the efficacy and costs and AE rates of the comparator arm may be underestimated in this model. Third, the effectiveness of therapies given after first line were taken from sources reporting on patients with more established RA. It is possible that the efficacy of these treatments would be higher in the modelled cohort because patients with early RA would be expected to have a greater probability of treatment response.39 This factor is not expected to affect the cost-effectiveness results presented herein substantially because, from second-line onwards, the same sequence of treatment strategies was administered in both treatment arms. Additionally, cost savings due to work loss are not easily generalisable because these are often heterogeneous across patients, and many analyses exclude these costs for this reason. In addition, the model here may underestimate the indirect cost savings when considering a young working individual and may overestimate these savings when considering an older, non-working individual. Finally, patients with chronic RA have been shown to have better utility than is seen in the current model after 15–20 years (figure 3). This difference is explained by the PREMIER patients’ much worse baseline HAQ scores (and hence modelled utility) than is expected for patients with early RA.
Important general RA management principles in the UK were included in the present model. Specifically, after initial therapy with DMARDs, UK patients are usually offered biologics. Their disease is monitored, and non-responders are switched to the next therapy in their treatment sequence. In the current model, data are based on patients with early, aggressive RA. Therefore, treatment with biologics is assessed earlier in the care pathway than is current practice in the UK. As indicated by the results, there may be a benefit in treating patients earlier in this way, especially in terms of avoiding irreversible joint damage. However, it is acknowledged that in UK clinical practice, RA is usually monitored through measurement of CRP and key components of disease activity by using a composite score such as DAS28, with an improvement of 1.2 DAS points considered as an adequate response to treatment.40 In the current model, ACR criteria are instead used to measure response. ACR criteria are determined through a combination of DAS28 components and pain score. The discrepancy in responder status between DAS28 and ACR response criteria has previously been shown to be less than 5%41 and as such, we do not expect the use of different criteria to change the conclusions from our model. Furthermore, in scenario analyses we showed that altering the response hurdle does not greatly affect conclusions of cost-effectiveness.
In conclusion, the results of this new modelling approach, which sought to integrate explicitly into a single unifying framework the reversible and irreversible effects of RA, suggest that starting with combination therapy in early, aggressive RA is not only effective, but is also associated with an acceptable balance between costs and effects. The results also indicate that when the impact of irreversible radiographic damage is ignored, the cost-effectiveness ratio of treatments for early RA may be overestimated.
Acknowledgments
Assistance: Medical writing and editorial assistance were provided by Cathryn M Carter, MS and Eric Bertelsen, PhD, of Arbor Communications Inc, Ann Arbor, MI, USA. Financial support for these services was provided by AbbVie Inc, North Chicago, Illinois, USA.
References
Supplementary materials
Supplementary Data
This web only file has been produced by the BMJ Publishing Group from an electronic file supplied by the author(s) and has not been edited for content.
- Data supplement 1 - Online supplement
Footnotes
Contributors SS, MFB, MAC and BAV conceptualised the research and contributed to the interpretation of the data. SS, MFB and BAV wrote the statistical analysis plan and analysed the data. SS, BAV, MFB and MAC drafted and revised the paper. AbbVie Inc. participated in the study design, research, data collection, analysis and interpretation, and writing, reviewing and approving this publication. All authors had access to the data and participated in the development, review and approval, and in the decision to submit this publication.
Funding Financial support for this study was provided entirely by AbbVie Inc, North Chicago, Illinois, USA. The funding agreement ensured the authors’ independence in designing the study, interpreting the data, writing and publishing the report. The following author is employed by the sponsor: MAC. The publication of study results was not contingent on the sponsor's approval.
Competing interests MFB and BAV are owners and employees of Pharmerit, which received payment from AbbVie for this research. SS is an employee of Pharmerit. MAC is an employee of AbbVie Inc and owns stock.
Provenance and peer review Not commissioned; externally peer reviewed.
Data sharing statement No additional data are available.