Article Text

Abstract
Objectives The aim of this paper is to estimate the impact of smoking and alcohol use on the increase in social inequality in mortality in Denmark in the period 1985–2009.
Design A nationwide register-based study.
Setting Denmark.
Participants The whole Danish population aged 30 years or more in the period 1985–2009.
Primary and secondary outcome measures The primary outcome is mortality rates in relation to educational attainments calculated with and without deaths related to smoking and alcohol use. An absolute measure of inequality in mortality is applied along with a result on the direct contribution from smoking and alcohol use on the absolute difference in mortality rates. The secondary outcome is life expectancy in relation to educational attainments.
Results Since 1985, Danish overall mortality rates have decreased. Alongside the improvement in mortality, the absolute difference in the mortality rate (per 100 000 persons) between the lowest and the highest educated quartile grew from 465 to 611 among men and from 250 to 386 among women. Smoking and alcohol use have caused 75% of the increase among men and 97% of the increase among women. Among men the increase was mainly caused by alcohol. In women the increase was mainly caused by smoking.
Conclusions The main explanation for the increase in social inequality in mortality since the mid-1980s is smoking and alcohol use. A significant reduction in the social inequality in mortality can only happen if the prevention of smoking and alcohol use are targeted to the lower educated part of the Danish population.
- PUBLIC HEALTH
- EPIDEMIOLOGY
This is an Open Access article distributed in accordance with the Creative Commons Attribution Non Commercial (CC BY-NC 4.0) license, which permits others to distribute, remix, adapt, build upon this work non-commercially, and license their derivative works on different terms, provided the original work is properly cited and the use is non-commercial. See: http://creativecommons.org/licenses/by-nc/4.0/
Statistics from Altmetric.com
Strengths and limitations of this study
The entire Danish population aged 30 years or more is included for a period of 25 years.
Mortality due to smoking is estimated using a commonly used indirect method.
In the beginning of the study period, information on educational attainment is incomplete for 90% of the population above 64 years of age. However, the missing data on education become smaller during the time period of the study.
Introduction
Many western countries have experienced an increase in life expectancy with a contemporary marked increase in social inequality in mortality over the last decades, and Denmark is no exception.1–7 Some environmental and behavioural risk factors have been identified as mediating the effects of social position on disease incidence and survival, but exactly what drives the growth in this health divide remains to be determined.8 ,9 In general, equalities in health are associated with income equality and equal distribution of power in the society, and therefore the question about what drives the health gap is even more intriguing in a Nordic welfare state such as Denmark where income inequality is low and has declined through most of the twentieth century.10 ,11 Smoking-related and alcohol-related deaths contribute substantially to inequalities in mortality in several western countries.6 ,7 ,12 Studies of cause-specific mortality in relation to social position have been used to determine what drives the health gap, and large inequalities in lung cancer and chronic obstructive pulmonary disease (COPD) mortality indicate the pervasive role of smoking as a proximal cause of inequality.12–18 The estimated contribution from risk factors on inequalities in mortality varies in the literature due to different types of data and methodology, but most importantly, it varies due to the fact that the level and the social distribution of smoking and alcohol habits differ between countries. For example, inequalities in mortality in Italy and Spain are smaller than in other European countries and this has proved to be due to smaller socioeconomic differences in smoking behaviour.13 ,19 Comparisons of mortality differences between countries show that variations can to a large extent be explained by causes of deaths related to smoking and alcohol abuse. In the 1980s, it became clear that Denmark, for instance, was behind in terms of the increase in the trend in life expectancy compared to countries such as Sweden and the UK, and that this could be explained to a large extent by smoking and alcohol use.20–24
Smoking prevalence is negatively and strongly associated with social position in Denmark. A marked decrease in smoking prevalence has been seen since 1970,25 but the lowest educated share of the population did not manage to quit smoking to the same extent as the best educated, resulting in an increase in relative social inequality in daily smoking.26–28 There has also been a shift in the social pattern of alcohol consumption in Denmark: while the prevalence of exceedance of the sensible drinking limits (21 drinks per week for men and 14 drinks per week for women) has remained unchanged for the lowest educated, a decline has been observed for the most highly educated section of the Danish population.26 ,28 Even though a reversed social gradient is seen in alcohol intake, the consequences from alcohol use, for example, hospitalisation and mortality, is negatively associated with social position.29
The shifts in social patterns of smoking and alcohol use in Denmark makes it interesting to focus on the contribution of smoking and alcohol on the growing social inequality in mortality. The contribution of smoking-related and alcohol-related deaths to the growing social inequality in mortality has previously been addressed mainly by studying cause-specific mortality, and few studies have estimated the direct contribution of alcohol and smoking on the increase in inequality in mortality.30 ,31 The aim of this paper is to estimate the impact of smoking and alcohol on the increase in social inequality in mortality in Denmark in the period 1985–2009.
Materials and methods
We study the Danish population aged 30 years or older over a 25-year period (1985–2009). In 2009, the Danish population aged 30 years or over amounted to approximately 3.6 million persons. The study is based on data from registers on causes of death and educational attainment. Each inhabitant of Denmark has a personal 10-digit identification number (CPR number), and these numbers are attached to every registration in the registers regarding mortality and education. The CPR numbers make it possible to follow individuals over time and link information about mortality to information about education.32 Persons younger than 30 years of age are excluded due to the uncertainty of their educational attainments, and the fact that few deaths related to smoking and alcohol occur among this group.
Education and demography
The Populations Education Register (PER) contains annual individual-based information about education, including enrolment status, completed courses and examinations carried out at Danish educational institutions.33 In this study, we use information on the highest acquired level of education measured in months. We use information about educational level from 1 October 1984 to 1 October 2008. In the whole study period, educational levels have increased in the Danish population and, therefore, educational quartiles are defined to make sure that the size of educational groups is consistent over time. The educational quartiles are defined for men and women separately, as all mortality calculations are sex specific. If several people have an educational level at the quartile point, we divide individuals randomly between groups. The educational groups, which are divided at the quartile points, are relatively small in all periods. In the first study period (1985–1989) the lower quartile value is 84 months (7 years) for men and women, and the upper quartile value is 162 months (13.5 years) for men and 156 months (13 years) for women. In the last study period (2005–2009), the lower quartile value is 120 months (10 years) for men and 108 months (9 years) for women, and the upper quartile value is 168 months (14 years) for men as well as for women. Quartiles are only defined where information on educational level is available.
Missing data on education
In the first study period (1985–1989), information on educational attainment is incomplete for 90% of the population above 64 years of age. In the age group 30–64 years, between 1% and 5% have missing data on educational attainment. As time passes, the missing data problem on education gets less severe and in the next period 1990–1994 the missing data problem is limited to persons aged 70 years or above. For the last period of the study (2005–2009), educational data are imperfect for individuals aged 85 years or above. An overview on the missing data problem is seen in table 1. To rectify the missing educational information, we apply the distribution of mortality between educational groups from the latest available period. Mortality by educational groups for individuals aged 65–69 years in 1985–1989 is estimated by using the relative distribution of mortality between educational groups for individuals aged 65–69 years in 1990–1994. The relative distribution is multiplied by the number of deaths for individuals aged 65–69 years in 1985–1989. As an example, we know that there are 30 125 deaths (3020 from lung cancer) in the age group 65–69 years in the period 1985–1989. In this period, 71% of the population in this age group have missing educational level. In the next period (1990–1994), we have information on mortality and educational level, and we know that approximately 60% of the lung cancer deaths were found in the lowest educational quartile. We add this distribution of mortality between educational groups on the period 1985–1989, that is, 1812 out of 3020 deaths of lung cancer are found in the lowest educational groups.
Missing data on educational level according to period and age groups (%)
Mortality by educational groups for individuals aged 70–74 years in 1985–1989 and 1990–1994 is estimated by use of information from the distribution in the period 1995–1999, etc. No information on education is available for persons aged 85 years or over, and the mortality rates for this age group are therefore assumed to be identical in all educational groups. Separate analyses that include the age group 30–64 years (with known educational level) are made as a sensitivity analysis.
Mortality
The Cause of Death Register (CDR) contains all registered deaths that have occurred in Denmark. In its present form, the register dates back to 1970. For all registered deaths, the underlying cause of death and any contributory causes of death are listed. The cause of death is classified by the International Classification of Diseases (ICD) from 1969 to 1993 by the eighth revision (ICD-8) and from 1994 onwards by the tenth revision (ICD-10).34 For the determination of alcohol-related deaths, we use underlying as well as contributory causes of death, and the following deaths are classified as alcohol related: alcoholism and alcohol psychosis (ICD-8: 291, 303; ICD-10: F10), cirrhosis of the liver (ICD-8: 571; ICD-10: K70-K74), pancreatitis (ICD-8: 577; ICD-10: K85-K86) and alcohol poisoning (ICD-8: 860; ICD-10: X45, X65, Y15).
To determine smoking-related death it is necessary to account for the cumulative effect of smoking for a longer period of time. We use a frequently applied indirect method developed by Peto et al.35 The method is based on aetiological fractions and uses estimates of lung cancer mortality among never smokers to estimate the contribution from smoking on mortality from other types of cancer, COPD, other respiratory diseases, cardiovascular diseases and other natural diseases. The method takes unmeasured confounding into account to ensure that mortality from smoking is not overestimated. In this study, we use a 30% reduction of the excess risk to take unmeasured confounding into account; the 30% reduction is considered to provide a conservative estimate.36 It is assumed that no smoking-related deaths occur before age 35 and no deaths caused by cirrhosis of the liver or occurring by accident, suicide, or homicide are related to smoking. We use data from the CDR from 1 January 1985 to 31 December 2009.
The results are presented as mortality rates (per 100 000 persons) calculated as a 5-year average (1985–1989… 2005–2009). Calculations are made by counting all deaths in the period and comparing the sum to the total time at risk. As a measure of inequality, the absolute difference between the mortality rate in the lowest and that in the highest educational groups are calculated. When calculating the contribution from smoking and alcohol on the growth in the social gap in mortality, the absolute difference in the gap in the period from the first until the last period is divided into mortality due to smoking, alcohol and other causes. We report the results in shares. All calculations are sex specific and the European standard population is used as a reference population for age standardisation.
Results
In 1985–1989, smoking-related and alcohol-related deaths accounted for 34% of all deaths among men and 17% of all deaths among women in Denmark. In 2005–2009, smoking-related and alcohol-related deaths accounted for 32% among men and 27% among women, with the increase among women generated by an increase in smoking-related deaths (table 2).
Deaths due to smoking, alcohol and other causes, and population size by gender and period
In the period 1985–1989, the age-standardised mortality rate among persons aged 30 years or over (per 100 000 persons) was 1960 and 1238 for men and women, respectively (figure 1). In the period 2005–2009, the age-standardised mortality rate had dropped to 1448 per 100 000 persons among men and 1006 per 100 000 persons among women. In parallel with the decrease in mortality rate, the absolute difference in mortality rates between the highest and the lowest educational group increased from 465 to 611 among men and from 250 to 386 among women (figure 1).
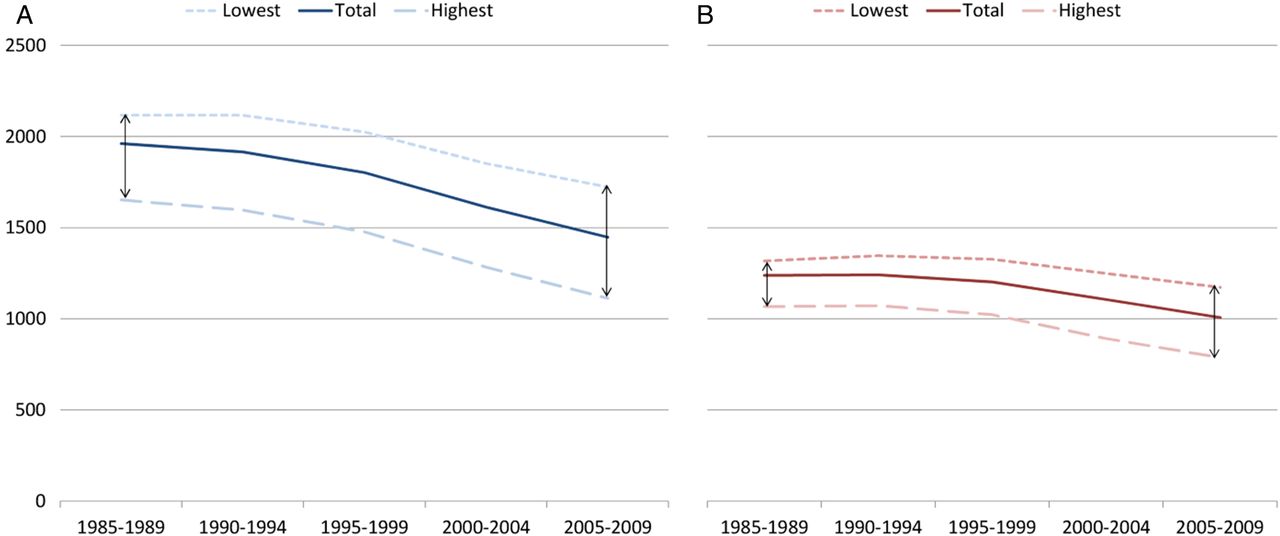
Mortality rates in the Danish population aged 30 years or more from 1985 to 2009 (the total population, the lowest educational group and the highest educational group). Age-standardised rates per 100 000 persons; men (A) and women (B).
The increase in the absolute difference between the highest and the lowest educational group amounts to the total mass of inequality, which is illustrated in figure 2. These absolute differences are divided into four groups: deaths due to: smoking, alcohol, alcohol and smoking and other causes.

Absolute differences in mortality rates between the lowest and the highest educational groups by causes of death groups; men (A) and women (B).
The contributions of these causes of deaths on the inequality in the different periods are presented in table 3. Among men, smoking and alcohol constitute 60.9% of the inequality in 1985–1989, and 64.2% in 2005–2009. A small increase in the contribution on inequality from alcohol and a small decline in the contribution from smoking are seen. Among women, an increase in the contribution from smoking and alcohol on inequality in mortality is seen from 1985–1989 to 2005–2009. In the first period, a total of 57.0% of the inequality in mortality was caused by mortality due to smoking and alcohol, and in the latest period the contribution was 71.1%.
Percentage of the absolute mortality difference between the lowest and the highest educational groups explained by smoking, smoking and alcohol, alcohol, by gender and period
When quantifying the contribution from smoking and alcohol on the change in inequality from the first to the last period, it is seen that alcohol is the main reason for the increasing inequality among men (causes 34.7% of the increase in inequality in mortality). In total, 74.6% of the increase in inequality in mortality in the period 1985–2009 can be explained by alcohol and smoking among men (figure 3). The increase in inequality among women is mainly generated by an increase in contribution from smoking. 72.5% of the increase in inequality is due to this single factor. In total, 97.0% of the increase in inequality in mortality can be explained by smoking and alcohol among women. Smoking and alcohol are in all periods responsible for the majority of the social inequality between the lowest and the highest educated groups. Furthermore, smoking and alcohol are the main reasons for the increase in absolute inequality in mortality.

The contribution from smoking, alcohol and other causes on the change in the absolute differences in mortality rates between the lowest and the highest educational groups; by gender.
Discussion
Main results
In this study, the contribution of smoking and alcohol to the increase in social inequality in mortality is estimated. Mortality rates in Denmark have been decreasing from 1985 to 2009 and the social inequality has widened simultaneously. Deaths due to smoking and alcohol constitute the same part among men in the period 2005–2009 as it did in the late 1980s. In the case of women, smoking-related and alcohol-related deaths now constitute a larger proportion of the total number of deaths compared to the late 1980s. It is found that smoking-related and alcohol-related deaths are the main reason for the social inequality in mortality, and constitute approximately 64% of that inequality among men and 71% among women in 2005–2009. Smoking and alcohol are also the main explanation for the increase in social inequality in mortality that has been observed in the period 1985–2009. Approximately 75% of the increase among men and 97% among women are related to these two factors. Among men, the increase is mainly generated by alcohol-related mortality, while smoking is the main cause for the increase in inequality in mortality among women.
Strengths, weaknesses and methodological challenges
A major strength of this study is that it is based on nationwide registers and therefore includes the whole adult Danish population aged 30 years or more over a period of 25 years.
In the study, we have chosen to focus on absolute differences in mortality rates, and compare the lowest and the highest educational groups while the intermediate groups are ignored in the calculations, this is done for reasons of clarity. However, we studied the trend in the intermediate groups to make sure that they followed the same trend as the highest and lowest educational groups, which was the case. We chose to focus on absolute differences but conducted analyses of relative inequality (rate ratios) and life expectancy as a robustness analysis. These results showed the same tendencies as the results presented in this article.
The calculations in this study are done by making assumptions about educational level and mortality in the oldest age groups. In order to judge the potential influence of these assumptions on the results, calculations on inequality in mortality are made for the group of individuals aged 30–64 years. In this age group, no assumptions about educational level are made. In this age group it is also shown that smoking-related and alcohol-related deaths can explain approximately 59% of the increase in social inequality among men and 100% among women. It is a major strength to the study that the results from the age group 30–64 years are in line with the overall estimates. We judge that the estimation of the missing data on education to be successful. As no information on education is available for persons aged 85 years and above, the mortality rates for this age group are therefore assumed to be identical in all educational groups; this will probably cause the estimation of educational differences to be conservative; even though it has been shown that the gradient is reduced in the older age groups, a negative gradient in education and mortality are expected in the oldest age group.37 Most deaths occur in the oldest age groups, but smoking-related and alcohol-related deaths account for a relatively larger part of the deaths in the age groups before age 65, and we therefore expect the effect from smoking and alcohol on inequality to be strongest before age 65. We do not expect our estimation on the distribution of mortality in the oldest age groups to affect the results on the contribution from smoking and alcohol. We know that the educational gap between the lowest and the highest educational groups has become bigger in all age groups until age 65. By applying the mortality distribution among the oldest age groups from the latest period (2005–2009) to the earlier periods, we might overestimate inequality in the earliest periods, and we therefore assume that the increase in inequality is underestimated.
We chose to group a continuous variable into quartiles in this paper, and therefore we might lose valuable information and underestimate the between-group variation.38 We chose this approach because, by grouping into quartiles, we could compare groups over time and compute life expectancy in different educational groups.
For several years there has been an increase in the average length of education in the Danish population. To account for changes in the size of the educational groups, we define educational quartiles. As of the fact that educational levels are defined by the age group 30–64 years, and the educational levels of the older age groups are determined subsequently, it is not possible to make educational groups completely equal in size. The group with the lowest educational level is slightly larger than the other groups, since older people in general have a lower level of education. This applies to all periods, however, and comparisons of inequality trends are still possible. As of the fact that the age distribution is different in the four educational groups, age standardisation of mortality rates is applied.
Previous research on the subject
It is an established fact that part of the social inequality in mortality in some western countries is related to smoking and alcohol use, but estimates of the level of contribution vary to a great extent. The variations in results are among others caused by differences in methods. Studies on mortality on causes of deaths for which smoking is a major risk are common, that is, studies of, for example, mortality differences in coronary heart disease, lung cancer and respiratory diseases.8 ,12 ,14 ,39 Some studies have estimated the contribution from smoking on mortality by conducting follow-up studies on survey respondents in terms of smoking habits either at baseline or by use of several measurements of smoking habits during follow-up. A follow-up study on Finnish men and women quantified the contribution of seven risk factors to be, respectively, 45% and 38%.16 These estimates are lower than the estimates found in our study, even though they include more risk factors. A follow-up study on British men and women estimates that smoking and alcohol together with a lack of physical activity can explain close to 72% of the social inequality in mortality.9 In this study, it is found that the measured contribution from the risk factors on social inequality becomes larger if several measures during follow-up are used. This result indicates that follow-up studies that use information at baseline might underestimate the contribution of risk factors on social inequality.
A few studies have been focusing on the explanation for the increase in social inequality in mortality. The studies are conducted in different periods of time and the results are presented in different units (life expectancy, relative mortality differences, absolute mortality differences, etc), which makes it difficult to compare these results. A study used an indirect method to determine smoking attributable deaths in Finland and found that the increase in social inequality in mortality among women was mainly driven by smoking, and among men it was found that factors other than smoking caused the increase in social inequality in mortality.30 Another Finnish study focused on alcohol and smoking and found that both factors have a major influence on income differentials in mortality, and that the contribution of these two factors has increased, with the exception of the contribution from smoking among men. This is identical to the overall findings in our study. In the USA, the growing educational differences in mortality have been particularly strong among white women since the 1980s, and it was found that smoking together with employment was the most important factor in explaining the increase in educational inequality in mortality.40 These results on gender differences is also well in line with our findings; that is, a greater part of the increase in social inequality can be explained by smoking among women when compared to men. In fact, our study showed that alcohol was a greater cause than smoking when it comes to explaining the increase in social inequality in mortality among men. Some studies on the influence of smoking on inequality focus only on men and estimate the contribution of smoking to be around 35–50%.15 ,41 This is consistent with our findings of between 41% and 48% contribution from smoking on inequality in mortality. The focus on men is adopted because it is believed that smoking explains a larger part of the inequality among men than among women.42 ,43 This view was probably applied due to the historically larger smoking prevalence among men. However, after the Second World War, Danish women adopted the smoking habits of men,44 and the share of smoking-related deaths among women has grown since the mid-1980s, even though there has been a marked decline in smoking prevalence since the 1970s. Quitting lowers the mortality risk and Danes with low levels of education did not manage to quit to the same extent as the highly educated did.45 The results from our and other studies that show smoking to be a bigger explanation of inequality among men than women, could also be supported by studies on gender differences in mortality in relation to smoking where it has been suggested that women may be more susceptible.46
Since smoking contributes more than alcohol to the social inequality in mortality, most studies focus on smoking. Our study shows that alcohol is the main explanation for the increase in inequality in mortality among men. A systematic review found that education and alcohol-related mortality were more strongly related among men compared with women, which is also the case in our study.47 In the oldest Danish population, exceeding the sensible drinking limits is more frequent among the most highly educated part of the Danish population, whereas the opposite is the case for the youngest part of the Danish population.28 It has previously been shown that not only the amount of alcohol consumed but also the drinking pattern has a significant effect on mortality, binge drinking being more damaging than frequent drinking, when comparing with the same amount of alcohol consumed. The fact that alcohol-related mortality is negatively associated with social position might be due to social differences in drinking patterns, because a higher rate of non-frequent drinking is found among the Danish population with the lowest level of education.48 The fact that alcohol plays an important role and that high alcohol consumption among the middle aged and the elderly is still more prevalent among the most highly educated also indicate that there might not only be a differential exposure but also a differential susceptibility to the health effects of alcohol.29
How to tackle social inequalities in mortality
Denmark has a very low level of income inequality generated by the core values in the Nordic Welfare model: equal access to healthcare, social benefits and a progressive income tax. The fact that the Scandinavian countries have low economic inequality and relatively high social inequality in health is still puzzling researchers, and different explanations for the “Scandinavian paradox” have been suggested.49 ,50 This study establishes that health behaviour plays an important role in equalising educational mortality differences.
The prevention of smoking among the least educated is by far the intervention that has the largest potential to reduce social inequalities in mortality in Denmark, since smoking as a single risk factor causes 41% and 60% of the social inequality in mortality among men and women, respectively. In 2007, Denmark introduced a smoking ban in workplaces and public places, but tobacco prices are still relatively low compared to other Nordic countries. The Tobacco Control Scale (TCS), which is a scale measuring overall tobacco control by rating price, noting bans and gathering information, ranks Denmark worse than all other Nordic countries.51 Recent reviews on a broad range of different tobacco control interventions have concluded that increases in tobacco prices have a pro-equity effect on smoking. For many other interventions, there is a lack of clear evidence, but they are unlikely to be able to reduce inequalities. Non-targeted smoking cessation programmes are likely to have a negative impact on inequality due to higher cessation rates among well-educated smokers.52 ,53 This is in line with the recent proposals from a Danish review on social inequalities in health.54
Evidence suggests that structural intervention is more likely to be effective in reducing inequality.11 Since Denmark is the only Nordic country that does not have a monopoly on alcohol retail and has the least restrictive alcohol policy, it is possible that legislation and taxation could have a pro-equity effect.55
The studies of social inequalities in mortality differ in the case of methodology, but the most important cause of differences in results is the variation in social distribution of smoking and alcohol intake between countries. If there are no social gradients in, for example, smoking behaviour, the contribution on smoking to inequality in mortality would, of course, be expected to be small, and countries with smaller inequalities in smoking behaviour would have smaller inequalities in mortality.13 ,19 A study of inequalities in mortality in 19 European countries showed that the potential of reducing inequalities in mortality caused by smoking were largest in Sweden, Finland, Denmark, England and Wales.56 A study nominated Denmark (out of 5 countries in Europe) as the country that would gain the largest reduction in life expectancy differences if the lowest educational group adopted the risk factor distribution of the highest educated, while in other countries it would have a rather small effect.57 In light of this result, it is obviously that the results of this study are, in general, not applicable to other countries, but will probably be in line with the results from countries that have the same social distribution of smoking and alcohol intake.
In 2006, Nobel Prize winner Amartya Sen wrote: “What is particularly serious as an injustice is the lack of opportunity that some may have to achieve good health because of inadequate social arrangements” (ref, 58 p.660). We can conclude as a fact that the part of the Danish population with the lowest educational level has been lacking the opportunity to achieve good health in the form of low mortality for a quarter of a century, and that this injustice is getting more severe. In light of the shifts in social patterns of smoking and alcohol use in Denmark, and the lag time between exposure and smoking-related and alcohol-related deaths, we ceteris paribus expect the gap to grow even bigger in the future. In order to tackle social inequality in mortality and life expectancy in the Danish population, intervention aimed at smoking habits and alcohol abuse among the least educated is unavoidable.
References
Footnotes
Contributors KJ generated the core idea for the study. MBK and KJ conducted the statistical analyses. MBK wrote the first draft of the paper. All authors contributed to analyses of the results, and to the writing and final approval of the paper. KJ is the guarantor.
Funding This research received no specific grant from any funding agency in the public, commercial or not-for-profit sectors.
Competing interests None declared.
Ethics approval The Danish national registers used in this study are approved by the National Data Protection Agency.
Provenance and peer review Not commissioned; externally peer-reviewed.
Data sharing statement Data used in this study cannot be shared, as it contains personal identification numbers (encrypted). Technical details and aggregated intermediate datasets are available from the corresponding author.