Article Text

Abstract
Background Data privacy is a major concern in spatial epidemiology because exact residential locations or parts of participants’ addresses such as street or zip codes are used to perform geospatial analyses. To overcome this concern, different levels of aggregation such as census districts or zip code areas are mainly used, though any spatial aggregation leads to a loss of spatial variability. For the assessment of urban opportunities for physical activity that was conducted in the IDEFICS (Identification and prevention of dietary- and lifestyle-induced health effects in children and infants) study, macrolevel analyses were performed, but the use of exact residential addresses for micro-level analyses was not permitted by the responsible office for data protection. We therefore implemented a spatial blurring to anonymise address coordinates depending on the underlying population density.
Methods We added a standard Gaussian distributed error to individual address coordinates with the variance  depending on the population density and on the chosen k-anonymity. 1000 random point locations were generated and repeatedly blurred 100 times to obtain anonymised locations. For each location 1 km network-dependent neighbourhoods were used to calculate walkability indices. Indices of blurred locations were compared to indices based on their sampling origins to determine the effect of spatial blurring on the assessment of the built environment.
Results Spatial blurring decreased with increasing population density. Similarly, mean differences in walkability indices also decreased with increasing population density. In particular for densely-populated areas with at least 1500 residents per km², differences between blurred locations and their sampling origins were small and did not affect the assessment of the built environment after spatial blurring.
Conclusions This approach allowed the investigation of the built environment at a microlevel using individual network-dependent neighbourhoods, while ensuring data protection requirements. Minor influence of spatial blurring on the assessment of walkability was found that slightly affected the assessment of the built environment in sparsely-populated areas.
- data protection
- built environment
- geocoding
- IDEFICS study
- spatial blurring
- walkability
This is an Open Access article distributed in accordance with the Creative Commons Attribution Non Commercial (CC BY-NC 4.0) license, which permits others to distribute, remix, adapt, build upon this work non-commercially, and license their derivative works on different terms, provided the original work is properly cited and the use is non-commercial. See: http://creativecommons.org/licenses/by-nc/4.0/
Statistics from Altmetric.com
Strengths and limitations of this study
-
Spatial blurring only induces small differences in values of the walkability index between blurred locations and their origins.
-
Impact of spatial blurring on the association between walkability and physical activity could not be investigated.
-
The use of a large simulated data set enabled us to identify differences in the walkability index and to calculate the k-anonymity of blurred points.
Background
Data privacy is a major issue in conducting epidemiological studies. In spatial epidemiology, data protection becomes an even more important concern, since the exact residential location or parts of participants’ address information such as street names or zip codes are used to perform geospatial analyses.1 ,2 To overcome this concern different levels of aggregation such as census districts or zip code areas are mainly used for spatial analyses of disease patterns or to assess the built environment in the neighbourhood of participants.1 ,3 Any administrative division, however, leads to a loss of spatial variability and the use of address proxies based on centroids of aggregated areas induces large positional discrepancies.3–5 Considering built environment research, the use of ego-centred neighbourhoods based on the home address of participants is recommended to assess environmental exposure of the built environment on a microlevel and to investigate its influence on physical activity of residents.6–8
Complementary to the overall examination programme of the IDEFICS study (Identification and prevention of dietary- induced and lifestyle-induced health effects in children and infants),9 we performed environmental analyses in German study regions using geographic information systems (GIS) to investigate the impact of the built environment on the physical activity of children.10 The IDEFICS study was conducted from 2006 to 2012 as a longitudinal multicentre study examining 16 228 children aged 2–9 years from eight European countries at baseline to investigate the aetiology of lifestyle-related and nutrition-related diseases.9 In one German study region, pilot analyses of the built environment were conducted on a macrolevel considering school catchment areas as aggregation level to assess the living environment of participating children.10
Linking individual and environmental data based on administrative areas has two main disadvantages. First, the use of school catchment areas, which are defined by the municipality, reduces the variability of environmental variables of participants, for example, by calculating average values of these variables in oftentimes large areas.6 Second, administrative areas are artificially defined and as such do not necessarily reflect individual characteristics or patterns in physical behaviour. Adjacent school catchment areas, for instance, may capture the living environment of children living near schools, but children living at the border of one area may be influenced by characteristics of an adjacent area, which is referred to as the container effect.4 Hence, assessing the environment of participants based on their exact home address provides the best information on the individual living environment. Such an approach may also overcome the modifiable area unit problem which results from artificial areas and varying sizes of aggregation levels.7 In the IDEFICS study, however, the use of exact address coordinates of participants was not permitted by the office for data protection of Lower Saxony, which was responsible for the two German study regions.
We therefore considered a geomasking approach to anonymise address data of participants in the German study regions of the IDEFICS study, which provides a simple method to blur participants’ address coordinates by adding a standard Gaussian error.2 ,11 According to Cassa et al,11 this approach only slightly affects cluster detection based on spatial scan statistics, but it is not clear how the assessment of built environment measures is affected.6 ,8 Thus, we calculated the walkability index according to Freeman et al12 in ego-centred network-dependent neighbourhoods around randomly generated point locations and their repeatedly blurred counterparts. Differences between the value of the index based on sampling origins and based on blurred locations were considered to assess whether this approach has an effect on walkability measures. Hence, the simulation study was conducted to investigate the effect of spatial blurring on walkability measures that are calculated on a microlevel while ensuring data protection requirements.
Methods
Spatial blurring
Implementing a fixed standard Gaussian error in a varying urban environment does not provide a proper disturbance that prevents the reidentification of addresses of participants’ home with regard to k-anonymity, where one participant should not be reidentified from at least k−1 individuals.11 ,13 ,14 For example, a fixed disturbance value used for one study region possibly allows to reidentify participants in sparsely-populated subdistricts, because anonymised addresses may be located close to less than k residents. In densely-populated subdistricts of the study area, such a disturbance value may be too large and could be reduced while still preventing reidentification of participants within k residents.11
To consider the variability of population density within a study region, we implemented a procedure to anonymise given coordinates  of participants
  on a surface
  . In detail, we added a spatial blurring
  based on independent Gaussian distributed errors
  for both components to obtain the anonymised coordinates
  , where
  and
and  is the two-dimensional identity matrix. Anonymised coordinates
  are located in a
  circle around the original address coordinates with probability of about 99.7%, due to the Gaussian distribution. Hence, we considered the area
  to define the degree of anonymisation using the expected age-specific number
  of residents that provides k-anonymity given as
  , where
  is the number of residents per km² and
  is the age-specific percentage of residents in a given subdistrict
  . Based on the parameter of k-anonymity
  , we derived the variance
  of the spatial blurring as being inversely proportional to the underlying population density
  of the specific age group as
In summary, the variance of the Gaussian error will be calculated for any coordinate based on the underlying population density of the considered age group and the chosen k-anonymity. The blurring is then induced by the inverse Gaussian distribution with mean value of zero and the given variance and is added to the original coordinates. Coordinates in densely-populated areas will be blurred less, and vice versa.
Built environment measures
Spatial data on land use and population density were provided by the land registry office of Lower Saxony. Data on footpath network were obtained from the OpenStreetMap project (http://www.openstreetmap.org) and validated using official data. Additionally, bus stops were digitalised based on available maps and lists provided by the public transit company.10 ArcGIS 10.0 (ESRI 2011. ArcGIS Desktop: Release 10. Redlands) was used to process and digitalise spatial data as well as to generate random locations within the study region.
The walkability index was calculated based on ego-centred network-dependent neighbourhoods capturing an area that can be reached within 1 km based on the street network.6 ,8 For both, circular and network-dependent neighbourhoods, the appropriate size of buffers that should be used to assess built environment measures is still discussed in the literature. Commonly used buffer distances range from 400 to 3200 m and are mainly defined according to walking distances.7 Thus, we determined the distance of 1 km based on a 10 to 15 min walking distance. Network-dependent neighbourhoods around blurred points and their origins were calculated using the network analyst-tool in ArcGIS 10.0.
Walkability measures were calculated within these ego-centred neighbourhoods using the spatstat-package (1.33.0)15 in R (3.0.1):16
-
Number of residents per km2,
-
Land use mix based on the entropy of land use types,
-
Number of intersections per area to assess the street connectivity,
-
And number of bus stops per area to assess public transit density.
To standardise all four measures, z-scores of each variable were calculated based on mean and SD of walkability measures determined separately for sampling origins and for each blurring step. Z-scores of all four measures were then summed up to the walkability index according to Freeman et al.12 Thus, the walkability score is a standardised non-dimensional score with mean value 0 and a SD of 4 based on the four standardised components.
Study data
We focussed our analyses of the built environment on one German survey region of the IDEFICS study to validate the approach of spatial blurring.10 For this purpose, we thus considered built environment measures that were assessed in the city of Delmenhorst, Lower Saxony, which covers an area of about 62 km² with about 77 300 residents. The baseline survey of the IDEFICS study was conducted in 2007/2008 and geographical data were assessed for the same year.9
We generated 1000 random locations  based on the underlying population density of the age-group that was eligible for the IDEFICS study within subdistricts in the study area of Delmenhorst which are presented in figure 1. We performed the spatial blurring based on the presented approach using data on residential density and the age-specific percentage of children below the age of 12 per subdistricts. These data were provided by the municipality of Delmenhorst. Randomly generated sampling origins
  were repeatedly blurred 100 times,
  based on the underlying age-specific population density
  and a given k-anonymity
  using the spatstat-package (1.33.0) and the sp-package (1.0–13) in R (3.0.1).

Distribution of random points and age-specific population density of subdistricts in the study region Delmenhorst, Germany.
With regard to statistics of aggregated areas, thresholds for k-anonymity of 5 or 10 are commonly used to prevent the reidentification of participants.13 ,14 However, determining k-anonymity for spatial analyses leads to a trade-off between geomasking of addresses and resulting k-anonymity, which has significant computational challenges.14 ,17 To identify the best approach that provides a compromise between geomasking and k-anonymity, we blurred sampling origins considering values of  as a parameter for the blurring variance
  . By this, we assumed that our virtual participants should not be reidentified among 10 and 15 residents of the same age group, respectively. We chose values greater than
  as parameter for k-anonymity, since shifting original addresses of participants through spatial blurring can result in anonymised locations that fall into sparsely-populated areas where common thresholds of k-anonymity may not be fulfilled anymore. We therefore calculated the observed k-anonymity
  of blurred locations
  and origins
  for each parameter
  based on the underlying age-specific population density within
  circles and evaluated if the observed k-anonymity
  did not fall under a threshold of
  .
.
Statistical analyses
To investigate the variation of the simulated blurring, mean, SD, and range of the simulated blurring  were calculated for each sampling origin. Additionally, the mean, SD, and range of
  of blurred locations were also calculated for each sampling origin. Spatial blurring and
  were depicted depending on the underlying population density. The walkability index was calculated based on ego-centred neighbourhoods of 1000 sampling origins i and of 100 000 blurred locations j. Owing to the spatial blurring, locations fell outside the study area and neighbourhoods could not be calculated for 480
  and 476
  blurred locations. Differences in values of the walkability index between blurred locations and their related origins were calculated to assess changes in the index that were induced by spatial blurring. For each sampling origin i mean differences of walkability indices of blurred locations j to the related origin were calculated and displayed depending on the underlying population density. All statistics were calculated in SAS 9.3 (SAS Institute Inc., Cary, North Carolina, USA).
Results
Figure 2 presents statistics of the simulated blurring  and the resulting
  compared to the initial
  and the threshold of
  , respectively. Mean shift of
  is close to the initial variance
  for both values of
  . Spatial blurring induced higher values of about 200–500 m for areas with less than 1000 residents per km²
  and for areas with less than 1500 residents per km²
  , respectively. Accordingly, mean and maximum shift
  decreased for densely-populated areas with more than 1500 residents per km². The maximum shift
  showed values of 150 m
  or 200 m
  at most, while mean
  decreased from 48 to 32 m
  and 58 to 39 m
  (figure 2, top). Summing up, for both values of k-anonymity the mean and maximum shift decreased with increasing residential density. Assuming a higher value of k-anonymity
  , that is a participant cannot be reidentified from at least 15 residents, the shift of the coordinates was slightly higher compared to the lower value of k-anonymity.

SD  of the spatial blurring
  and summary statistics of the simulated spatial blurring
  (top) and of resulting
  (bottom) depending on the underlying population density
  and two parameters
  .
.
Mean observed k-anonymity  leveled off at the chosen parameter
  . On the basis of higher value of k-anonymity
  the observed
  was higher than based on the lower value
  (figure 2, bottom). For both parameters, the observed k-anonymity
  showed values below the threshold of
  and even reached zero. Overall, the observed k-anonymity
  fell below
  for 4.3%
  and 1.2%
  of blurred address locations, respectively. In other words, on average the assumed parameter of k-anonymity was met. However, assuming the less restrictive k-anonymity (
 compared to
  ), the blurred coordinates were more likely to be reidentified from less than five residents after spatial blurring.
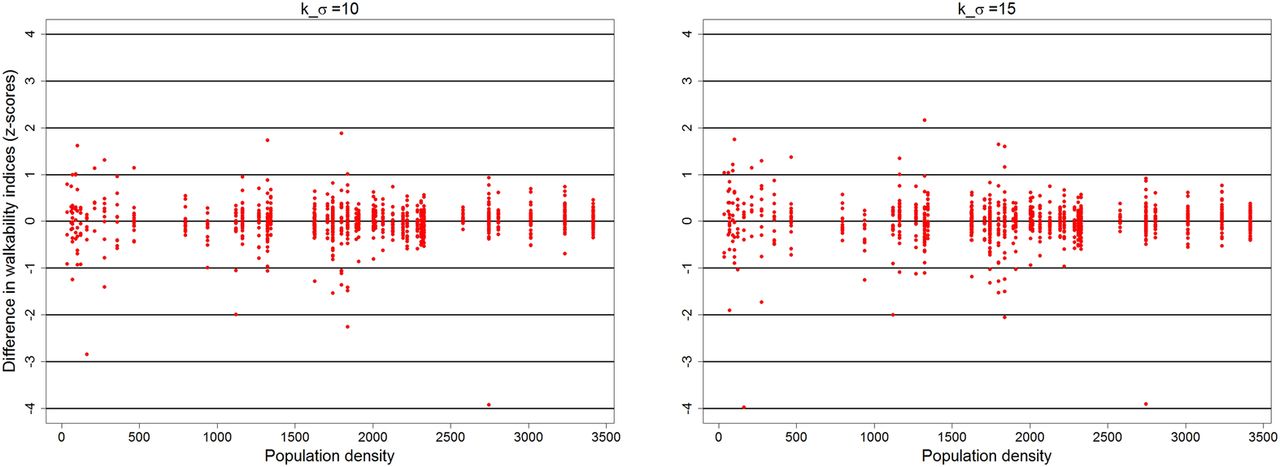
Values of walkability indices of 1000 original locations i showed mean and SD of  and 2.9 and ranged from −10.5 to 6.6. Figure 3 shows mean differences in the walkability indices between blurred locations j and their related sampling origins i depending on the underlying population density
  . Each dot shows the mean difference between the walkability index based on the neighbourhood of the sampling origin and walkability indices based on the neighbourhoods of 100 blurred locations of this origin. For both values of k-anonymity
  , the mean difference strongly decreased for a higher population density and did not exceed a value of 1 for at least 1000 residents per km² with only some exceptions. Summarising, it became obvious that the walkability index remained rather stable when shifting the address coordinates in densely-populated areas whereas it showed some more variability in sparsely-populated areas. For the more restrictive k-anonymity, a slightly higher difference between the walkability indices based on the blurred locations and the original location was observed.

Mean difference in walkability indices between original coordinates and blurred coordinates (dots) depending on the underlying population density  for parameters
  .
.
Discussion
The simulated spatial blurring that we conducted was based on randomly generated locations. In densely-populated areas, it resulted in only small shifts for most original locations. Owing to the population-dependent  , the blurred points were rather strongly shifted in sparsely-populated areas, but the shift was less than 50 m on average for densely-populated areas with at least 1500 residents per km². Apparently, a stronger shift was observed for
  than for
  , whereas for
  the resulting k-anonymity
  fell under the threshold of
  only in 1.2% of blurred locations.
Mean differences between walkability indices based on blurred points and on their related sampling origins showed similar patterns. For sparsely-populated areas, spatial blurring in most cases had a stronger impact on the walkability index. However, for blurred locations in densely-populated areas with at least 1000 residents per km², spatial blurring only led to differences in the walkability index of about 0.5–1 at most for both values of  . Compared to the range of the walkability index of original locations, these differences were acceptable and only slightly affected the assessment of built environment measures. On the basis of this approach, the use of anonymised individual coordinates of the home address was allowed by the office for data protection of Lower Saxony. In summary, we can therefore recommend
  as a reasonable compromise between an acceptable shift and k-anonymity. Based on the SD of walkability measures in our study, a difference of 0.5 is equivalent to 17% of the SD. In larger study regions with higher variation in built environment characteristics, the walkability index can show a higher range, as for example in Freeman et al,12 where the index showed values from −7.9 to 11.7. Thus, the effect of spatial blurring might be even lower depending on the size and environmental variability of the study area.
Our findings concerning the assessment of built environment measures are similar to the results of Cassa et al11 who showed that the spatial blurring only slightly affected cluster detection analyses. However, some limitations have to be discussed. Cassa et al18 deduced a vulnerability of spatial blurring which may enable adversaries to reidentify individuals based on the mean coordinates of multiple anonymised versions of the original data. Deriving ego-centred neighbourhoods based on address coordinates, that were only blurred once, should reduce the risk of reidentification of study participants.
Sparsely-populated areas, such as parts in the centre of the study area, induced larger changes in the walkability index if these areas were adjacent to densely-populated areas. Different approaches, such as the donut method,19 may reduce the geomasking error and should restrict effects of sparsely-populated areas within or at the edge of the study area as long as thresholds for k-anonymity are maintained.
Using a large simulated data set is the major strength of our study, since the knowledge about the origins and the outcome of our approach enabled us to identify the difference in the walkability index and to calculate the k-anonymity of blurred points. Repeating the spatial blurring multiple times for one origin also controlled for the variation in our results.
However, consequences for real study samples have to be further investigated. In the IDEFICS study, the majority of the participating children lived in urban and densely-populated areas of the study region.10 Thus, the spatial blurring should not affect the investigation of the built environment in the majority of the study sample. Rural and sparsely-populated areas may have an effect on the assessment of the built environment, due to the changes in walkability indices of blurred locations that were found in our analyses. Excluding participants that live in areas with less than 1000 residents per km² should ensure that spatial blurring does not lead to an undesired bias in the walkability index. However, the association of physical activity and built environment might then again be affected due to differences in the physical behaviour between residents of urban and rural neighbourhoods. Thus, the exclusion of participants in sparsely-populated areas still needs to be further investigated.
Eventually, we only inferred the effect of spatial blurring on the assessment of built environment measures, but not on the association between physical activity levels of residents and walkability in their neighbourhood. Thus, further analyses based on data of participants whose addresses are allowed to be used in spatial analyses are necessary to determine the effect of spatial blurring on the association between built environment and physical activity levels.
Taking the strengths and limitations into account, the effect of spatial blurring on built environment measures and on the walkability index was found to be relatively small. This supports the feasibility of the presented geomasking approach for densely-populated areas with at least 1000 residents per km². The use of point locations to assess the built environment on a micro-level is a strong advantage compared to the use of administrative areas and may compensate both, the disadvantages of spatial blurring and of a potential exclusion bias of participants that live in sparsely-populated areas.7 ,8 Investigating the association between physical activity levels of residents and the walkability of their neighbourhood, we may therefore conclude that a small change in the walkability index may only slightly influence the assessment of built environment measures.
Conclusion
The presented approach allows to assess the built environment on a microlevel while ensuring data protection requirements. It facilitates to determine the urban neighbourhood of each participant using ego-centred network-dependent neighbourhoods based on anonymised address coordinates. Small differences were found in the walkability index which should only slightly affect further assessment of the built environment. As a result of the spatial blurring, available individual contact details, such as address information, can be used to assess environmental exposure combining individual and environmental data on a microlevel while ensuring data protection requirements.
Acknowledgments
The authors acknowledge the cooperation with the office for data protection of Lower Saxony, Germany.
References
Footnotes
-
Contributors IP, SD, and CB conceptualised the research question and the geospatial analyses and interpreted the results. IP and CB discussed the results with the responsible office for data protection. CB conducted the analyses and wrote the manuscript and SD and IP reviewed the manuscript. All authors approved the final manuscript for publication.
-
Funding This work was funded by the German Research Foundation (DFG) under grant PI 345/7-1.
-
Competing interests None.
-
Provenance and peer review Not commissioned; externally peer reviewed.
-
Data sharing statement The R code and the simulated data is available from the authors on request.