Article Text

Abstract
Objectives The prevalence of sensory impairment at an early stage of amyotrophic lateral sclerosis (ALS) is still debated. The study aim was to investigate the anatomofunctional properties of sensory pathways in patients with ALS, combining spinal diffusion tensor imaging (DTI) and somatosensory evoked potentials (SEPs).
Design Case–control study.
Settings ALS referral centre and laboratory of biomedical imaging (Paris, France).
Participants Well-characterised group of 21 patients with ALS with moderate disability (mean amyotrophic lateral sclerosis Functional Rating Scale (ALSFRS) score 39.3±1.0) and no clinical sensory signs and control group of 21 gender and age-matched healthy subjects.
Outcome measures Fractional anisotropy and diffusivity of the dorsal columns at C5-T1 levels (DTI metrics) and SEPs after median and ulnar nerve stimulations (latency and amplitude of N9 and N20 components).
Results Abnormal DTI metrics indicated anatomical damages of ascending sensory fibres in ∼60% of patients (p<0.05). Raw SEPs (μV) were smaller in ∼40% of patients but the difference with healthy subjects was not significant (p>0.16). Their normalisation to prestimulus activity strengthened the difference between groups (p<0.05) and allowed identification of ∼60% of patients with abnormal values. According to N9 latency, the peripheral conduction time was normal in patients (p>0.32) but based on N20 latency, the central conduction time (between spinal cord and parietal cortex) was found to be slower (p<0.05). Significant correlation was found between DTI metrics and N9 amplitude (p<0.05). Altered SEPs were also correlated with the disease duration (p<0.05). Taken together, spinal imaging and electrophysiology helped to identify ∼85% of patients with subclinical sensory defect while separated methods revealed abnormal values in ∼60%.
Conclusions Sensory impairments have been underestimated at early stages of ALS. These results show for the first time the interest to combine electrophysiology and imaging to assess non-motor system involvement in ALS.
Trial registration number IDRCB2012-A00016-37.
This is an Open Access article distributed in accordance with the Creative Commons Attribution Non Commercial (CC BY-NC 4.0) license, which permits others to distribute, remix, adapt, build upon this work non-commercially, and license their derivative works on different terms, provided the original work is properly cited and the use is non-commercial. See: http://creativecommons.org/licenses/by-nc/4.0/
Statistics from Altmetric.com
Strengths and limitations of this study
-
For the first time, spinal diffusion tensor imaging (DTI) and electrophysiological recordings were coupled to evaluate the anatomofunctional properties of sensory pathways in humans. This combined approach and the normalisation of somatosensory evoked potentials revealed subclinical sensory defects in 85% patients with amyotrophic lateral sclerosis (ALS).
-
The anatomical damages of dorsal columns revealed by spinal DTI were correlated to the depression of the peripheral afferent volley revealed by the lower amplitude of N9 which further supports the fact that sensory defects can occur at an early stage of ALS.
-
Subclinical sensory impairments can manifest in ALS and should no longer cause doubt on the diagnosis. The defect was correlated to the disease duration but a follow-up study would confirm the progressive sensory affection.
Introduction
Amyotrophic lateral sclerosis (ALS) is the most common motor neuron disease characterised by degeneration of upper as well as lower motor neurons. Postmortem anatomopathology has also revealed degeneration of sensory fibres but to a lesser extent than motor axons, and it has been suggested that the sensory system might be similarly affected as the motor system, but the degeneration is less advanced at the time of death.1–3 Peripheral and central degeneration of sensory pathways have also been reported in presymptomatic ALS mice, suggesting that the sensory defect occurs at a very early stage of the degenerative process.4–6 Accordingly, sensory nerve biopsy7 and multiparametric spinal imaging of the dorsal column8 have revealed subclinical anatomical damage in patients, including those at an early disease stage after diagnosis. From a pathophysiological perspective, the role of sensory involvement in the degenerative process in ALS is still unknown. From a clinical perspective, while discreet sensory clinical impairment does not exclude ALS diagnosis, it is declared atypical or even excluded when sensory abnormalities are major.9 ,10 Because of these uncertainties, better characterisation of the sensory involvement in well-characterised populations of ALS is needed.
Sensory nerve action potentials (SNAPs) and somatosensory evoked potentials (SEPs), routinely used to assess sensory pathways, have been investigated extensively in patients with ALS. Except in three studies,11–13 abnormal SEPs were reported, on average, in about 1/3 patients without clinical sensory deficits.7 ,14–22 The abnormality increases with disease severity,20 ,23–28 and is more common when stimulating lower limb peripheral nerves than those of upper limbs.16 ,17 ,25 ,29 However, the anatomical substrate of altered SEPs demonstrated in previous studies remains disputed. Indeed, altered cortical SEPs were not always associated with abnormal SNAPs and/or cervicobrachial SEPs (N9). Moreover, altered SNAPs were most often observed in patients exhibiting sensory signs or symptoms, or were sometimes related to associated medical conditions (polyneuropathy, median or ulnar nerve entrapment neuropathies).12 ,20 ,25 ,27–30 In line with this, the various components of cortical SEPs are not altered unequally, whether in amplitude and/or latency, and given the multiple origins of the SEP components,31 some authors have suggested that abnormal SEPs in ALS are not due to sensory defects but to abnormal cortico-cortical interactions.24 ,32
Until now, it has therefore been difficult to establish a link between anatomical and functional alterations of sensory pathways in ALS, given that the latter are based on SEPs, that depends on peripheral afferent inputs and cortico-subcortical excitability.31 Moreover, the origin of the neural sources, discrimination of which is based on the latency of SEP components, becomes uncertain when SEPs are delayed. Thus, the aim of the present work was to test, in typical patients with ALS with distal motor dysfunctions in upper limbs and no sensory symptoms, whether abnormal metrics of dorsal column imaging are associated with altered SEPs, with a focus on N9 and N20 components, which depend mainly on the peripheral afferent volley.31 In addition, to control for experiment-dependent variability of electrophysiological measurements, a limitation for the interpretation of previous studies, we propose to normalise SEP amplitude to improve evaluation of interindividual differences, as performed when studying muscular recordings.33
Methods
Participants
Inclusion criteria were: (1) probable or definite ALS according to the El Escorial criteria, (2) absence of sensory symptoms or signs (normal touch, proprioception and nociception), (3) motor weakness in hand muscles (median and ulnar nerve territories) on the electrophysiologically explored side and (4) absence of medical conditions associated with peripheral neuropathy (eg, diabetes, alcoholism, neurotoxic drugs, nerve entrapment, neuropathy). Twenty one patients with ALS were enrolled in the study (all but one sporadic; 5 females, 56.3±2 years old, range 37–76) and 21 aged- and gender-matched neurologically intact participants (controls; 5 females, 56.6±2.1 years old, range 33–73). The disease duration from the onset of weakness was 26.6±3.6 months. All patients but one were treated with riluzole (100 mg/day) and α-tocopherol (1000 mg/day). Clinical measures included manual muscle testing, total Amyotrophic Lateral Sclerosis Functional Rating Scale (ALSFRS)-R and assessment of hand motor performance by the ALSFRS-R subscore for handwriting, hand muscles testing and the nine hole peg test (table 1).
Clinical data
Spinal diffusion tensor imaging
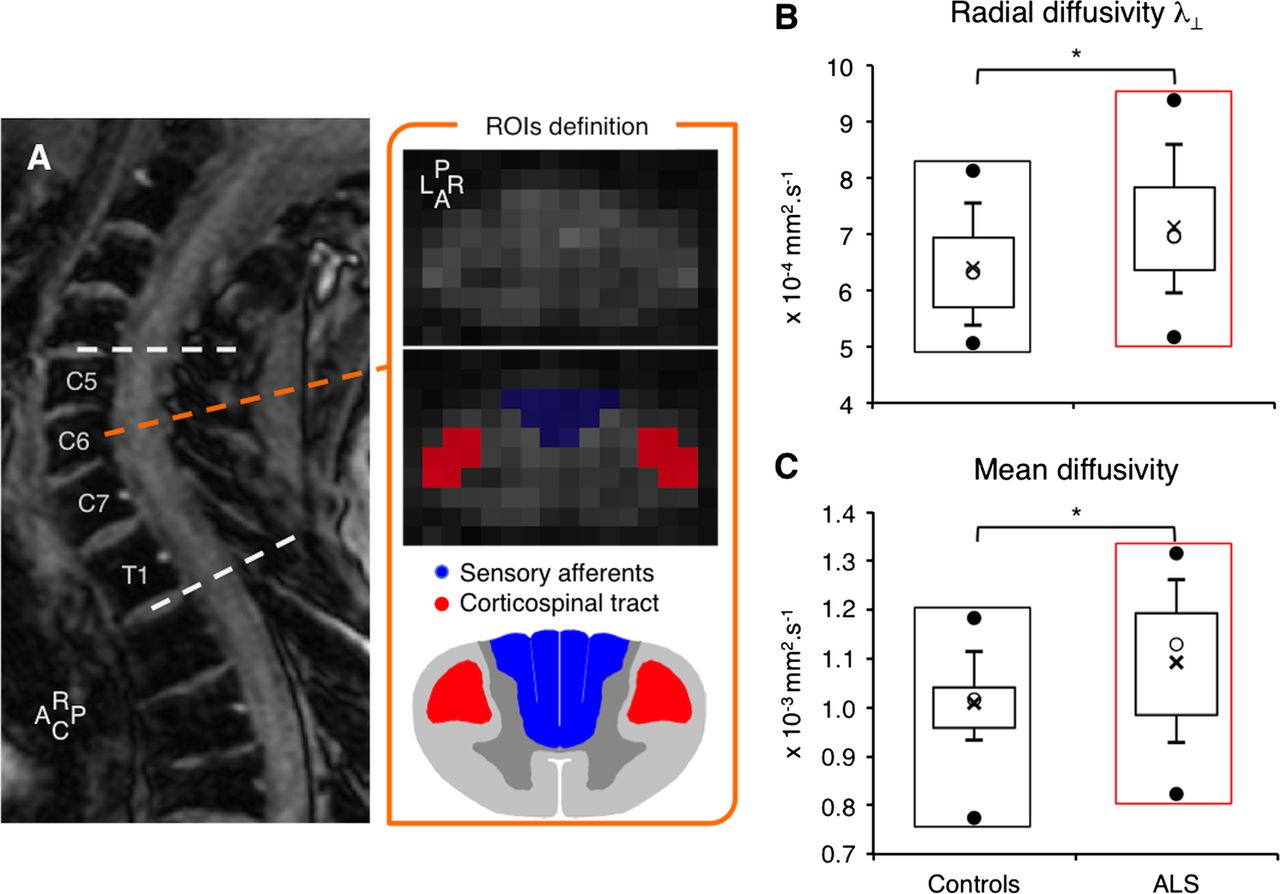
Image acquisitions were performed using a 3 T MRI system (TIM Trio, Siemens Healthcare, Erlangen, Germany) and neck/spine coil. Cardiac-gated diffusion tensor imaging (DTI) was performed using a single shot echo-planar imaging (EPI) sequence with monopolar scheme. The axial slice was positioned perpendicular to the spinal cord, in the middle of each vertebral level between C2-T2 vertebral levels (8 slices) but the acquisition was optimised for C5-T1 (figure 1A). Imaging parameters were: field of view =128 mm, TR/TE=700/96 ms, voxel size =1×1×5 mm3, parallel acquisition: R=2, b-value 1000 s/mm2, 64 directions, 2 repetitions, acquisition time 10 min. For a comprehensive description of the MRI acquisition parameters, the readers are invited to refer to a previous paper.34

Spinal diffusion tensor imaging metrics. (A) T2-weighted MRI sagittal slice (rostro (R)—caudal (C) axis) and mean diffusion-weighted images (C6 vertebra level) in one patient with amyotrophic lateral sclerosis (ALS). For each level between C5 and T1 (dashed white lines), the posterior (P, in blue) and left (L) and right (R, in red) region of interests (ROIs) were drawn manually on the mean diffusion-weighted images to include most of the posterior column-medial lemniscus pathway (sensory pathways) and lateral corticospinal tracts (motor pathways), respectively. The posterior ROI was split in two parts for the right and left side of the spinal cord, according to the antero (A)—posterior axis and the slice centre of mass. Box plot charts showing distribution of data for the radial (B) and mean diffusivity (C) in controls (black rectangles) and in patients with ALS (red rectangles): the top and bottom line of the box correspond to the 75th centile (top quartile) and 25th centile (bottom quartile), respectively, and the open circle in the box, to the 50th centile (median). The two bars extend from the 10th centile (bottom centile) to the 90th centile (top centile). The bar caps delimit outliers. The top and bottom filled circles indicate the maximum and minimum values, respectively. The cross within the box indicates the arithmetical mean. *p<0.05.
Electrophysiology
Electrophysiological investigations were performed the same day as the MRI in each participant. Median and ulnar nerves were stimulated (1 ms rectangular electrical stimulation; DS7A, Digitimer Ltd, Hertfordshire, UK) at the wrist level using bipolar surface electrodes (0.5 cm2, 1 cm apart). All controls were stimulated on the dominant side, according to The Edinburgh handedness inventory;35 right side in 20 participants and left side in 1. Patients with ALS were stimulated on the most affected side (distal hand weakness) or on the dominant side when both sides were equally affected: 17 patients were stimulated on the dominant right side, 1 patient on the dominant left side and 3 patients on the left non-dominant but more affected side. Perceptual and motor thresholds (PT and MT, respectively; figure 2) were estimated in both nerves. Stimulus intensity was then adjusted at 9×PT in each subject. A recording surface electrode was stuck in the supraclavicular fossa (Erb's point) ipsilateral to the stimulations with a reference electrode on the contralateral supraclavicular fossa. A needle electrode was inserted in the scalp, 4 cm lateral and 2 cm posterior from Cz, in front of the primary somatosensory cortex (S1) contralateral to the stimulations with a surface electrode for a reference on the ipsilateral ear lobe. Electrophysiological signals were filtered (bandwidth 30–3000 Hz) and amplified (×10 000; D360 8-Channel Patient Amplifier, Digitimer Ltd, Hertfordshire, UK) before being digitally stored (2 kHz sampling rate) on a personal computer for offline analysis (Power 1401 and Signal Software, CED, Cambridge, UK). Each recording session consisted of 200 ulnar nerve and 200 median nerve stimuli alternated randomly (2 Hz). Three recording sessions were performed for each participant.
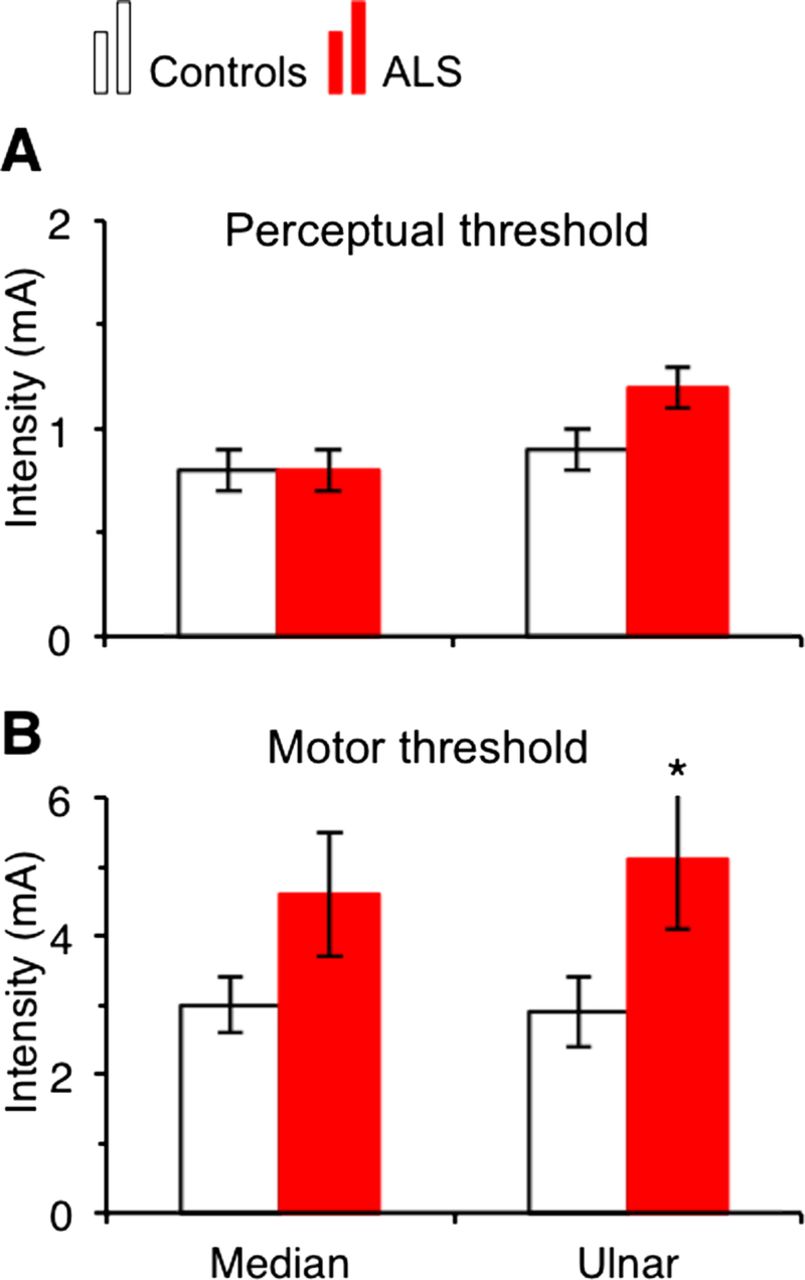
Perceptual and motor threshold for median and ulnar nerve stimuli. Mean perceptual (A) and motor (B) thresholds for median nerve (left columns) and for ulnar nerve (right columns) estimated in the group of controls (open columns) and of patients with amyotrophic lateral sclerosis (red columns). Vertical bars are ±1 SEM. *p<0.05.
Data analysis
DTI
Motion correction was applied slice-by-slice using FSL FLIRT with three degrees of freedom (Tx, Ty, Rz). Diffusion tensor and its related metrics, fractional anisotropy (FA), axial (λ⁄⁄) and radial (λ⊥) and mean diffusivity (MD), were estimated on a voxel-wise basis. The region of interest (ROI), limited to the hemidorsal region ipsilateral to the electrical stimulations, was manually defined on each slice using geometry-based information. To avoid any user bias, the ROI was defined on the mean diffusion weighted images by an experienced segmentation operator (MMEM; figure 1A).8 ,34 Furthermore, during ROIs classification, the operator opted for a conservative approach by excluding pixels that were at the cord/corticospinal fluid or white matter/grey matter interfaces.
Electrophysiology
Peak latencies of N9 (Erb's point) and N20 (parietal) were evaluated in each subject. The peripheral conduction velocity (CVp) was calculated according to the distance between stimulating electrodes and C7 vertebra and N9 latency. The central conduction velocity (CVc) was calculated according to the distance between C7 and parietal cortex and the difference between N9 and N20 latencies. Peak-to-peak amplitude of N9 (figure 3A, B) and amplitude of the first positivity of N20 (figure 3C, D) were measured and normalised to the prestimulus activity (calculated over a 100 ms period, excluding the stimulus artefact). Given the variability of prestimulus activity, the SD of prestimulus activity was calculated and multiplied by 2 (2×SD) to define the positive and negative limits of background activity (dotted lines in figure 3A, D). This procedure is commonly used to determine when the activity significantly changes from background activity after stimuli. Because these limits give a good estimation of prestimulus activity amplitude, we used the procedure to normalise the amplitude of SEPs.

N9 and N20 amplitude. Raw signal (in μV) from recordings at the Erb point level (A and B) and at cortical level (in front of S1, C and D) in one healthy subject (control, A and C; black lines) and in one patient with amyotrophic lateral sclerosis (ALS, B and D; red lines). Dashed lines indicate the 0 level. Upper and lower dotted lines indicate +2×SD and −2×SD levels, respectively. Group data showing the mean amplitude of N9 (left) and of N20 (right) normalised to prestimulus activity in controls (open columns) and in patients with ALS (red columns) after median (E) and ulnar nerve stimulation (F). Vertical bars are±1 SEM. *p<0.05, **p<0.01 and ***p<0.001.
Statistics
First, each DTI and electrophysiological metric was independently compared between groups using unpaired t tests. Then, the metrics found to be significantly modified in patients were retained for further analyses to test the relationships between these metrics and clinical features for the group of participants. Thus, multiple regression analyses were performed to test the link between λ⊥, MD, N9, N20 and CVc according to the subject groups. In addition, Pearson correlation analyses were performed to investigate the relationships between clinical features and λ⊥, MD, N9 and N20. The 95% CI of control data was calculated for DTI and electrophysiological metrics. These intervals were used to fix the limits of normal values in order to identify the patients exhibiting abnormal data with a risk of error less than 5%. Statistical analysis was conducted using StatEL software (http://www.adscience.eu) and the significance level was set at p value <0.05. Arithmetical means are indicated ±1SEM.
Results
Spinal DTI metrics
The box plot charts in figure 1B, C show the distribution of λ⊥ and MD, respectively, in the hemidorsal region of the spinal cord, corresponding to the posterior column-medial lemniscus pathway ipsilateral to electrical stimuli delivered when investigating SEPs (see below), in 20 controls and 19 patients (due to artefacts, 1 control and 2 patients were excluded). On average, both metrics were significantly higher in patients than in controls (unpaired t test, p<0.05). Abnormal values of λ⊥ and MD were observed in 11/19 patients (57.9%). The differences in λ⊥ and MD were not accompanied by a significant change in FA or λ⁄⁄ (p=0.29 and 0.06, respectively).
Similar analyses were also performed on the lateral region corresponding to the lateral corticospinal tract. On average, λ⊥ and MD were also higher in patients than in controls (p<0.01 and 0.05, respectively) and FA was smaller (p<0.05); λ⁄⁄ was not significantly different between groups (p=0.42).
Electrophysiological measurements
Figure 2 shows the mean PT and MT for median and ulnar nerves in controls and patients. While PT for both nerves was similar between controls and patients (p=0.93 and 0.73 for median and ulnar nerves, respectively; figure 2A), MT was higher in patients, reaching the statistically significant level for the ulnar nerve (p<0.05 and 0.12 for the median nerve; figure 2B). The stimulus intensity used for evoking SEPs (9×PT) was above MT for both nerves in all controls and in 16/21 patients for the median nerve and in 18/21 patients for the ulnar nerve.
Significant difference between groups was not observed in peak latency for N9 (for which one patient was excluded because of artefacts) nor for N20 (table 2; 0.25<p<0.93). N9 latency only depended on the peripheral conduction time (between stimulating electrodes and Erb's point) and was thus used to estimate the CVp. For both nerves, the CVp was found to be similar in patients and controls (p=0.56 and 0.32, in median and ulnar nerve, respectively). The CVc (between spinal cord and parietal cortex) was estimated by subtracting N20 and N9 latencies. It was slower in patients than in controls, reaching statistical significance for the median nerve only (p<0.05, and 0.08 for the ulnar nerve).
N9 and N20 characteristics
Figure 3A, D shows the raw signals in one control (AC) and 1 patient (BD). Both N9 (AB) and N20 (CD) were smaller in the patient compared to the control. On average, the raw amplitude (in μV) of both N9 and N20 was smaller in patients than in controls, but the difference did not reach statistical significance (0.16<p<0.42; table 2). When normalised, the difference between groups became significant (p<0.01 and 0.001 for N9 in median and ulnar nerve, respectively, and p<0.05 for N20; figure 3E, F), which confirmed that the peripheral volley (N9) and the first component of early cortical SEP (N20) were smaller in the patient group. No significant correlation was observed between the amplitudes of N9 and N20 (Pearson, p=0.67).
Abnormal N9 was observed in 17/20 patients (85%) for the ulnar nerve and in 9/20 patients (45%) for the median nerve. Abnormal N20 was observed in 11/21 patients (52.4%) for the ulnar nerve and in 10/21 patients (47.6%) for the median nerve. On average, the SEP normalisation helped to identify 57.5% of patients with abnormal values while 41.3% exhibited abnormal raw data (in μV).
Relationships between DTI and electrophysiological metrics
The scatter plots in figure 4 show the dispersion of N9 and N20 amplitudes according to MD (dorsal column ipsilateral to stimulation site) for controls and patients, for median as well as ulnar nerves (Dixon test did not detect any aberrant values). Multiple regression analyses further confirmed the significant difference between groups, in N9 and N20 amplitudes. In addition, significant relationships were found between DTI metrics and N9 (except for λ⊥ and N9 from ulnar) but not with N20 (see statistics in table 3). Similarly, significant relationships were observed between the CVc and λ⊥ (p<0.05) and MD (p<0.01) for the median nerve.
Results of multiple regression analyses
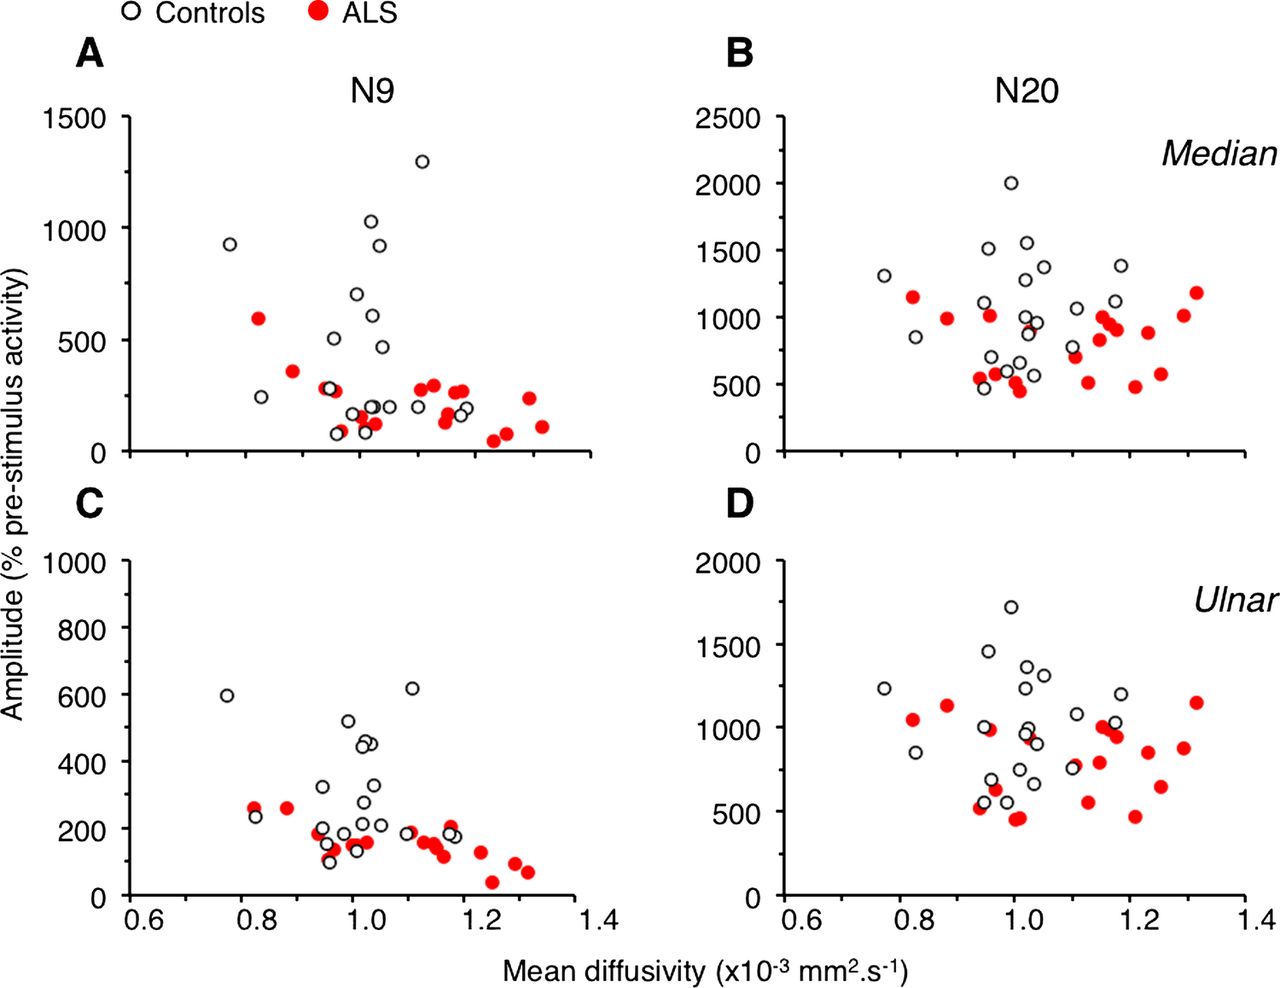
Relationships between diffusion tensor imaging and electrophysiological metrics. N9 (A and C) and N20 (B and D) amplitude (% 2×SD of the prestimulus activity) plotted against the mean diffusivity (×10−3 mm2/s) for median nerve (A and B) and for ulnar nerve (C and D). Each open circle represents one control and each red circle, one patient with amyotrophic lateral sclerosis.
Figure 5 shows that a larger proportion of patients exhibited abnormal DTI metrics and/or evoked potentials (84.7±3.8% on average; red portion) compared to patients having normal metrics (white portion). Among the patients exhibiting at least one abnormal metric, 44.4±7.1% have both abnormal DTI and evoked potentials (purple subportions). Similar proportions were found when comparing the DTI metrics and the CVc.

Patient data distribution. Proportion of patients exhibiting normal (white portion) and abnormal diffusion tensor imaging (DTI) metrics and/or abnormal amplitude of N9 (A and B) or N20 (C and D; red portion) for the median (A and B) and ulnar nerve (C and D). Among the patients with abnormal metrics (red portion), the proportion of patients with abnormal DTI metrics only (and thus normal evoked potentials) is illustrated by the blue subportion, the proportion of patients with abnormal evoked potential only (and thus normal DTI) is illustrated by the green subportion, and the proportion of patients with abnormal DTI metrics and abnormal evoked potentials is illustrated by the purple subportion.
Correlation with clinical features
Multiple regression analyses were performed to investigate the relationships between DTI and electrophysiological metrics and clinical features. λ⊥, MD, N9 and N20 were not correlated with any clinical features related to hand motor performance (ALSFRS-R subscore for handwriting, hand muscle testing, nine hole peg test; 0.27<p<0.79).
Pearson correlation analyses revealed a significant depression of N20 according to the disease duration (R2=0.17 and 0.15 for ulnar and median nerve, respectively; p<0.05). N9 significantly decreased with disease duration for median nerve only (R2=0.19, p<0.05; R2=−0.05, p=0.74 for ulnar nerve). No significant relationship was found between disease duration and spinal DTI metrics (p>0.3).
Discussion
The main result of the present study is that by coupling spinal DTI and electrophysiology, almost 85% patients with ALS with subclinical sensory defect in an upper limb could be identified. Considered separately, each technique revealed abnormal values in less than 60% patients. The second novelty of this study is that normalisation helped to identify more patients with abnormal SEP from a 40% detection rate when expressed in μV, to 60% when taking into account the level of prestimulus activity. This study has also shown a significant relationship between DTI metrics and N9, and a significant depression of evoked potentials with disease duration.
Reliability of spinal DTI
Spinal DTI metrics were found to be significantly altered in patients, which gives further support for early anatomical damage of the dorsal columns in ALS. Compared to our previous study,8 the patients in the present study exhibited less motor weakness especially in proximal upper limb muscles. Accordingly, λ⊥ for the lateral corticospinal tracts was lower in the present study compared to the previous one, which supports a less severe impairment of the motor pathways in the patients investigated here. Moreover, while the relationship between motor and sensory deficits has not been characterised so far, some studies have reported increased SEP alteration with the disease severity.20 ,23–28 Given that the degeneration is likely to be slower in sensory pathways than in motor pathways,2 one would expect a smaller λ⊥ for the dorsal columns in the present study, compared to the previous one,8 which was the case. Thus, the comparison between the two studies indicates that spinal DTI is a reliable and very sensitive method for detecting anatomical tract defects at spinal level.
Normalisation of electrophysiological measurements
The amplitude of SNAPs and SEPs produced by mixed nerve stimulation are usually compared using the raw signals expressed in μV. However, it is well known in electrophysiology that intrinsic (background activity, individual bioelectrical characteristics) and extrinsic factors (single-use electrodes, whose properties and position can slightly differ across experiments) can influence the signals, which accounts for the huge interindividual and intraindividual variability of EEG recordings.36 Some studies on visual evoked potentials in humans have revealed the influence of the level of prestimulus EEG activity on the size of the evoked potentials and reported better reliability with normalised data.37 ,38 Here, SEPs were normalised to 2×SD of prestimulus activity, which is commonly used to evaluate the level of activity before conditioning, and to determine when the poststimulus signal deviates significantly from background activity. Normalisation of evoked potentials to this value allowed the basal activity to be taken into account and reduced the variability due to noise. Comparison of normalised data strengthened the differences between groups, helped to identify more patients with abnormal values and indicated a greater mean suppression from 20% (in raw data) to 50% (when normalised) for N9 and <5% to 20% for N20 (according to the mean values in controls). The comparison of raw and normalised data suggests that abnormal SNAPs and SEPs in ALS might have been previously underestimated.
Alteration of peripheral volleys
Histological evidence for sensory nerve degeneration has only been found in lower limbs with sural nerve biopsies.3 In upper limbs, abnormal SNAPs were found mainly in patients with clinical sensory signs.7 ,12 ,20 ,25 ,27 ,29 ,30 To some extent, we found analogous results because the characteristics of N9 (Erb's point) were as in controls: similar peak latency and similar CVp with no significant change in the mean raw amplitude (in μV). However, abnormal raw values were observed in 20–50% of patients and the normalisation strengthened the difference between groups, which further supports subclinical peripheral abnormalities.27 Our group of patients was very homogenous in regard to hand muscle weakness in the median and ulnar nerve territories, which might account for the higher proportion of patients exhibiting abnormal N9 compared to previous studies.21–23 Alternatively, a reduced antidromic volley in motor axons may account for N9 depression. However, a study performed in patients with pronounced or complete loss of motor axons in the median nerve failed to reveal any change in N9.39 According to hand motor weakness, we found a higher MT in patients and, in some, the conditioning stimuli used to evoke SEPs were below MT. However, these patients did not exhibit the smallest N9 and there was no link between abnormal N9 values and MT. Lastly, the relationship between spinal DTI and N9 further supports the fact that the latter depends mainly on the peripheral sensory afferent volley31 and its alteration in ALS.
Origin of the impairments along the sensory pathways
The present changes in spinal DTI metrics give further evidence for anatomical impairments of sensory pathways in ALS. The alteration of N9 amplitude, without changes in peripheral conduction velocity, suggests loss of peripheral sensory axons.3–6
The first cortical component N20 was delayed and depressed to a lesser extent than N9. The absence of correlation between the alterations of N9 and N20 can be explained by the fact that at a stimulus intensity producing maximal N20, N9 reached half its maximal size, and this intensity can be at or slightly above MT.40 Therefore, at the stimulus intensity we used (9×PT, which was above MT in most participants), N20 was likely to be maximal and, because of saturation, the measurements might have been less sensitive at a cortical level than at a peripheral level. However, N20 not only depends on the sensory afferent inputs, but also to central processing.40 Accordingly, a recent cerebral MRI study has shown atrophy in the thalamus,41 suggesting that the thalamocortical relay for sensory information may be altered in ALS. In line with this, we found a slower CVc in patients than in controls, without any change in CVp. Therefore, abnormal N9 and N20, together with impaired spinal DTI reported here, give strong evidence for subclinical sensory defects in ALS at peripheral as well as central levels.
Comparing median nerve and skin stimuli suggests that N20 mainly depends on cutaneous inputs to the 3b area.31 ,42–44 Thus, altered N20 from median nerve stimulation could suggest impaired cutaneous fibres. However, if low-threshold cutaneous afferents were affected, this would have influenced PT, which was found unchanged. Alternatively, changes could be due to proprioceptive afferents. Cutaneous fields innervated by median nerve are larger than those innervated by ulnar nerve but 75% intrinsic hand muscles are innervated by ulnar nerve. Additionally, SEPs from mixed nerves in lower limbs, probably more motor than the median nerve (such as ulnar nerve), are mainly produced by proprioceptive afferents.45 Therefore, impaired proprioceptive inputs would affect SEPs produced by ulnar nerve more than those produced by median nerve, which was the case.
The absence of clinical sensory signs, of correlation between sensory defect and motor symptoms and the fact that DTI metrics for the lateral corticospinal tract were more affected than those for the dorsal columns suggest that the impairment of sensory pathways was less than that of motor systems. However, the correlation with disease duration suggests that the degeneration of sensory pathways is progressive.
Conclusions
The combination of normalised electrophysiological measurements and spinal DTI metrics suggest that sensory deficits in ALS have been previously underestimated and gives further evidence for early degeneration in sensory pathways at peripheral as well as central levels. These results show, for the first time, the benefit of combining electrophysiology and biomedical imaging to assess non-motor system involvement in ALS.
Acknowledgments
The authors thank Dr N Leforestier, Dr T Lenglet, Dr F Salachas, Dr G Bruneteau and Dr V Meininger for their help in patient recruitment, and Dr R Morizot-Koutlidis for her help in the experimental design for SEP recordings. They also thank C Macia, K Nigaud, F Humbert and R Valabrègue for their valuable technical assistance during MRI acquisitions, which were performed at CENIR-ICM Hôpital Pitié-Salpêtrière. Their gratitude also goes to S Blancho for her help to obtain the approval of the local ethics committee and for monitoring the project. At last, they deeply thank Dr Anna Hudson (Neuroscience Research Australia) for scrutinising the English.
References
Footnotes
CI and SS are co-first authors; VM-P and P-FP are co-last authors.
-
Contributors VM-P and P-FP were involved in conception and design of research and P-FP in patient selection. CI, SS and VM-P were responsible for acquisition and analysis of electrophysiological data, CI and M-MEM for MRI acquisitions, and M-MEM for DTI analysis. CI, SS, M-MEM and VM-P was responsible for statistical analysis; HB for supervision of MRI and statistical analysis; CI, SS, M-MEM, VM-P and P-FP for interpretation of the data; and CI, M-MEM and VM-P for drafting of the manuscript and figures. All authors have approved the final version of the manuscript.
-
Funding This work was supported by IRME (ID RCB 2012-A00016-37) and ANR (ANR-12-JSV4-0007-01). CI was supported by a grant from FRM, M-MElM by IHU-A-ICM Pitié-Salpêtrière (ANR-10-IAIHU-06), and SS by a grant from UPMC.
-
Competing interests None.
-
Patient consent Obtained.
-
Ethics approval The study conformed to the standards set by the latest revision of the Declaration of Helsinki and has been approved by the ethics committee of Pitie-Salpetriere Hospital (CPP-Ile-de-France VI).
-
Provenance and peer review Not commissioned; externally peer reviewed.
-
Data sharing statement No additional data are available.