Article Text

Abstract
Objectives Accurate assessment of cartilage status is increasingly becoming important to clinicians for offering joint preservation surgeries versus joint replacements. The goal of this study was to evaluate the validity of three-dimensional (3D), gradient-echo (GRE)-based T2* and T1Gd mapping for the assessment of various histological severities of degeneration in knee joint cartilage with potential implications for clinical management.
Methods MRI and histological assessment were conducted in 36 ex vivo lateral femoral condyle specimens. The MRI protocol included a 3D GRE multiecho data image combination sequence in order to assess the T2* decay, a 3D double-echo steady-state sequence for assessment of cartilage morphology, and a dual flip angle 3D GRE sequence with volumetric interpolated breathhold examination for the T1Gd assessment. The histological sample analysis was performed according to the Mankin system. The data were then analysed statistically and correlated.
Results We observed a significant decrease in the T2* and T1Gd values with increasing grades of cartilage degeneration (p<0.001) and a moderate correlation between T2* (r=0.514)/T1Gd (r=0.556) and the histological grading of cartilage degeneration (p<0.001). In addition, we noted a zonal variation in the T2* and T1Gd values reflecting characteristic zonal differences in the biochemical composition of hyaline cartilage.
Conclusions This study outlines the potential of GRE-based T2* and T1Gd mapping to identify various grades of cartilage damage. Early changes in specific zones may assist clinicians in identifying methods of early intervention involving the targeted joint preservation approach versus moving forward with unicompartmental, bicompartmental or tricompartmental joint replacement procedures.
Trial registration number DRKS00000729.
This is an Open Access article distributed in accordance with the Creative Commons Attribution Non Commercial (CC BY-NC 4.0) license, which permits others to distribute, remix, adapt, build upon this work non-commercially, and license their derivative works on different terms, provided the original work is properly cited and the use is non-commercial. See: http://creativecommons.org/licenses/by-nc/4.0/
Statistics from Altmetric.com
Strengths and limitations of this study
-
The main strength of this study is the validation of three-dimensional (3D), gradient-echo (GRE)-based T2* and T1Gd mapping for the assessment of various histological severities of degeneration in knee joint cartilage that translates into treatment implications.
-
Any study that would attempt to correlate actual human histology to MRI features can, at best, be in vitro, given the nature of ethics involved. This is, therefore, the best possible scientific evidence that could be presented based on the comparison of human tissues and their histological and imaging features.
-
Identifying early changes in specific zones of the symptomatic joints can aid clinicians tremendously in recommending a targeted joint preservation approach versus focal or compartmental joint replacements. In essence, this can further structure the decision-making process from an evidence-based objective evaluation.
-
The zonal manifestations of imaging and degeneration can serve as baseline data for future studies related to this subject.
-
There are a number of limitations to this study, including the following: Polarised light microscopy and quantitative type-II collagen content assessment for further comparison were not performed in this study, and therefore subtle changes in the collagen matrix could have been missed. This was an ex vivo study and observations under in vivo conditions may differ from those made in this study. As all specimens were collected from patients undergoing arthroplasty with likely cartilage damage in various stages, this study sample may not be representative of a population with normal cartilage.
Introduction
Osteoarthritis (OA) remains the most common degenerative musculoskeletal condition.1–3 In the past decade, there have been tremendous advances in understanding and implementing joint preservation methods.4–9 Many of these joint preserving strategies are based on the early detection of cartilage damage and timely intervention. Subsequently, non-invasive modalities of detecting early cartilage matrix alterations, including new imaging techniques for the same, have aroused a great deal of interest.10–14
The MRI technique has undergone a fundamental change with recent modalities or imaging protocols that are sensitive to collagen fibre network disorders, alterations in water content and glycosaminoglycan (GAG) depletion, all of which occur early in the course of OA.15 These ‘biochemically sensitive’ MRI protocols, which include techniques of delayed Gadolinium-enhanced MRI of the cartilage (dGEMRIC),16 T2 mapping17 ,18 and others,19–22 have been validated as biomarkers for disease onset and progression, making them reliable assessment tools for diagnosis and follow-up.
Briefly summarised, the dGEMRIC technique includes the administration of a negatively charged gadolinium-based contrast agent and subsequent measurement of the T1 relaxation time (T1Gd, dGEMRIC index, T1Gd mapping). The contrast agent infiltrates the cartilage tissue in an inverse relation to the negatively charged GAG content, reducing the MR parameter T1 relaxation time within the infiltrated tissue. Therefore, higher T1Gd values will be measured in healthy cartilage, whereas low T1Gd values will be noted in degenerated, GAG-depleted cartilage. In contrast, T2 mapping, which is performed by multiecho sequences with varying echo times and signal levels, targets the MR parameter T2 relaxation that results from nuclei dephasing due to random interactions between adjacent nuclei and consecutive variations in the precessing frequencies of the nuclei. T2 relaxation is affected by the water content and interactions between water molecules and collagen fibres so that high T2 values indicate a high water content and superior water molecule mobility and vice versa. A decrease in T2 relaxation towards the deep zones is characteristic of articular cartilage where the uniform perpendicular collagen fibre orientation and high proteoglycan content promote water molecule restriction and T2 decay.
T2* relaxation-time mapping reflects an additional dephasing effect, which results from local field inhomogeneity due to differences in the magnetic susceptibility among various tissues, chemical shifts, gradients applied to perform spatial encoding and main magnetic field heterogeneity.23 T2* relaxation is exceptional for gradient-echo (GRE) MRI because in spin-echo MRI this dephasing effect is eliminated by the applied 180° refocusing pulse. Although previous studies have noted a correlation between T2 and T2* mapping,24–27 there are substantial differences between the two modalities that explain the diverging T2 and T2* values in various grades of cartilage degeneration.28 Since the T2* relaxation time is influenced both by the T2 relaxation and coherent de-phasing local susceptibility fields, a lower spectrum of T2* is noted.23 Furthermore, with echo times of approximately 10–100 ms, T2 mapping spin-echo sequences capture T2 relaxation that is to a large extent interrelated to bulk water. In contrast, T2* mapping comprises signals of shorter echo times and as such is less sensitive to the water content of the cartilage, while it may be further dependent on differences in tissue composition at a microscopic and macroscopic level (eg, changes of macromolecules and their orientation). Finally, due to the absent 180° refocusing pulse, T2* relaxation is less sensitive to stimulated echoes and magnetisation transfer24, whereas susceptibility artefacts by artificial particles and by tissue interfaces can have a substantial impact on the T2* measurement.
More recently, fast T1 assessment using a dual flip angle (FA) GRE sequence instead of a standard inversion recovery technique for dGEMRIC,29 and GRE-based T2* mapping24 as an alternative to the spin-echo-based T2 mapping approach, have enabled faster imaging times and isotropic three-dimensional (3D) cartilage evaluation. Both techniques have been studied in vivo and in vitro, indicating the diagnostic potential of these techniques for cartilage assessment in various disease patterns and grades of degeneration.28 ,30–34 However, certain uncertainties that are crucial to the further application of these techniques for the reproducible evaluation of articular cartilage remain. Although these sequences may be fairly unfamiliar to some readers, it is important to note that changes in sequences are often created to allow faster scanning while attempting to maintain the integrity of detailed cartilage evaluation including biochemical assessment. All these factors are important in practical day-to-day clinical practice for appropriate clinical scanning, prognostication and outlining of management.
The goal of this study was to evaluate the validity of T2* mapping and GRE-based T1Gd measurement for the assessment of knee joint cartilage degeneration. We conducted a histologically controlled in vitro study including human femoral lateral condyle specimens with various grades of cartilage degeneration.
Methods
Study sample
Following ethics committee approval, 40 lateral femoral condyle specimens were obtained from 40 patients who underwent total knee arthroplasty for symptomatic OA of the knee (13 male patients, mean age: 63±10 years, age range: 43–83 years, 38 right knees). All specimens underwent macroscopic inspection for descriptive documentation of cartilage status. Four samples were discarded due to complete loss of cartilage leaving the subchondral bone exposed. The remaining 36 lateral femoral condyles with macroscopically intact cartilage surface were marked with four Ethipins (Ethicon, Norderstedt, Germany) in order to denote the region of interest (ROI) and to provide an orientation for subsequent matching of the MRI and histology sections. Subsequently, each specimen was thoroughly irrigated with sterile saline to remove free particles and preserved in saline at −20° Celsius for further processing and analysis.
Magnetic resonance imaging
After slow thawing of the specimens in a refrigerator at 4°C for 24 h, MRI was performed on a 3-T system (Magnetom Trio, Siemens Medical Solutions, Erlangen, Germany) with a 7 cm receive-only surface coil (Magnetom Trio A Tim System, Siemens Medical Solutions, Erlangen, Germany). The specimens were securely fixed in a small jar with superglue so that the cartilage surface and the marked ROI pointed towards the roof of the jar. The jar, initially filled with normal saline, was located at the centre of the imaging table and the surface coil was placed on top of the jar using sponges and adjustable straps for fixation. This imaging set-up resulted in a maximum signal-to-noise ratio as the cartilage ROI was located within the iso-centre of the surface coil and the magnet.
The MRI protocol encompassed a precontrast and a postcontrast examination. The pre-ontrast protocol included a 3D gradient-echo (GRE) multiecho data image combination (MEDIC) sequence with six consecutive echo readings in order to assess the T2* decay. For the postcontrast examination, the saline solution was removed and a 2 mM Gadolinium (Gd)-based contrast agent solution (Gd-DOTA−, Dotarem, Guerbet, Roissy, France) was added. The postcontrast MRI protocol included a 3D double-echo steady-state (DESS) sequence with water excitation for morphological cartilage assessment, a B1 prescan with various flip angles (FAs) for B1 field-inhomogeneity correction,35 and a dual FA 3D GRE sequence with volumetric interpolated breathhold examination (VIBE) for the T1Gd assessment. The 3D T2* and T1Gd maps were automatically generated by an inline processing package (SyngoMapIt, Siemens Medical Solutions, Erlangen, Germany), which operates a non-linear least square fitting routine.
Based on previously reported T1Gd data using Gd-DOTA− uptake into cartilage under in vitro conditions,30 which demonstrated a decrease in the T1Gd value 40 min after contrast agent administration and a steady state after that time with no further decrease in T1Gd, in this study T1Gd mapping was performed at 40 min after the gadolinium administration. Furthermore, for comparability reasons and to perform a uniform ROI analysis, the image resolution was kept similar in all cartilage-specific sequences. Further details on the imaging parameters are provided in table 1.
MRI settings for the multiecho data image combination (MEDIC) sequence for T2* mapping, the double-echo steady-state (DESS) sequence for morphological cartilage assessment, the B1 Prescan with various flip angles for B1 field-in-homogeneity correction and the dual flip angle Volumetric Interpolated Breathhold Examination (VIBE) sequence for T1Gd mapping
Histological sample preparation
After MR scanning, the femoral condyles were thoroughly irrigated with normal saline and stored at −20° Celsius until further assessments were carried out. The histological sample processing was performed based on a protocol for non-decalcified sectioning.36 Briefly, the specimens were dehydrated in an ascending alcohol series and embedded in Methyl methacrylate (Technovit 9100 new, Hereaus Kulzer, Weinheim, Germany). Sagittal sections were cut along the long axis of the Ethipins, generating 12–22 serial sections of each femoral condyle (section thickness: ∼200 µm) using a diamond edge bandsaw blade (Exakt, Nordenstedt, Germany). These sections were then ground to the final section thickness of ∼50 µm and polished with a plate grinder (Exakt microparallel-grinding System). Staining was performed with toluidine blue (0.1% toluidine blue in 0.1% sodium tetraborate; Merck, Darmstadt, Germany). For documentation and subsequent digital imaging, a binocular light microscope (Olympus BX50, Olympus, Hamburg, Germany), a colour CCD camera (Color View III, Olympus) and an imaging and documentation life science system (cell^D, Olympus) were used.
Image analyses
The 3D DESS, T2* and T1Gd data sets were processed on a Leonardo workstation (Siemens Medical Solutions, Erlangen, Germany). Having obtained isotropic 3D sequences, using multiplanar reformat (MPR) software and guided by anatomical landmarks along with the Ethipins, we were able to generate 155 MRI reformats that coincided with the histological sections.
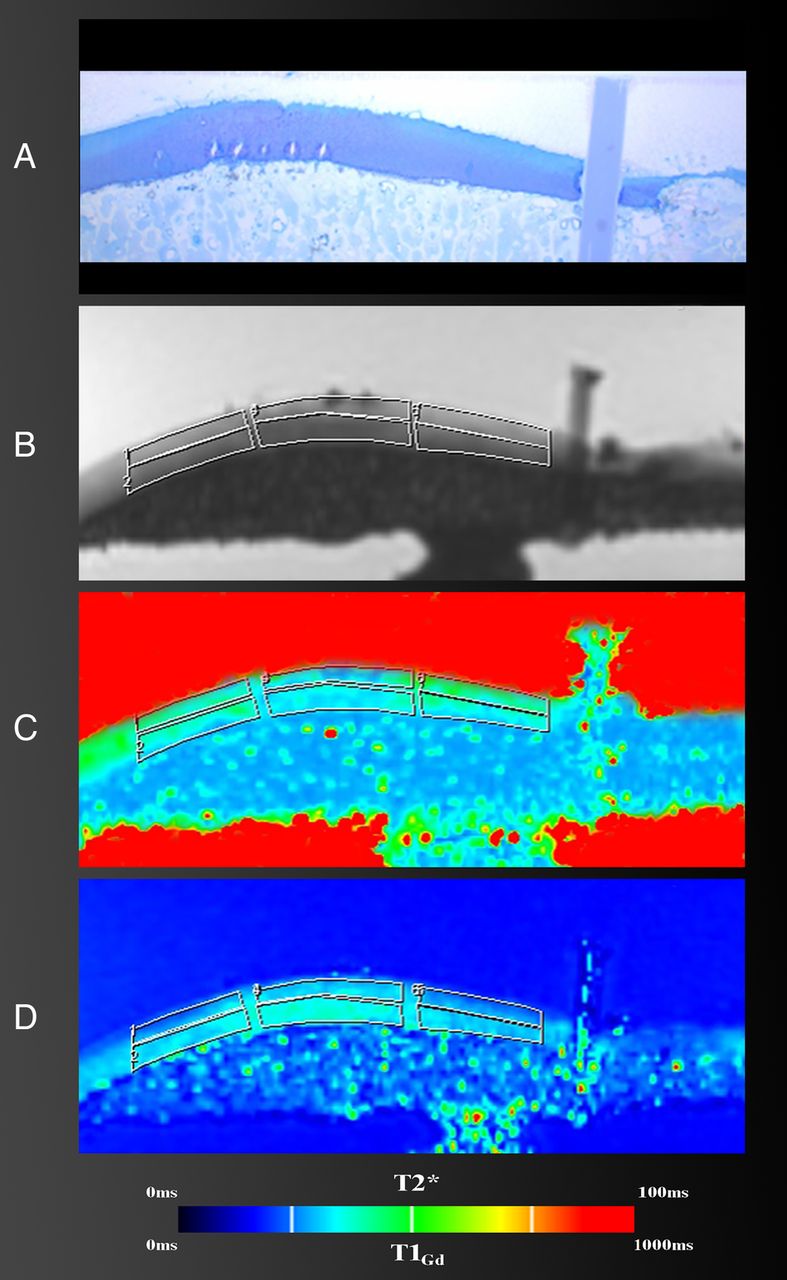
Each reformat was subdivided into three similar regions (n=465) in order to specify the exact location of the cartilage and minimise confounding. In each region, zonal (upper half=superficial zone, lower half=deep zone) and full-thickness T2* and T1Gd values (mean value derived from the zonal measures) were obtained by ROI analysis in which the corresponding DESS image served as a reference for accurate placement of the ROI squares within the cartilage (figure 1). The ROI area was created by multiple marker points that facilitated precise ROI placement even in an asymmetrical damaged cartilage, in order to stay within cartilage bounds.

Region of interest (ROI) analysis in a corresponding histological cut (A), double-echo steady-state (DESS) MRI (B), T2* map (C) and T1Gd map (D) in three regions. The DESS image served as a reference for the placement of the ROI fields within the cartilage in which the ROI area was created by multiple marker points that facilitated precise ROI placement even in an asymmetrically damaged cartilage in order to stay within cartilage bounds.
During histological cartilage status assessment, all regions were graded according to the Mankin system37 that evaluates surface morphology (smooth intact surface to total disorganisation, 0–6 points), cellularity (uniform cell distribution to cell loss, 0–3 points), toluidine blue staining (uniform staining to total discolouration, 0–4 points) and tidemark integrity (intact vs vascular, 0–1 points). A score of 0 implies normal cartilage, whereas the maximum total score of 14 represents the most severe cartilage degeneration. According to the Mankin score, each region was further assigned one of four grades of histological changes: grade 0 (Mankin score: 0–4), grade I (Mankin score: 5–8), grade II (Mankin score: 9–10) and grade III (Mankin score: 11–14).38
Of note, regions of advanced cartilage loss that could not be mapped (n=62), regions with poor MRI quality that compromised image analysis (n=51), and artefacts or features in the histological sections (n=72) that interfered with a reliable cartilage examination were excluded from further analysis.
Statistical analyses
SPSS software (IBM SPSS Statistics for Windows, V.21.0; IBM Corp, Armonk, New York, USA) was used for the statistical analyses. Mean T2* and T1Gd values± SD, value range and 95% CIs were measured in various histological grades of cartilage degeneration. As the normality assumption was questionable in portions of the data, the Kruskal-Wallis non-parametric analysis of variance (ANOVA) was applied in order to identify any statistically significant differences between the mean T2* and T1Gd values of each Mankin grade of cartilage degeneration. Here, the Mankin grades were treated as fixed parameters (independent variable), whereas the T2* and T1Gd values were treated as dependent variables. Post hoc comparisons for the Kruskal-Wallis test were performed in order to assess which pairs of histological cartilage grades differed significantly in terms of the T2* and T1Gd values. The non-parametric Spearman's rank correlation test was used to analyse the correlation between the MRI mapping values, the total Mankin score and the modified Mankin grade of cartilage degeneration. The Mankin grading, which is observer dependent, was repeated by the same observer (interval between the two measurements=4 weeks or longer) and a second observer in 10 randomly selected specimens to determine the reliability of the histological grading. Intraobserver and interobserver agreement was evaluated by intraclass correlation (ICC) testing (pairwise correlation, absolute agreement). The statistical significance level in this study was 5% (p values of<0.05).
Results
A total of 622 ROIs (311 regions, two zones per region) were analysed. The mean size of these ROIs was 0.08±0.03 cm2 (147±54 pixels) ranging from 0.02 cm2 (43 pixels) to 0.20 cm2 (147 pixels). Of the 311 cartilage regions, 178 (57.2%) were classified as Mankin grade 0, 122 (39.2%) as Mankin grade 1, seven (2.3%) as Mankin grade 2 and four (1.3%) as Mankin grade 3. Of note, due to the small number of cases revealing grade 2 or grade 3 changes, we modified the Mankin grading by merging Mankin grade 2 and Mankin grade 3 regions into a single group (modified Mankin grade 2/3).
In this analysis, the mean T2* values decreased with increasing cartilage degeneration (p<0.001) in which the T2* drop ranged from 35.3±7.3 ms (Mankin grade 0) to 23.0±2.3 ms (modified Mankin grade 2/3; figure 2). The observations with the T1Gd measurements were similar, demonstrating a significant (p<0.001) T1Gd decrease ranging from 552.1±79.6 ms in Mankin grade 0 regions to 373.0±54.7 ms in modified Mankin grade 2/3 regions (figure 3 and table 2). Spearman's rank correlation analysis confirmed a moderate correlation (p values <0.001) between both MRI mapping values (T2* and T1Gd), the total Mankin score (0.467 and 0.607) and the modified Mankin grade (0.514 and 0.556). Furthermore, both techniques revealed differences between the superior and inferior cartilage zones, demonstrating higher T2* values in the superficial cartilage zone (37.8±9.2 ms vs 26.6±7.3 ms, p<0.001) and higher T1Gd values in the deep cartilage zone (576.2±101.5 ms vs 442.3±102.4 ms, p<0.001). This characteristic pattern was unaffected by the grade of cartilage degeneration. However, the decrease in T2* between the grade 1 and grade 2/3 cartilage was not as steep in the deep cartilage zone and did not reveal a statistically significant level of difference (p=0.223). Similar observations were made for the T1Gd pattern in the superficial cartilage zone, where the T1Gd decline between grade 1 and grade 2/3 cartilage regions slowed as well (p=0.223) (figure 3). ICC analysis confirmed substantial intraobserver and interobserver agreement for the Mankin grading (ICC values: 0.656 and 0.682, p<0.001).
Mean value, SD, value range and 95% CI in various histological grades of cartilage degeneration

Box plot diagram and a pairwise comparison chart illustrating the significant drop in T2* and T1Gd relative to the grade of cartilage degeneration.

Zonal T2* and T1Gd distribution in various grades of cartilage degeneration. Higher T2* values were noted in the superficial zone regardless of the grade of cartilage degeneration. In contrast, higher T1Gd values were noted in the deep zone. The decrease in T2* between grade 1 and grade 2/3 cartilage was not as steep in the deep cartilage zone and did not reveal a statistically significant difference level (p=0.223). In comparison, the decrease in T1Gd between grade 1 and grade 2/3 cartilage was not as steep in the superficial cartilage zone and did not reveal a statistically significant difference (p=0.083) in this particular zone. ** p<0.001. The error bars represent one SE.
Discussion
The goal of this study was to evaluate the validity of GRE-based T2* and T1Gd mapping for the assessment of knee joint cartilage degeneration while correlating this technique with histological analysis. Therefore, we conducted a histologically controlled in vitro study including human femoral lateral condyle specimens with various grades of cartilage degeneration and isotropic high-resolution MRI, which enabled us to correlate MRI data and histology slice by slice, providing a statistically sufficient data set for comparison and validation. In this analysis, we observed a significant decrease in the T2* and T1Gd values with increasing grades of cartilage degeneration (p<0.001) and a moderate correlation between T2* (r=0.514)/T1Gd mapping (r=0.556) and the histological grading of cartilage degeneration (p<0.001) (figure 4). In addition, we noted a zonal variation in the T2* and T1Gd values that reflects the characteristic zonal differences in collagen fibre orientation and biochemical composition of hyaline cartilage.39 ,40 These findings point towards the validity of these techniques.

Corresponding histological cut (A), double-echo steady-state (DESS) MRI (B), T2* map (C) and T1Gd map (D). Note the severity of the changes in the right portion of the histological cut that is clearly depicted in the T2* and T1Gd maps, whereas only moderate changes are demonstrated on the DESS image.
Our study has limitations. Although the Ethipins and morphological landmarks served as guidance for matching the histological cutting plane by means of MPR, it is possible that the histological and corresponding MRI regions may have been marginally different. This is related to a potential mismatch in plane orientation and disproportion in image resolution (MRI slice thickness of 0.2 mm vs a histological section thickness of ∼50 µm). Polarised light microscopy and quantitative type-II collagen content assessment for further comparison were not performed in this study. As a result, subtle changes in the collagen matrix could have been missed. Minor but clearly visible cartilage changes were underestimated by obtaining mean mapping values in predefined ROIs. This may be tolerable for visualisation purposes. However, in terms of the cartilage T2* and T1Gd quantification, this averaged spatial measurement is substantially relevant in regions where the cartilage damage is confined to a rather small area. Efficient ways to minimise this erroneous measurement are implementing a flexible correlation system (eg, by defining individual cartilage areas with different histologically proven grades of degeneration for correlation instead of using a constrained grid system) or (simply) decreasing the size of the ROI. The T2* and dual-FA VIBE techniques lack the 180° refocusing pulse, making them prone to susceptibility artefacts. For that reason, foreign body particles such as postsurgical debris or the Ethipins may have influenced the T2* and T1Gd values. Furthermore, this was an in vitro study where the acquisition time is relatively negligible. Observations under in vivo conditions, most likely with lower image resolution, may differ from those made in this study. As such, the reliability of gradient-echo T2* and T1Gd mapping needs further evaluation under clinical conditions with reasonable acquisition times and image resolution. In addition, although we merged Mankin grade 2 and grade 3, it has to be stated that even this merged grade was under-represented in this study (11 of 311 regions). Finally, although histological evaluation revealed regions with a normal appearing cartilage, as all specimens were collected from patients undergoing arthroplasty with likely cartilage damage in various stages, this study sample may not be representative on a one-to-one basis of a population with normal cartilage.
The reliability of GRE-based T2* and T1Gd mapping has been previously studied in assessing femoral head cartilage explants using histology as a reference.30 ,33 Both T2* and T1Gd mapping correlated with histology, demonstrating lower mapping values in degenerated cartilage. However, the image resolution in those studies was too low to warrant reliable zonal T2* and T1Gd determinations, because of the fairly thin femoral head cartilage layer. The high isotropic resolution in this study and the relatively thick cartilage of the lateral femoral condyle specimens allowed us to perform a zonal T2*and T1Gd assessment within articular cartilage in order to recognise variations in the zonal anatomy of articular cartilage in various stages of cartilage degeneration. In the present study, it was apparent that the T2* and T1Gd drops differed between the superficial and the deep zone, revealing a less pronounced decrease in T2* values in the deep zone and in T1Gd values in the superior zone in more advanced cartilage degeneration. Although it is speculative, the zonal variance in these mapping values most likely indicates the multifaceted nature of compositional and structural changes in osteoarthritic cartilage, wherein multiple phases and degenerative alterations can coexist in different cartilage zones at a given time. Williams et al41 have studied the sensitivity of T2 mapping and ultra-short echo time (UTE, TE range: 0.5–40 ms) T2* mapping to collagen matrix degeneration using cartilage composition measurement, histological analysis and polarised light microscopy for comparison. In their study, 33 osteochondral cores obtained from four human tibial plateau explants were evaluated. The T2* values decreased with cartilage matrix degeneration (p=0.008). In contrast, the T2 values, which tended to be higher in severely degraded cartilage, did not vary with various grades of matrix degeneration (p=0.13). Furthermore, the T2* values did not correlate with the type-II collagen content, signifying the sensitivity of T2* mapping to collagen architecture rather than to collagen content. Nevertheless, these observations are based on a small study sample; further investigation is required to confirm these results. Kim et al42 reported the relationship between T2, T2* and histology in nine human lateral tibial condyle specimens collected from eight patients who underwent total knee arthroplasty. The image resolution was ∼0.4×0.4×2.0 mm for the T2 mapping technique and ∼0.4×0.4×3.0 mm for the T2* mapping technique. For histological analysis, mid-sagittal sections with a slice thickness of 4 µm through the middle of the lateral tibial condyle (intended to match the T2 and T2* sections) were created. Subsequent histology assessment comprised polarised light microscopy and was performed on the basis of the David-Vaudey criteria.43 Eventually, 94 full-thickness cartilage ROIs could be correlated (T2 vs histology) whereas, with regard to the T2* maps, 30 ROIs were excluded due to image artefacts leaving 64 ROIs for comparison (T2* vs T2 and T2* vs histology, respectively). Key findings were the T2 values correlated weakly with the histological grade of degeneration (r=0.313, p<0.05) and the T2* values (r=−0.322, p<0.05), while the T2* mapping and histological evaluation did not correlate (r=−0.192, p=0.129). Kim et al's42 study is somewhat similar and somewhat varied in terms of methods and results to our study. Furthermore, their study had some limitations including the small study sample, significant differences in study size and MRI quality issues that may have compromised the T2/T2* assessment of the thin cartilage layer of the tibial plateau. SDs >50%, as well as fairly low T2* values (20.3±10.3 ms) in a histologically normal appearing cartilage, most likely point towards this explanation. Furthermore, although great effort was made to match the MRI with the mid-sagittal histological cuts using intraoperative information, edge-distance measurements, small surgical marking and morphological features, it appears that there were some subtle and inadvertent mismatches between the two. The unique feature of this study is the high-resolution isotropic 3D mapping that allowed us to generate MRI reformats (using the Ethipins for a uniform orientation) that correlated with the histological sections in order to compare corresponding MRI maps and histological images slice by slice. As a result, a statistically sufficient data set of corresponding regions could be assessed and correlated for validation purposes. In terms of T1Gd mapping for dGEMRIC analysis, there are only a few other validation studies comparing two-dimensional spin-echo T1Gd mapping techniques with histology. Bashir et al44 demonstrated a strong correlation between T1Gd and the GAG content. They also noted that spatial distributions of GAG were well reflected in T1Gd-weighted and T1-calculated MRI studies of intact human joints, with good histological correlation, and that in vivo T1Gd images taken before total knee arthroplasty were comparable to the corresponding in vitro MRI, indicating the feasibility of monitoring the GAG distribution in vivo. In a study sample of eight osteochondral specimens collected from three patients who underwent total knee arthroplasty, Trattnig et al45 noted that regions with lower T1Gd corresponded to areas with depleted proteoglycans observed histologically. Watanabe et al46 demonstrated the ability of dGEMRIC to evaluate the quality of repair tissue after microfracture. In this study that included 12 knees from 12 goats, dGEMRIC findings correlated with histological and biochemical assessments.
In this histologically controlled in vitro study including human femoral lateral condyle specimens with various grades of cartilage degeneration, we were able to outline the potential of GRE-based T2* and T1Gd mapping to identify various grades of cartilage damage. Considering the advantages of GRE-based T2* and T1Gd mapping with high-image resolution and the ability to perform 3D biochemically sensitive imaging, we believe that these imaging techniques can make an important contribution to the currently evolving practice of cartilage biochemical imaging and help in the decision-making of current joint preservation interventions. Further studies that comprise a larger study sample, quantitative type-II collagen and GAG content assessment for further comparison and observations under in vivo conditions with reasonable acquisition times and image resolution are warranted to confirm our results.
References
Footnotes
-
Contributors BB was involved in study design, data collection and the drafting of the article. HSH contributed to the study conception and data interpretation. FRM provided substantial contributions to study conception, data analysis and interpretation. JS was involved in data collection and data analysis. DPK and MH contributed substantially to the acquisition and interpretation of data. RK and GA were involved in study conception and interpretation of data. CZ contributed to the study design and the acquisition of data. All authors revised the article critically and approved the final submitted version.
-
Funding This study was funded by a research grant from the ‘German Research Foundation’ (Deutsche Forschungsgemeinschaft), grant number: ZI: 1319/1-1.
-
Competing interests None.
-
Patient consent Obtained.
-
Ethics approval The local ethics committee approval was obtained prior to the study. All participants gave informed consent before taking part.
-
Provenance and peer review Not commissioned; externally peer reviewed.
-
Data sharing statement No additional data are available.