Article Text

Abstract
Objectives To develop a nomogram for estimating the glycated haemoglobin (HbA1c) response to different dipeptidyl peptidase-4 (DPP-4) inhibitors in type 2 diabetes.
Design A systematic review and meta-analysis of randomised controlled trials (RCTs) of DPP-4 inhibitors (vildagliptin, sitagliptin, saxagliptin, linagliptin and alogliptin) on HbA1c were conducted. Electronic searches were carried out up to December 2013. Trials were included if they were carried out on participants with type 2 diabetes, lasted at least 12 weeks, included at least 30 participants and had a final assessment of HbA1c. A random effect model was used to pool data. A nomogram was used to represent results of the metaregression model.
Participants Adults with type 2 diabetes.
Interventions Any DPP-4 inhibitor (vildagliptin, sitagliptin, saxagliptin, linagliptin or alogliptin).
Outcome measures The HbA1c response to each DPP-4 inhibitor within 1 year of therapy.
Results We screened 928 citations and reviewed 98 articles reporting 98 RCTs with 100 arms in 24 163 participants. There were 26 arms with vildagliptin, 37 with sitagliptin, 13 with saxagliptin, 13 with linagliptin and 11 with alogliptin. For all 100 arms, the mean baseline HbA1c value was 8.05% (64 mmol/mol); the decrease of HbA1c from baseline was −0.77% (95% CI −0.82 to −0.72%), with high heterogeneity (I2=96%). Multivariable metaregression model that included baseline HbA1c, type of DPP-4 inhibitor and fasting glucose explained 58% of variance between studies, with no significant interaction between them. Other factors, including age, previous diabetes drugs and duration of treatment added low predictive power (<1%). The nomogram estimates the absolute HbA1c reduction from baseline using the type of DPP-4 inhibitor, baseline values of HbA1c and fasting glucose.
Conclusions Baseline HbA1c level and fasting glucose explain most of the variance in HbA1c change in response to DPP-4 inhibitors: each increase of 1.0% units HbA1c provides a 0.4–0.5% units greater fall.
- THERAPEUTICS
This is an Open Access article distributed in accordance with the Creative Commons Attribution Non Commercial (CC BY-NC 4.0) license, which permits others to distribute, remix, adapt, build upon this work non-commercially, and license their derivative works on different terms, provided the original work is properly cited and the use is non-commercial. See: http://creativecommons.org/licenses/by-nc/4.0/
Statistics from Altmetric.com
Strengths and limitations of this study
-
It is the first attempt to develop a nomogram for estimating the glycated haemoglobin (HbA1c) response to different dipeptidyl peptidase-4 (DPP-4) inhibitors in type 2 diabetes.
-
The statistical power of our attempt to develop a nomogram is supported by a high number of arms (100) and participants (24 163), and by 58% of explained variance between studies.
-
There is high heterogeneity in primary analysis and sensitivity or subgroup analyses.
-
Baseline HbA1c and fasting glucose levels are the only important predictors of HbA1c response to individual DPP-4 inhibitors in type 2 diabetes.
Introduction
Most diabetes management algorithms1–4 recommend a glycated haemoglobin (HbA1c) target of <6.5–7.0% for the majority of people with diabetes, if safely achievable. Accordingly, adjustment of diabetes therapy should be based on the HbA1c level and a change in therapy is recommended when HbA1c is above the target: intensification of therapy is usually recommended when HbA1c is above 7%. There is general agreement on the first line use of metformin in most patients with type 2 diabetes; the choice of the agent, among the panoply of oral glucose-lowering drugs, to be combined with metformin after metformin failure is still an area of uncertainty.5 A number of randomised controlled trials (RCTs) provided evidence of improved glycaemic control with the family of the dipeptidyl peptidase-4 (DPP-4) inhibitors, with modest risk of hypoglycaemia, and no weight gain.6 In a descriptive, cross-sectional analysis of data using the IMS Health National Disease and Therapeutic Index in the USA, Turner et al7 reported that use of DPP-4 inhibitors increased steadily since 2005, representing 21% of ambulatory diabetes treatment visits by 2012.
It is generally agreed that individualising therapies can help in achieving blood glucose level targets in people with type 2 diabetes.8 ,9 Although RCTs are the most reliable methods of determining the effects of treatment, to be clinically useful, their result must also be relevant to definable groups of patients in a particular clinical setting in routine practice (generalisability).10 The inherent difficulty of applying trial data to individual patients reflects common clinician concerns about subgroups, meta-analyses and risk.11 While awaiting the results of pragmatic interventional trials with the specified aim to provide guidance to clinicians about the most appropriate medications to treat type 2 diabetes,12 clinicians may find help on prediction models derived from appropriate analyses of RCTs. Recent evidence supports the concordance in predictors of HbA1c response to glucose-lowering drugs (insulin or DPP-4 inhibitors) between data derived from RCTs and those emerging in routine clinical care around the world.13–15 While previous studies tried to identify clinical or biochemical baseline characteristics that predicted the HbA1c response to DPP-4 inhibitors as a class,16 ,17 predictors of the HbA1c response to individual DPP-4 inhibitors have never been systematically evaluated.
The aim of the present study was to develop a nomogram for estimating the HbA1c response to different DPP-4 inhibitors in type 2 diabetes. In order to attenuate the risk of ecological fallacy, that is, the impulse to apply group level characteristics onto individuals within that group,18 we included all published arms of RCTs that met predefined criteria.
Methods
This study of systematic review and meta-analysis is in compliance with the guideline PRISMA (Preferred Reporting Items for Systematic reviews and Meta-Analyses).19 We carried out this systematic review in accordance with the study protocol (see online supplementary appendix 1)
Search strategy
Bibliographical databases for literature search included MEDLINE (via PubMed), EMBASE (via OVID), Cochrane Library, Google Scholar and ClinicalTrials.gov (http://www.clinicaltrials.gov). The initial search was performed on 1 July 2013 and was last updated on 31 December 2013. Our search strategy included keywords ‘DPP-4 inhibitors’, ‘vildagliptin’, ‘sitagliptin’, ‘saxagliptin’, ‘linagliptin’, ‘alogliptin’ and ‘type 2 diabetes’. We searched all fields in PubMed, all text in Cochrane Library, but restricted to the fields of abstracts, titles and keywords in EMBASE. Google search was conducted to find the RCT information unavailable from bibliographical databases. In addition, manual search of journals was conducted in personal reference lists of recovered articles to track relevant RCTs that were not indexed by normal keywords.
Inclusion and exclusion criteria
The identified studies were selected according to the following inclusion and exclusion criteria.
Study design
Only RCTs were included. Observational, cohort, case–control, case series and laboratory studies were excluded. Studies published ahead of print at 31 December 2013 were also included.
Durations
For observing changes in HbA1c levels, only the RCTs with follow-up durations longer than 12 weeks were included. As the relation between the HbA1c decrease in response to DPP-4 inhibitors and time is quite linear until 52–54 weeks,17 for longer RCTs we used the difference between HbA1c value at 52 weeks and baseline.
Participants
Only the RCTs on adult, non-pregnant participants aged 18 and older with type 2 diabetes were included, with at least 30 participants in each arm of the trial.
Interventions
This meta-analysis included any arm of RCTs on the efficacy of DPP-4 inhibitors in participants who were either drug naïve, or on background therapy with metformin or other oral agents.
Comparators
This meta-analysis included the RCTs employing placebo or any comparator drug. We excluded RCTs employing initiation of two agents at the same time, or those applied to a subset of patients (ie, those with renal failure).
Outcome
This meta-analysis included the RCTs measuring HbA1c as the outcome.
Trials were also excluded if: (A) they were extensions of previous RCTs, as extended trials are more likely to be biased, as those patients who had loss of glycaemic control were not enrolled in the extension part of the randomised trial; (B) the DPP-4 inhibitor was added to insulin because insulin, as the most powerful glucose-lowering agent, would have affected the construction of the nomogram; and (C) the doses of DPP-4 inhibitors were different from those recommended and approved in the clinical practice (sitagliptin, 100 mg once daily; vildagliptin, 50 mg twice daily; saxagliptin, 5 mg once daily; alogliptin, 25 mg once daily; linagliptin, 5 mg once daily).
Study selection and data extraction
Two investigators (DG and KE), through use of a standardised tool, independently abstracted all data with disagreements resolved by consensus. Any study arm of RCTs that met the inclusion/exclusion criteria was included in the analysis: any other arm of the same RCTs that assessed placebo or a comparator drug was excluded. So, we only included study arms of RCTs investigating the effects of DPP-4 inhibitors on HbA1c. The following information was sought from each trial arm: (A) author identification; (B) year of publication; (C) number of patients in the arm and study design; (D) type of DPP-4 inhibitor and duration of follow-up; (E) type of comparator drug; (F) drug, if any, to which the DPP-4 inhibitors were added; (G) baseline characteristics (age, HbA1c, fasting glucose); and (H) type of statistical analysis for the outcome. We attempted to contact study authors for additional information when necessary. The relevance of studies was assessed with a hierarchical approach on the basis of title, abstract and the full manuscript. After the initial screening of titles and abstracts, the studies included by both reviewers were compared; disagreement was resolved by consensus.
Quality assessment
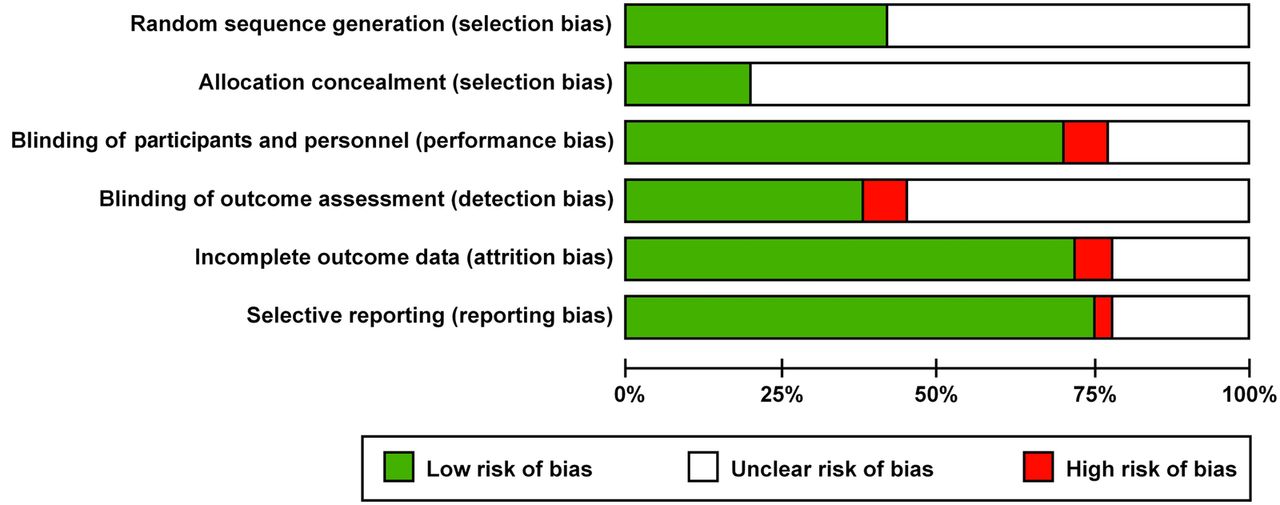
We assessed the design, execution and reporting of the included RCTs according to the Cochrane risk of bias tool.20 We assessed risk of bias in random sequence generation and allocation concealment (selection bias), blinding of participants and personnel (performance bias), blinding of outcome assessment (detection bias), incomplete outcome data (attrition bias) and selective reporting (reporting bias). The risk of bias was deemed high, low or unclear. The quality of each RCT was assessed by one reviewer and verified by another reviewer. Disagreement was resolved by discussion. The evidential level of the outcome was determined in accordance with the Grading of Recommendations Assessment, Development and Evaluation (GRADE) system21 and conducted with GRADE profiler V.3.2 (http://tech.cochrane.org/revman/gradepro).
Data analysis
The decrease of HbA1c from baseline at the end of treatment, or at 52–54 weeks for RCTs of longer duration, was the primary outcome. From each study, mean decrease of HbA1c and its SE was calculated. Heterogeneity was assessed by using Q statistic and I,2 ,22 which is the proportion of total variance observed between the trials attributed to the differences between trials rather than to sampling error. I2<25% was considered as low in heterogeneity and I2>75% was of high heterogeneity. If overall heterogeneity was significant, a random-effect model was used. The influence of a single study on the overall meta-analysis estimate was investigated through the ‘metainf’ command in Stata. Metaregression was applied to estimate the amount of heterogeneity explained through the ‘metareg’ command in Stata. Metaregression is a regression model that relates the treatment effect to study-level covariates, while assuming additivity of within-study and between-studies components of variance.23 Covariates included in the model were mean baseline HbA1c value as continuous variable, type of DPP-4 inhibitor (five categories: vildagliptin, sitagliptin, saxagliptin, linagliptin and alogliptin) and mean baseline fasting glucose value as continuous variable. Additional effects of other available covariates added one by one to the previous model were also tested: these covariates included mean age of patients, duration of treatment (three categories: 12–18, 24–30 and 52–54 weeks), previous treatment (two categories: naïve/none, any treatment except insulin to which the DPP-4 inhibitor was added on), trial arm sample size and the statistical evaluation of results in the RCTs (two categories: intention-to-treat and per protocol). Categorical variables were included in the model by means of dummy variables. The moderators were chosen consistently with previous findings,17 using the criteria of the availability and within moderators with known effect on the absolute HbA1c reduction from baseline. Restricted maximum likelihood estimators were used to estimate model parameters. Permutation test (using 1000 reallocations) was used for assessing the true statistical significance of an observed metaregression finding.24 How much the metaregression model explained heterogeneity of the effect among studies was quantified by the percentage reduction of between-studies variability.23 ,25 Plot of residuals was used to check the adequacy of the metaregression model overall and within type of DPP-4 inhibitor. The distribution of residuals was examined by histograms for standardised residuals and by normal probability plots. A sensitivity analysis was performed to assess the consistency and robustness of results of the metaregression model excluding in turn the arms of one of the DPP-4 inhibitor categories. Predicted values and SE of prediction were calculated. A nomogram was used to represent results of the metaregression model, estimating decrease of HbA1c from baseline starting from considered covariates. In developing the nomogram, we used model coefficients to assign points to characteristics and predictions from the model to map cumulative point totals. In table 1, mean baseline HbA1c and mean baseline fasting glucose were categorised only for descriptive purposes. Data were analysed using Stata, V.11.2 (Stata Corp, College Station, Texas, USA) and nomogram was plotted using R V.3.0.1 (R Foundation for Statistical Computing, Vienna, Austria). All statistical tests were two-sided and p values <0.05 were regarded as significant.
Studies included in the analysis
Results
A total of 938 citations were assessed in the initial searching, of which 810 were identified via bibliographical databases and 128 were identified by supplementary search via Google and Google Scholar (figure 1). By screening the abstracts, we excluded 235 non-RCTs, and 27 pharmacokinetics and pharmacodynamics studies. Of the remaining 200 RCTs, 102 RCTs did not meet the inclusion criteria on interventions and comparators. Finally, a total of 98 RCTs, with 100 arms, were included for quantitative synthesis and meta-analysis.

Flow diagram of study selection (RCT, randomised controlled trial).
Duration and settings
The characteristics of the included 98 RCTs (see online supplementary references 1–98) are summarised in table 1. The participants in all RCTs were patients with type 2 diabetes (≥18 years old). The outcome measuring the effects of DPP-4 inhibitors was HbA1c (%). The data extracted from the included RCTs for meta-analysis were sample sizes and HbA1c change from baseline. Most trials were multinational and sponsored by industry. The trials were published between 2005 and 2014, with 16 studies published in 2012, 17 studies in 2013 and 2 studies in 2014, but delivered as epub ahead of print in December 2013. All trials were of parallel group; 88 trials were of double-blind design, and the remaining 10 were of open-label design.
Intervention
The trials evaluated 24 163 patients for the primary endpoint. In 31 trials, the patients were either drug naïve or discontinued any previous drug prior to randomisation; most background diabetes treatment included one (mostly metformin) or more oral drugs. The characteristics of trial participants were: mean age range 50–74.9 years, trial duration range 12–54 weeks, mean baseline HbA1c range 7.2–9.3% and mean baseline fasting glucose level 170 mg/dL.
Risk of bias
According to the Cochrane risk of bias tool, the two common biases (unclear risk of bias) were selection bias (lack of specification of allocation concealment) and detection bias (lack of specification about blinding of outcome assessment; figure 2 and supplementary table 1). The average quality of the RCTs was acceptable. The GRADE evaluation indicated that the outcome of HbA1c had moderate-to-high quality of the evidence.
Primary outcome
There were 26 arms with vildagliptin and 8578 patients, 37 arms with sitagliptin and 7716 patients, 13 arms with saxagliptin and 2439 patients, 13 arms with linagliptin and 3637 patients, and 11 arms with alogliptin and 1793 patients. For all 100 arms, the mean baseline HbA1c value (weighted by sample size) was 8.05% (64 mmol/mol); the decrease of HbA1c from baseline was −0.77% (95% CI −0.82 to −0.72%), with high heterogeneity (I2=96%, Q test p<0.0001; table 2). The overall estimates changed very little when any single study was omitted, without individual study that have excessive influence on the pooled effect. Also shown in table 2 are the decrements of HbA1c level according to length of RCTs, type of DPP-4 inhibitors, baseline HbA1c level and baseline fasting glucose: the absolute mean decrement of HbA1c from baseline ranged from −0.55% with linagliptin to −0.88% with vildagliptin; however, the lack of head-to-head trials did not allow a direct comparison for significance.
Metaregression model
The multivariable metaregression model that included baseline HbA1c, type of DPP-4 inhibitor and baseline fasting glucose, explained 58% of overall variance between studies (table 2). A statistical significant effect was found for each covariate and the joint test for all covariates was highly significant (p<0.0001). The residual between-study variance of the metaregression model was 0.024, with a significant residual heterogeneity (p<0.001). No significant interaction was found between these three significant predictors. No additional effect of mean baseline age, previous diabetes treatment that the DPP-4 inhibitor was added to, statistical evaluation of the trial (per protocol or intention-to-treat) and duration of treatment was found, with no significant coefficients or increase of variance explained by the model (<1%). A modest additional effect of trial arm sample size was found with no significant coefficient and with 2% increase of variance explained by the model. Median SE of predicted values of HbA1c reduction was 0.04% (range 0.02–0.09%). Plot of residuals revealed an acceptable adequacy of the final model, as 90% of the overall differences between observed and estimated values of HbA1c reduction were within the range −0.3% to 0.3%. Similar results were obtained in the analysis of residuals by type of DPP-4 inhibitor. The distribution of the residual satisfies the normality assumptions.

Cochrane risk of bias (graph).
Effects of DPP-4 inhibitors and covariates on HbA1c reduction from baseline (Δ)
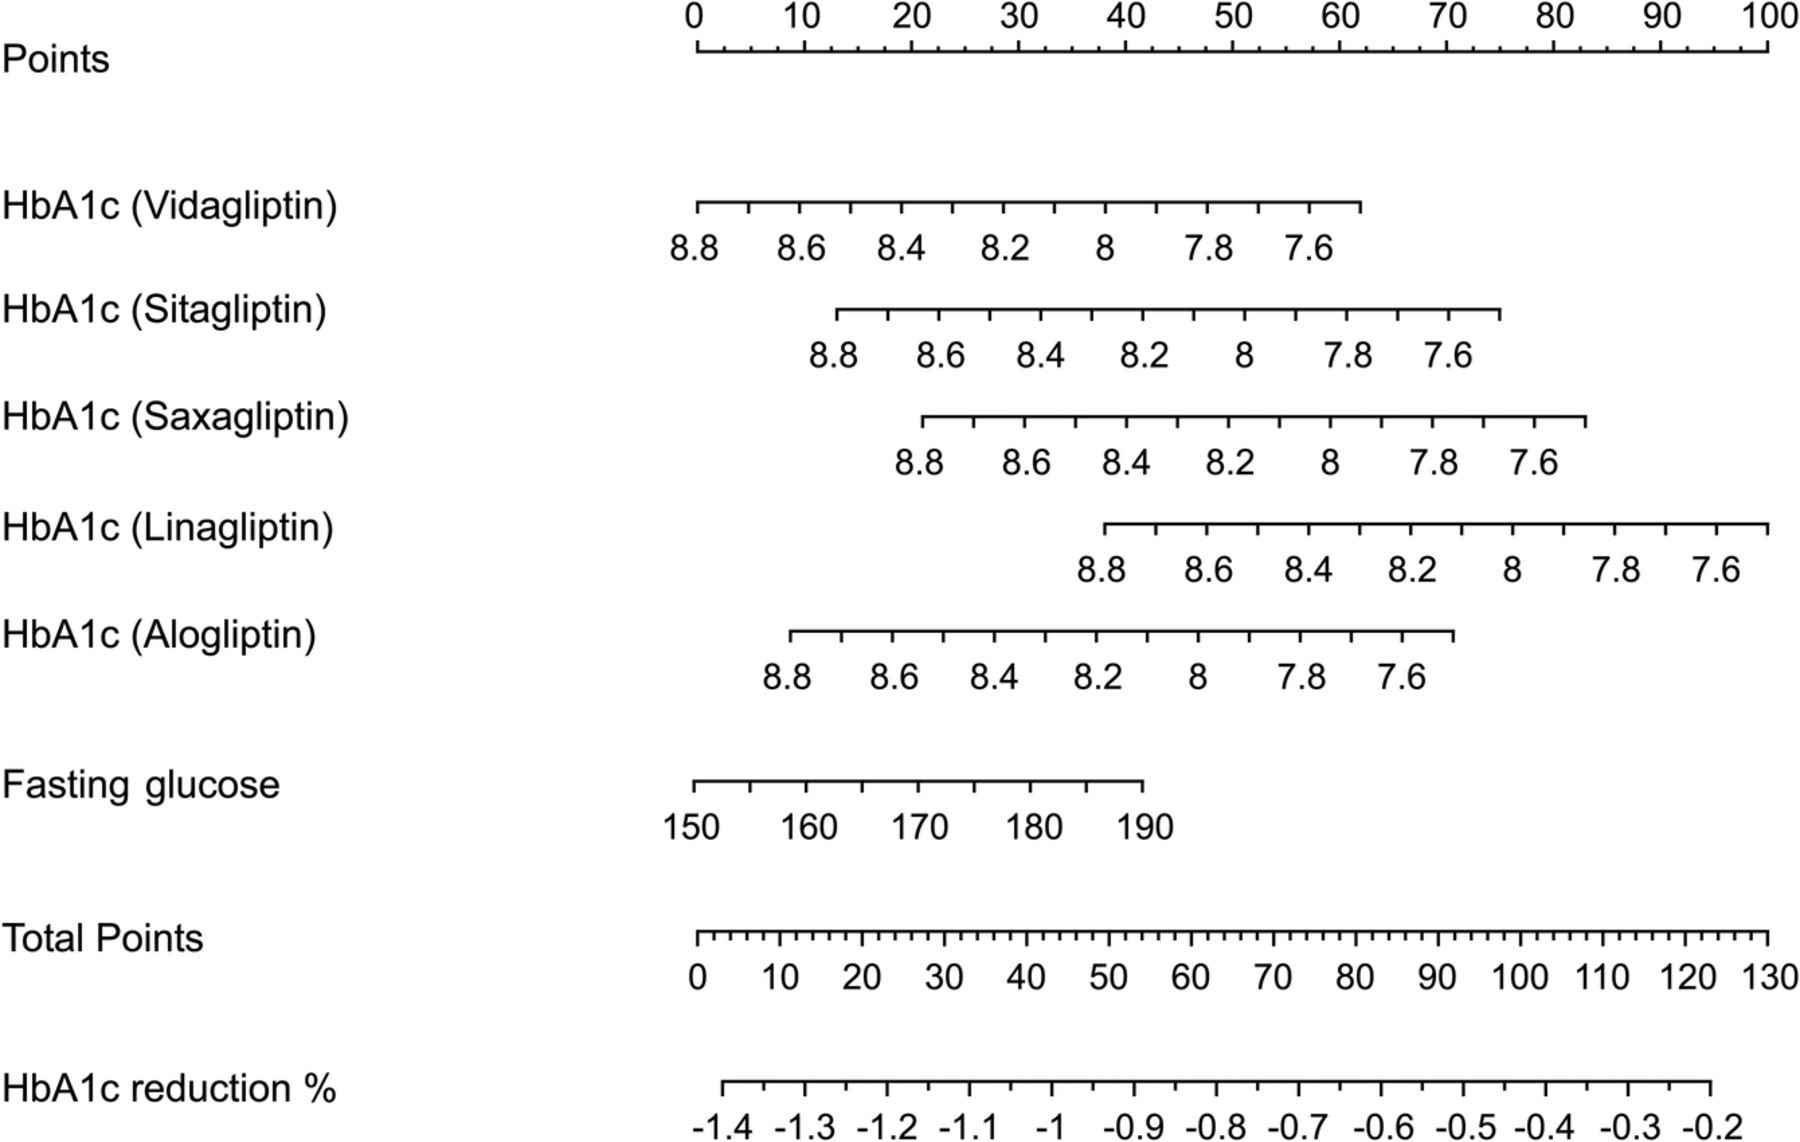
Sensitivity analysis excluding in turn each category of DPP-4 inhibitors showed similar results in term of variance explained and estimate of β-coefficients: specifically, variance explained by the model ranged between 52% excluding linagliptin arms (n=13), to 62% excluding sitagliptin arms (n=37). Results of the metaregression model were also graphically reported using a nomogram where the estimated absolute HbA1c reduction from baseline was calculated starting from the type of DPP-4 inhibitor category, baseline values of HbA1c and fasting glucose (figure 3). For example, at a baseline HbA1c level of 8%, the estimated reduction of HbA1c during treatment with vildagliptin is −1.05% at a fasting glucose level of 150 mg/dL and −0.77% at a fasting glucose level of 180 mg/dL. For sitagliptin, the same figures were −0.93% and −0.64%, respectively.

Nomogram to estimate the glycated haemoglobin (HbA1c) reduction from baseline after starting therapy with DPP-4 inhibitors. Choose the dipeptidyl peptidase-4 (DPP-4) inhibitor and the baseline HbA1c level; then, intercept perpendicularly the top horizontal line (points) and read the number; using the same method calculate the points for baseline fasting glucose. The sum of these two points, plotted on the ‘total points’ line, corresponds to the prediction of HbA1c reduction from baseline. Examples: A patient with a HbA1c value of 8% is suitable for treatment with vildagliptin; the intercept of 8% (starting HbA1c value of vildaglitpin line, second line) with the point line (first line) reads 38 points: this value (38 points) is translated to the total points line (8° line from the top) and corresponds to a HbA1c reduction of −1.05% as obtained with the perpendicular from 38 points (total points line) with the last line (HbA1c reduction). If the fasting glucose of the patient is 150 mg/dL, this adds nothing to the calculation as a value of 150 mg/dL in the fasting glucose line corresponds to 0 points of the first line. However, if the fasting glucose value reads 190 mg/dL, this will intercept (perpendicularly) the points line (first line) at 40 points, which summed up to the previous 38 points gives a total of 78 points. Again, this value (78 points) is translated to the total points line (8° line from the top) and corresponds to a HbA1c reduction of −0.65%. The same reasoning applies to another DPP-4 inhibitor: with saxagliptin, for example, the baseline HbA1c value of 8% reads 60 points (points line) and corresponds to a HbA1c reduction of −0.84% at a fasting glucose of 150 mg/dL (0 points more); in the case of fasting glucose of 190 mg/dL (40 points more), the corresponding value for HbA1c reduction will be −0.44%, as given from the intercept of 100 total points (60 points from saxagliptin and 40 points from fasting glucose) with the last line.
Discussion
Quantification of HbA1c change to any therapy remains an important task for clinicians and for patients in order to meet HbA1c goals. The large size (100 arms with 24 163 people) and the wide geographical distribution of the RCTs included in the present analysis should provide acceptable estimates of predictor factors of improvement in HbA1c level when starting therapy with DPP-4 inhibitors in type 2 diabetes. The strongest predictive factor was baseline HbA1c level, which explained 34% of the variance between studies, strengthening to more than half (58%) by addition of fasting glucose. However, fasting glucose can only improve the predictive value of baseline HbA1c, but has no role when taken alone in the absence of HbA1c. Other factors including mean age, previous oral treatment, length of follow-up (up to 54 weeks), as well as the statistical evaluation of results, had no predictive role. We were able to construct a nomogram for estimating the HbA1c decrease from baseline for each DPP-4 inhibitor, based on the starting HbA1c level and further refined by the addition of fasting glucose. This nomogram can help clinicians to predict the HbA1c response to each DPP-4 inhibitor in practice.
RCTs do not always reflect real-life outcomes, and real-life studies are deemed necessary to complement information retrieved with RCTs.26 One main concern of RCTs is the difficulty of applying trial data to individual patients. Ahrén et al15 pooled data from five RCTs evaluating 2788 patients with type 2 diabetes who were taking vildagliptin added to metformin, and compared them with real-life data obtained from an observational study examining vildagliptin (n=7002) added to metformin monotherapy. Assessing the entire data set (n=12 001), 36% of the variability in HbA1c response to vildagliptin was attributable to baseline HbA1c, while age, body mass index (BMI) and sex had little or no influence. For any given value of basal HbA1c level, the decrease of HbA1c observed with vildagliptin was the same in real life and RCTs: in patients with mean baseline HbA1c of 8.5% (69 mmol/mol), the adjusted mean HbA1c decrease in the vildagliptin treatment group was essentially the same in the real-life cohort (−1.1%; −12 mmol/mol) and RCTs (−1.2%; −13 mmol/mol). In our nomogram, the estimated HbA1c decrease in response to vildagliptin in patients with a mean baseline HbA1c of 8.5% was −1.27%, which can be further refined by adding the value of fasting glucose. So, the estimated decrease remains at −1.27% at a fasting glucose level of 150 mg/dL, but is reduced at −1.08% at a fasting glucose level of 170 mg/dL, and further to −0.9% at a fasting glucose value of 190 mg/dL.
The EDGE (Effectiveness of Diabetes control with vildaGliptin and vildagliptin/mEtformin) trial was a prospective, 1-year, worldwide, real-life observational study in which 2957 physicians reported on the effects of second-line oral drugs in 45 868 patients with type 2 diabetes not reaching glycaemic targets with monotherapy.27 This population comprised 28 061 patients receiving vildagliptin, and 15 294 receiving a comparator: final HbA1c change at 12 months was −1.19% in vildagliptin-treated patients. Again, the predicted decrease at 12 months from our model, considering a baseline HbA1c=8.2%, was −1.14%, clearly superimposable over what was observed in the EDGE study. In another observational, 2-year prospective cohort study conducted in France, at the request of local health authorities, patients with type 2 diabetic mellitus initiating vildagliptin or treated for <6 months were recruited through a national representative sample of general practitioners (n=482) and diabetologists (n=84) between March 2010 and December 2011.28 Of the 1700 patients included, vildagliptin treatment maintenance at 2 years was 88.8%; in everyday conditions of care, vildagliptin efficacy was in line with existing data from randomised clinical trials, sustained over 2 years, with low discontinuation rate and low hypoglycaemia risk. In a real-world analysis of administrative claims data from patients in the US, the predicted change in HbA1c from baseline equalled the results from head-to-head RCTs.29 In the 1576 patients treated with sitagliptin, the mean difference between their baseline A1c value (7.9%) and the value at 6 months postindex was 0.70%, somewhat smaller than the 0.85% decrease calculated from our model: the absence of any data on fasting blood glucose does not allow a more predictable estimate of the HbA1c response to sitagliptin.
In general, it seems reassuring that predictors of HbA1c response to DPP-4 inhibitors therapy derived from meta-analyses of published RCTs are similar to those emerging in routine clinical care around the world. Recent evidence also supports the concordance in predictors of HbA1c response to insulin between data derived from RCTs and those emerging in routine clinical care.13 ,14 Although many factors can guide clinicians in predicting the HbA1c response to therapy, many are of low predictive value and thus of poor utility. In the A1chieve study,13 a non-interventional, observational, 24-week study examining the effectiveness of some insulin analogues in routine clinical use in 66 726 people with type 2 diabetes, baseline BMI, low-density lipoprotein cholesterol level, microvascular complications and prestudy oral drug number were also statistically significant, but were of very low predictive power. The factor explaining most of the variance in HbA1c change was baseline HbA1c level, which accounted for approximately half or more of the improvement in HbA1c levels in univariate analysis, and around two-thirds in multivariate analysis. In the study of Ahrén et al,15 36% of the variability in HbA1c response to vildagliptin was attributable to baseline HbA1c, while other factors had little (sex) or no (age, BMI) influence. In our analysis, baseline HbA1c explained 34% of the variability in HbA1c response to DPP-4 inhibitors. So, with the exception of baseline HbA1c level, studies have failed to disclose other important predictors of HbA1c response to glucose-lowering therapies, at least for insulin and DPP-4 inhibitors.
Our study has its limitations. We included RCTs with a maximal duration of 52–54 weeks and the prediction of the HbA1c response to DPP-4 inhibitors cannot be extrapolated for further time. We limited the analysis to 1 year of treatment with DPP-4 inhibitors for two main reasons: the relation between time and efficacy is linear during the first year17; and based on long-term RCTs (up to 104 weeks), there seems to be a decline of efficacy starting from the second year of treatment.30 Another limitation relates to metaregression by itself, as it may be exposed to the risk of overall generalisability.18 However, observational studies and meta-analyses of RCTs both have inherent limitations,31 and it is important to understand the trade-off between internal and external validity: the lack of randomisation, the lack of a centralised laboratory, the lack of intensive monitoring—all characteristics applying to clinical practice—increase the generalisability and external validity of such studies, but at the expense of internal validity. Another limitation is that we used the absolute HbA1c reduction, not corrected by placebo effect; however, 56 RCTs out of 98 used a placebo arm, and in the real world the placebo effect lies within the prescription of the drug by the physician. Set against these limitations is the size of the study (100 arms included in the analysis), which allowed us to predict 58% of the overall variance in change in HbA1c levels; moreover, as discussed before, the HbA1c response to DPP-4 inhibitors seems the same in real life and in RCTs.15 ,27–29 Finally, the percentage change in HbA1c due to the placebo effect may range from −0.1% to 0.1%.32 The nomogram is not intended to give a comparison of different DPP-4 inhibitors, given the lack of head-to-head RCTs comparing their efficacy in HbA1c reduction from baseline. Moreover, the different DPP-4 inhibitors explained 12% of variance between studies. A significant residual between-study variance of the metaregression model was found, which needed further studies to investigate the high heterogeneity between studies observed.
In conclusion, when starting therapy with a DPP-4 inhibitor, the major determinant of change in HbA1c is baseline HbA1c level, further refined by the fasting glucose level; other factors had a very low power and do not contribute to the predictive model, suggesting that we are capturing most of the important influences. The nomogram we developed may help clinicians in predicting the HbA1c response to individual DPP-4 inhibitor in clinical practice.
References
Supplementary materials
Supplementary Data
This web only file has been produced by the BMJ Publishing Group from an electronic file supplied by the author(s) and has not been edited for content.
Files in this Data Supplement:
- Data supplement 1 - Online supplement
Footnotes
-
Contributors KE, PC and DG designed the protocol and the methods. PC and DG carried out the statistical analyses. All authors contributed to data extraction, drafting of the article and approved the final version of the manuscript.
-
Funding This study was funded in part with support from the Second University of Naples and the ‘Salute con Stile’ Association.
-
Competing interests KE and DG received consultancy fees, attended advisory boards or have held lectures for a number of pharmaceutical companies producing antidiabetic drugs.
-
Provenance and peer review Not commissioned; externally peer reviewed.
-
Data sharing statement No additional data are available.