Article Text

Abstract
Objectives We sought to estimate the proportion of adults in Sehore District, India, who consumed alcohol, and the proportion who had behaviours consistent with alcohol use disorders (AUDs), using the Alcohol Use Disorders Identification Test (AUDIT). Among men who drank, we identified individual-level, household-level and community-level factors associated with AUDIT scores. Men with AUDs (AUDIT score ≥8) reported on whether and where they had sought treatment, and about alcohol-related internal stigma.
Design Population-based cross-sectional study.
Setting Rural villages and urban wards in Sehore District, Madhya Pradesh, India.
Participants n=3220 adult (≥18 years of age) residents of Sehore District.
Primary outcome measure Score on the AUDIT.
Results Nearly one in four men (23.8%) had consumed alcohol in the past 12 months, while few (0.6%) women were consumers. Among drinkers, 33.2% (95% CI 28.6% to 38.1%) had AUDIT scores consistent with hazardous drinking, 3.3% (95% CI 2.1% to 5.1%) with harmful drinking and 5.5% (95% CI 3.8% to 8.0%) with dependent drinking. We observed that AUDIT scores varied widely by village (intraclass correlation=0.052). Among men who had recently consumed alcohol, AUDIT scores were positively associated with depression, having at least one child, high-quality housing, urban residence, tobacco use and disability. AUDIT scores were negatively associated with land ownership, out-of-pocket healthcare expenditure and participation in the national employment programme. While 49.2% of men with AUDs felt embarrassed by their problems with alcohol, only 2.8% had sought treatment in the past 12 months.
Conclusions A need exists for effectively identifying and treating adults with AUDs. Health promotion services, informed by commonly-expressed stigmatised beliefs held among those affected by AUDs and which are targeted at the most affected communities, may be an effective step in closing the treatment gap.
- EPIDEMIOLOGY
- MENTAL HEALTH
- PUBLIC HEALTH
This is an Open Access article distributed in accordance with the Creative Commons Attribution Non Commercial (CC BY-NC 4.0) license, which permits others to distribute, remix, adapt, build upon this work non-commercially, and license their derivative works on different terms, provided the original work is properly cited and the use is non-commercial. See: http://creativecommons.org/licenses/by-nc/4.0/
Statistics from Altmetric.com
Strengths and limitations of this study
This is the first population-based survey of alcohol use to be conducted in Madhya Pradesh, India in 10 years, and one of the few studies of alcohol use in India to include women.
We used a widely validated screening tool (AUDIT) to identify participants who had alcohol use disorders.
Since this is a cross-sectional study, we are unable to determine whether any of the factors associated with AUDIT scores are causal relationships.
Background
Alcohol misuse is a major and increasingly attributable risk factor for morbidity and mortality worldwide.1–3 Studies of communities in India show that while the prevalence of alcohol abstention is relatively high, those who do drink are highly likely to engage in hazardous, harmful or dependent drinking behaviours,4–8 here collectively referred to as alcohol use disorders (AUDs) (International Classification of Diseases 10th Edition, ICD-10: Z72.1, F10.1, F10.2).9
While the impact of AUDs is direct (ie, through overdose or fetal alcohol syndrome), studies conducted in India demonstrate that much of the impact is mediated through increased risk of accidents, development or progression of chronic disease and acquisition of infection.10–14 Further, individuals affected by AUDs have broader social impacts through the increased risk of violence and the health and economic consequences of consumption or injury.5 ,13 ,15–19 AUDs have consistently been identified as a public health concern over the past 20 years,20–23 during which time per capita consumption of alcohol has increased by 55%,24 and the treatment gap for those affected has remained persistently high.18 ,25 ,26
The effects of AUDs have motivated the development of programmes such as Screening and Brief Intervention, which aim to reduce the frequency and intensity of alcohol consumption episodes. Screening and Brief Intervention has been shown to be effective and cost-effective in low-income settings,27 ,28 where access to treatment services remains limited.29 The treatment gap in India has not been well characterised, nor have the characteristics of those individuals who need services. As a prerequisite to the adaptation and implementation of Screening and Brief Intervention, we conducted a study to describe the epidemiological features of alcohol consumption and of treatment-seeking among adults living in a rural district in India.
Methods
Setting
Sehore District is a predominantly rural district in central India, with a population of 1.3 million people. At the time of this study, inpatient detoxification and rehabilitation services were available in Sehore city at a government-funded 15-bed facility. Additional detoxification and rehabilitation services were available in the public and private sectors in Bhopal city, approximately 34 km away from Sehore city. As part of the PRIME research programme consortium and in partnership with the Madhya Pradesh State Ministry of Health, Sehore District was selected to implement a district-level mental healthcare plan to integrate mental health diagnostic and treatment services into the primary healthcare sector.30 The primary aim of the PRIME Community Surveys is to detect a change in treatment-seeking among adults with alcohol use or depressive disorders. We conducted a baseline round of data collection immediately prior to implementation of the district-level mental health plan, and plan to conduct a follow-up round of data collection 18 months later.
Sample and questionnaire
In Sehore, a sample size of 3220 in each survey round provides over 80% power to detect a change in treatment-seeking among adults with AUDs from 5% to 20% with a two-sided α of 0.05. We assumed that approximately 10% of adults would have AUDs. Since we planned to use a cluster sampling design, we used a conservative value of 0.10 for the intraclass correlation for treatment-seeking. We used 2011 census data31 to recruit this population-based sample as follows: In proportion to the population distribution in the district, we selected 70 villages from the rural stratum and 19 wards from the urban stratum. Within each selected village/ward, we used simple random sampling to select one electoral polling station's voter list.32 Within the selected list, we randomly selected between 25 and 47 adults, with the variation in allocation being a function of the research assistants’ time availability. The research assistant located the adult's household and contacted the adult, scheduled a return visit through another household member (if the selected adult was not present) or moved to the next adult of the same sex on the voting list (if the originally selected adult no longer resided at that address). On meeting the selected adult, the research assistant explained the aims of the study, assessed the adult for eligibility (ie, age≥18 years, fluent in Hindi and absence of intellectual impairment or acute medical issue) and scheduled eligible adults for an interview. The interviewers were male and female university graduates who were mostly residents of Sehore District. The interviewers orally administered a structured interview in Hindi, using a questionnaire application33 programmed on a tablet device.
The questionnaire consisted of sections pertaining to: sociodemographic characteristics; recent use of alcohol or tobacco; screening for alcohol use disorders; treatment-seeking and stigma for problems with alcohol; screening for depression; treatment-seeking and stigma for depression; suicidality; healthcare usage and out-of-pocket expenditures; and disability severity.
Health-related measures
The outcome measure of interest is the total score on the 10-item AUDIT.34 The AUDIT was developed by WHO and has been widely validated, including in India.35 ,36 Respondents are asked about the frequency of different drinking behaviours and consequences over the past 12 months, and their responses are scored from 0 (Never occurs) to 4 (Daily). The sum of scores from the 10 items provides guidance on whether the respondent engages in hazardous (score 8–15), harmful (score 16–19) or dependent (score ≥20) drinking behaviours, using cut-offs defined by WHO.34 Participants who had not consumed alcohol in the past 12 months were not administered the AUDIT and were allocated a score of 0. Participants who had an AUDIT score of 8 or more were asked about their treatment-seeking, and then were asked 11 questions from the 29-item Internalized Stigma of Mental Illness scale37 with regard to ‘problems with drinking’; these 11 items were selected for the questionnaire as they were relevant to the cultural and programmatic contexts across PRIME countries.
To measure depression severity, we administered the 9-item Patient's Health Questionnaire (PHQ-9)38—which has been validated in India39 ,40—followed by a question on suicidal ideation which was adapted from the Mini International Neuropsychiatric Interview (MINI), a diagnostic tool for mental disorders.41 To measure disability, we administered the 12-item WHO Disability Assessment Schedule 2.0 (WHODAS),42 which has been widely validated for use in low income and middle income country settings. Using questions adapted from the Client Service Receipt Inventory,43 we asked participants whether they had any inpatient admissions to a hospital in the past 12 months, whether they had used any outpatient health services in the past 3 months, as well as out-of-pocket expenses for those outpatient services.
Sociodemographic measures
The items included in the sociodemographic section were adapted from the Indian version of the Demographic and Health Surveys.44 Participants were asked how many years of education they had completed, and from these responses we created categories for educational attainment (0 years, 1–5 years, 6–11 years, and ≥12 years). As a proxy for socioeconomic status, we asked participants about whether they owned any land, as well as about the quality of their home construction; we used Government of India definitions to classify the homes into those with lower, average and higher quality.45 Participants were engaged in a wide range of occupations, and from these responses we adapted an occupation classification system46 to create four groups reflecting no occupation, non-income work (eg, household work, student), lower income work (eg, agriculture, unskilled manual) and higher income work (eg, teacher, police/military, skilled manual), as well as whether they had signed up to receive work assignments through a national employment programme.
Statistical methods
First, we described the sociodemographic characteristics and AUDIT scores of the full sample of 3220 adults and reported the distribution of the sample within each measurement stratum (eg, age group, education group). Then within each sociodemographic stratum, we reported the percentages of adults who had and had not consumed alcohol in the past 12 months. Among all participants and then among men, women and those who had recently consumed alcohol, we report the mean AUDIT score and the proportions who have AUDIT scores consistent with hazardous, harmful and dependent drinking. Next, using data from adults who had recently consumed alcohol, we estimated the internal consistency of the AUDIT score using Cronbach's α, and using data from all adults we estimated the intraclass correlation for clustering of AUDIT scores by ward/village using large one-way analysis of variance.
Previous research conducted in India has demonstrated that alcohol consumption is almost universally a male activity. Thus, we restricted the next analysis of the sample to male participants who reported consuming alcohol in the past 12 months. With these participants, we used univariable zero-truncated negative binomial regression models to assess individual-level, household-level and community-level characteristics, inpatient care, outpatient out-of-pocket expenditure, tobacco use and depression and disability severity for their association with the AUDIT score. The negative binomial regression model is suitable for skewed outcome data, and produces coefficients which—once exponentiated—are interpreted as the relative difference in the AUDIT score for every unit change in the independent variable. We have analysed the AUDIT score as a continuous score rather than a binary category as we are interested in risk factors associated with increasing harm from alcohol, which can inform development of population-level strategies to reduce those risks. In contrast, analysis of a binary category would be more suitable to inform clinical care, where only high-scoring individuals would receive referral for treatment. For each regression model, we report the exponentiated β coefficients and their 95% CIs. We combined strata when one stratum comprised less than 0.1% of the population of male drinkers (eg, ‘No caste’ combined with ‘general caste’).
Finally, we further restricted the sample to participants who had AUDIT scores of 8 or more. We describe the treatment-seeking behaviour, if any, of these participants and tabulated the frequency of affirmative response to questions about internalised stigma beliefs (figure 1).
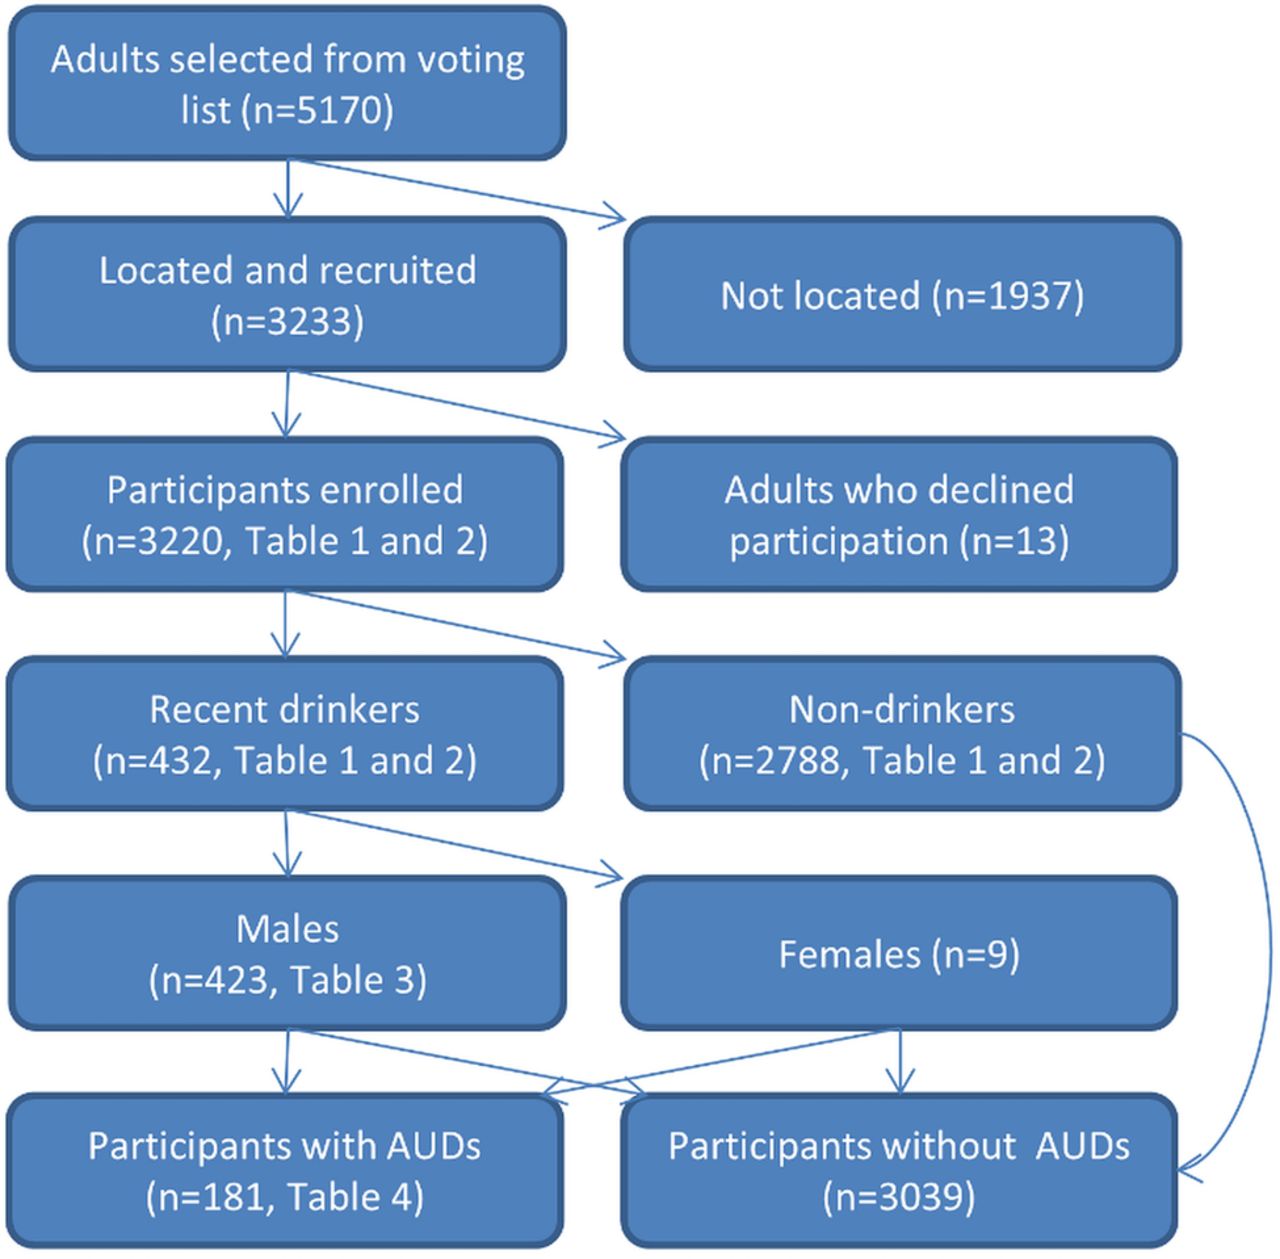
Participant flow diagram for PRIME Community Survey, Sehore District, India, 2013–2014. AUDs, alcohol use disorders
We completed all analyses in Stata/IC 13.1 (College Station, USA), and adjusted all mean, percentage and regression coefficient figures for the complex sampling design. (see online supplementary material).
Ethics
Interviewers gave eligible adults oral and written information about the study and consenting adults provided a signature (or thumb print for low-literacy adults). For adults who expressed suicidal ideation during the interview process, the interviewer provided a referral to a research psychiatrist.
Results
We conducted the survey in two waves (May–June 2013 and January–March 2014), during which time we selected 5170 adults from voting lists for recruitment, of whom we were able to contact 3233. Of the 3233 adults we were able to contact, 3220 provided informed consent (survey response rate=99.6%). Consistent with the overall population distribution of Sehore District, most of the 3220 participants (78%) were recruited from the rural stratum and the remainder (22%) from the urban stratum. The sociodemographic characteristics of the sample are described in table 1. The mean age of the adults was 40.2 years (SD 15.1) and 55% were male. Most adults were Hindu (90%), currently married (85%) and had at least one child (94%). Educational attainment was low, as 28% of adults never attended school and another 23% started but did not complete primary school (23%). Few participants (9%) had a higher income occupation.
Characteristics of adults in Sehore District, India, 2013–2014
Across the entire population, 13.3% of adults (95% CI 11.6% to 15.2%) had consumed alcohol at least once in the past year; the sociodemographic stratum-specific prevalences of alcohol consumption are presented in table 1. Alcohol consumption varied widely between sociodemographic groups: while 23.8% of men and 14.7% of Hindus had consumed alcohol in the past 12 months, only 0.6% of women and 1.2% of Muslims did. Among those who had recently consumed alcohol, the internal consistency of the AUDIT screening tool was high (Cronbach's α=0.783). The intraclass correlation for AUDIT scores was 0.052: though the mean AUDIT score for males across Sehore District was 1.0, the cluster-specific means (for individual villages or wards) ranged from 0.00 to 5.3 (figure 2). The alcohol consumption patterns for women, men and currently drinkers are presented in table 2. Recent consumption of alcohol was acknowledged by a minority of women (0.6%) and men (23.8%), and the mean AUDIT scores for these groups were 0.03 and 1.8, respectively. Among those who had recently consumed alcohol, the mean AUDIT score was 7.5; 33.2% of these individuals had an AUDIT score which was consistent with hazardous alcohol consumption behaviour (AUDIT score 8–15), 3.3% with harmful behaviour (AUDIT score 16–19) and 5.5% with dependent behaviour (AUDIT score ≥20).
Alcohol consumption among adults in Sehore District, India, 2013–2014

Distribution of mean AUDIT score for male residents of selected villages and wards in Sehore District, India, 2013-2014. AUDIT, Alcohol Use Disorders Identification Test.
The correlates of AUDIT scores among male drinkers are described in table 3. AUDIT scores were 65% lower for drinkers who were widowed, divorced, separated or deserted (relative score=0.35, 95% CI 0.17 to 0.72) relative to those who were married. For each unit increase in PHQ9 score, the AUDIT score was 5% higher (relative score=1.05, 95% CI 1.03 to 1.07). Having at least one child, high-quality housing, urban residence, suicidal ideation, tobacco use and disability were all positively associated with AUDIT scores, whereas land ownership, out-of-pocket healthcare expenditure and participation in the national employment programme were negatively associated with AUDIT scores. We did not find evidence of differences in AUDIT scores by religion, caste, occupation type or use of inpatient care.
Sociodemographic and health-related correlates of AUDIT scores among adult males who recently drank alcohol in Sehore District, India, 2013–2014
Of the adults with AUD, only 2.8% had sought treatment for problems with drinking in the past 12 months, primarily from traditional healers. Nearly one in four (23.9%) adults with AUDs spoke to another person about their drinking, primarily to a spouse/partner or a friend.
The internalised stigma beliefs of adults with AUDs are presented in table 4. Nearly half of these adults felt embarrassment or shame (49.2%) or disappointment in themselves (47.2%) because of problems with drinking. A few of these adults reported that they were unable to make their own decisions (20.3%) or that they were ignored (16.6%) because of their problems with alcohol.
Internal stigma beliefs among adults with alcohol use disorders in Sehore District, 2013–2014
Discussion
In Sehore District, we found that a minority (13.3%) of adults consumed alcohol in the past 1 year, though a substantial proportion (42%) of the adults who did consume alcohol had behaviours consistent with alcohol use disorders. AUDIT scores were positively associated educational attainment, urban residence, having children, high-quality housing, depression severity, disability severity and usage of tobacco products. Adults who had AUDs were unlikely to have sought treatment from a medical provider, were likely to feel personal shame, but were not likely to feel social stigma.
The PRIME Community Survey is notable for being a large, population-based survey of alcohol use in Sehore District, and this is the first such study to be conducted in Madhya Pradesh State in 10 years. That prior study only considered whether respondents consumed alcohol or not and combined data across multiple states in India. These data advance understanding by measuring the intensity of alcohol use, and in a single, defined population. We measured alcohol use with the AUDIT tool, which had been validated elsewhere in India,35 ,36 and demonstrated here a high value for internal consistency.
The drinking population in Sehore District comprised a small proportion of men from the general population, within which a large proportion engages in hazardous, harmful or dependent drinking behaviours (table 2). These findings are consistent with the two other alcohol surveys conducted in Madhya Pradesh state47 ,48 as well as elsewhere in India7 ,25 ,49). Multiround cross-sectional studies such as the PRIME Community Surveys are required to evaluate whether the prevalence of drinkers is increasing, particularly among women and whether those who do drink are increasing their consumption intensity. An understanding of these trends will help guide the health promotion messaging for the targeted population, and further support expansion of programmes for screening and brief intervention, and more intensive programmatic interventions.
In this study, the clustering coefficient for the AUDIT score provides evidence of a geographic component to drinking behaviours, such that a portion of an individual's AUDIT score is explained by the scores of other drinkers within the same village/ward. Evidence of geographic clustering was also present in the findings from a study of health facility attendees in Goa, India.5 Further, a multistate survey of alcohol use in India, which included Madhya Pradesh state, found that 11% of the variance in drinking was explained by that individual's area of residence.47 Additionally, an explanatory models study in Goa identified a person's peers as a key influence on alcohol use disorders.50 The policy implication of these findings is that a community-level focus for health promotion programmes (eg, working with local non-governmental organisations and village health workers) may be necessary and conducted in addition to population-level programmes (eg, through legislation or taxation) in changing alcohol consumption patterns.
Recent consumption of alcohol was far higher among Hindus (14.7%) than Muslims (1.2%), a finding which is consistent with national patterns.47 In contrast to a generally understood prohibition on alcohol consumption for all adherents of Islam, the historical record for Hindus contains a multitude of references to alcohol use, even for ceremonial usage.51 It should be noted, though, that while religious affiliation is predictive of whether an adult drinks alcohol or not, religious affiliation was not associated with the intensity of consumption among male drinkers.
AUDIT scores were positively associated with tobacco use, depression and disability, which is broadly consistent with other data reported from India.5 ,6 ,13 ,14 ,18 ,26 ,52 However, like Silva's study of male industrial workers in Goa,26 we did not find a positive association of AUDIT scores with receipt of inpatient care.. Male drinkers with higher AUDIT scores had lower out-of-pocket expenditure for outpatient care, in contrast to the increased healthcare usage which has been observed for people with AUDs elsewhere in India.16 ,18 ,26 Further research is needed to clarify this relationship. It is possible that in Sehore, chronically unwell people curtail their drinking and that heavy drinkers avoid engagement with the health sector. Taken as a whole, our findings indicate that there are multiple domains of poor health concurrently present in adults with higher AUDIT scores. We found that only a small minority of people with alcohol use disorder sought treatment, or communicated their problems with alcohol. Treatment-seeking by those with problems with alcohol in India is an infrequent occurrence,18 ,25 ,26 and is partially due to lack of public treatment services and inaccessibility of private services.21 Yet recognition that problems with alcohol are medical in nature is rare,25 ,50 and most likely contributes to both the low supply of and demand for treatment services. Given the need for, and the low level of uptake of, services, it may be useful to consider the role of community health workers in implementing screening and brief intervention programmes.
Feelings of personal shame are commonly expressed by people with AUDs in India18 ,25 ,50 and elsewhere. The stigmatising beliefs endorsed by adults here most likely impede treatment-seeking, and must be directly addressed as part of any increase in the supply of treatment services. A future study of explanatory models, such as has been conducted in Goa, India,50 is an appropriate means to identify the full range of stigmatising beliefs and the means to overcome them.
There are some important limitations to consider. Since we have used a self-report questionnaire, social desirability and the individual's unwillingness to acknowledge that they drink or have specific problems with alcohol are likely to have biased our prevalence estimates downward and thereby reduced the magnitude of effect estimates in the regression models. Second, since we used a cross-sectional study design, we are unable to make causal inferences, or to establish the direction of associations. For example, we observed a positive association between AUDIT scores and symptoms of depression: while a known consequence of alcohol consumption is the manifestation of depressive symptoms,53 it is also common for people with psychiatric conditions to self-medicate with alcohol.54 Finally, the effect estimates in the regression models may be biased by confounding factors. Further research must investigate the hypotheses generated in this analysis, which can adjust for potential confounders accordingly. Similarly, the prevalence and regression estimates presented here are population-level estimates and there may be important stratum-specific estimates (eg, by sex, religion or caste) which will require consideration of effect modification to assess.
In conclusion, it is evident that a need exists for effectively identifying and treating adults with AUDs. The existing capacity for service provision is inadequate to meet current need, and the treatment gap will continue to increase given that the prevalence and intensity of alcohol consumption is rising in India.24 ,55 Health promotion services, informed by commonly expressed stigmatised beliefs held among those affected by AUDs and which are targeted at the most affected communities, may be an effective step in closing the treatment gap.
Acknowledgments
The authors thank Vaibhav Murhar and Dr Sanjay Shrivastava of Sangath, India, Dr Sandesh Samudre, Narendra Verma and Bhagwant Chilhate of the Public Health Foundation of India, and Dr Rajeev Mohan. Also, The authors extend our appreciation to the officials of the Department of Public Health and Family Welfare, Government of Madhya Pradesh, India.
References
Supplementary materials
Supplementary Data
This web only file has been produced by the BMJ Publishing Group from an electronic file supplied by the author(s) and has not been edited for content.
- Data supplement 1 - Online supplement
Footnotes
Contributors SDR and RS conceived and designed the study. SDR analysed the data and drafted the manuscript. AB, AN and RS revised the manuscript, providing intellectual content. All authors commented on and approved the final manuscript.
Funding This study is an output of the PRogramme for Improving Mental health carE (PRIME) which was funded by UK aid from the UK Government (GB-1-201446); however, the views expressed do not necessarily reflect the UK Government's official policies. The funders had no role in study design, data collection and analysis, decision to publish or preparation of the manuscript.
Competing interests None declared.
Ethics approval Sangath (Goa, India), University of Cape Town (South Africa) and WHO (Geneva, Switzerland).
Provenance and peer review Not commissioned; externally peer reviewed.
Data sharing statement Interested parties may notify the PRIME investigators of their interest in collaboration, including access to the data set analysed here, through the following website: https://docs.google.com/forms/d/1–4oNm5xdEPlq-RjL_4GUyCPMpVWtyaNVcfDewnx-iL4/viewform