Article Text

Abstract
Objective Injury is currently an increasing public health problem in China. Reducing the loss due to injuries has become a main priority of public health policies. Early warning of injury mortality based on surveillance information is essential for reducing or controlling the disease burden of injuries. We conducted this study to find the possibility of applying autoregressive integrated moving average (ARIMA) models to predict mortality from injuries in Xiamen.
Method The monthly mortality data on injuries in Xiamen (1 January 2002 to 31 December 2013) were used to fit the ARIMA model with the conditional least-squares method. The values p, q and d in the ARIMA (p, d, q) model refer to the numbers of autoregressive lags, moving average lags and differences, respectively. The Ljung–Box test was used to measure the ‘white noise’ and residuals. The mean absolute percentage error (MAPE) between observed and fitted values was used to evaluate the predicted accuracy of the constructed models.
Results A total of 8274 injury-related deaths in Xiamen were identified during the study period; the average annual mortality rate was 40.99/100 000 persons. Three models, ARIMA (0, 1, 1), ARIMA (4, 1, 0) and ARIMA (1, 1, (2)), passed the parameter (p<0.01) and residual (p>0.05) tests, with MAPE 11.91%, 11.96% and 11.90%, respectively. We chose ARIMA (0, 1, 1) as the optimum model, the MAPE value for which was similar to that of other models but with the fewest parameters. According to the model, there would be 54 persons dying from injuries each month in Xiamen in 2014.
Conclusion The ARIMA (0, 1, 1) model could be applied to predict mortality from injuries in Xiamen.
- injury
- prediction
- time serial
- ARIMA
This is an Open Access article distributed in accordance with the Creative Commons Attribution Non Commercial (CC BY-NC 4.0) license, which permits others to distribute, remix, adapt, build upon this work non-commercially, and license their derivative works on different terms, provided the original work is properly cited and the use is non-commercial. See: http://creativecommons.org/licenses/by-nc/4.0/
Statistics from Altmetric.com
Strengths and limitations of this study
Few studies have used the autoregressive integrated moving average (ARIMA) model to forecast injury mortality. Our modelling approach shows that the ARIMA (0, 1, 1) model could reflect the trend of injury mortality in Xiamen and forecast mortality reliably for a short time period.
Some data reported in the Death Surveillance System were collected retrospectively from the bereaved, who did not necessarily know all of the illnesses of the deceased. Possible biases in disease reporting might affect the precision of our model.
The model did not consider the possible impact factors related to injury mortality, such as behavioural factors and weather changes.
Introduction
Injuries that affect all ages of the population have become a serious worldwide public health threat. Deaths caused by injuries have a serious impact on communities and families.1 According to the latest report from the WHO, approximately 5.14 million people died from injuries in 2012, an incidence of 727 per million persons.2 With its rapid economic growth, China has undergone many substantial changes in modes of lifestyle and transport, all of which cause many unexpected issues. Injury, the leading cause of death in the Chinese population aged 1–39 years, is now an additional public health problem in China.3 According to the China Ministry of Health, the annual incidence of injuries for all ages was between 16.1% and 21.9%;4 injury-related deaths accounted for nearly 10% of all deaths during 2004–2010.5 Therefore, reducing the loss due to injuries has become a priority for public health policies.5 Early warning of injury mortality based on surveillance information is essential for reducing or controlling the disease burden of injuries. To reduce the loss due to injuries, statistical methods such as time series should be used to describe possible patterns of sequences, with the ultimate aim of predicting future events.
The autoregressive integrated moving average (ARIMA) model, one of the most classic methods of time series analysis, was first proposed by Box–Jenkins in 1976.6 It is represented as a moving average (MA) model combined with an autoregression (AR) model to fit the temporal dependence structure of a time series using the shift and lag of historical information. In epidemiology, this model has been widely used to predict the incidence of infectious diseases such as dengue fever in Singapore,7 avian influenza H5N1 in Egypt8 and hepatitis E in China.9 These predictions are useful for public health and clinical services departments to control the prevalence of disease. However, to the best of our knowledge, this model has not been used to predict mortality from injuries in China.
Predicting the number of deaths due to injuries in future months will generate useful information for designing the strategies of public health services. The objective of this study was to describe the temporal trends of injury mortality in Xiamen and to determine the possibility of applying ARIMA models to forecast injury mortality in the upcoming months.
Materials and methods
Materials
Xiamen is a coastal city located in the southeast of China, with a population of nearly two million in 2013. It covers six districts, including two rural regions (Xiang'an and Tong'an districts), two suburbs (Haicang and Jimei districts) and two urban areas (Huli and Siming districts). The Death Surveillance System has covered the whole city of Xiamen since 2002, when cause of death was classified according to the International Classification of Disease, Tenth Revision (ICD-10). In this study, demographic data were retrieved from the Xiamen Municipal Public Security Bureau, and monthly injury mortality rates in Xiamen were provided by the Xiamen Center for Disease Control and Prevention (CDC), which is responsible for managing the Death Surveillance System. The death and demographic data in this study only included registered Xiamen households. The ICD-10 codes of injury included all ‘V’, ‘W’, ‘X’ and ‘Y’ codes.
Model fitting
The values p, q and d in the ARIMA (p, d, q) model refer to the numbers of AR lags, MA lags and differences, respectively. Brackets are used to show parameters with statistical significance if not all parameters in each lag have statistical significance. The Box–Jenkins methodology was adopted to fit the ARIMA (p, d, q) model. Before constructing the model, we have to identify the stationary state of observed data in the series, of which the mean value remains constant. If non-stationary, the data would be transformed into a stationary time series by taking a suitable difference. The Ljung–Box test was used to measure the ‘white noise’ and residuals in the study. Three steps were performed to determine the degree of ARIMA: model identification, parameter estimation and testing, and application. The orders of the model were identified initially by the cut-off figure of the autocorrelation function (ACF) and the decay figure of the partial ACF (PACF). Schwartz's Bayesian criterion (SBC) was used to select an optimal model; the less the better. The conditional least-squares method was used for parameter estimation, and the t test was used for parameter testing. A parameter without statistical significance had to be removed from the model. The mean absolute percentage error (MAPE) was calculated to assess forecast accuracy and to select an optimum model. A lower MAPE value indicates better fit of the data.  , where n is the number of training data,
  the actual value, and
  the predicted value. Among models with similar values of MAPE, the model with the fewest parameters is preferred. Finally, the fitted model was applied to forecast injury mortality in future months.
Statistical analysis
The rates reported were the mean annual rates. The medians, Q1–Q3, were used to describe the distribution of age. The Cochran–Armitage trend test was used to examine the temporal trends in annual injury mortality for different genders. Significance was calculated for p<0.05. All data analysis was performed using SAS V.9.1.
Results
Temporal analysis
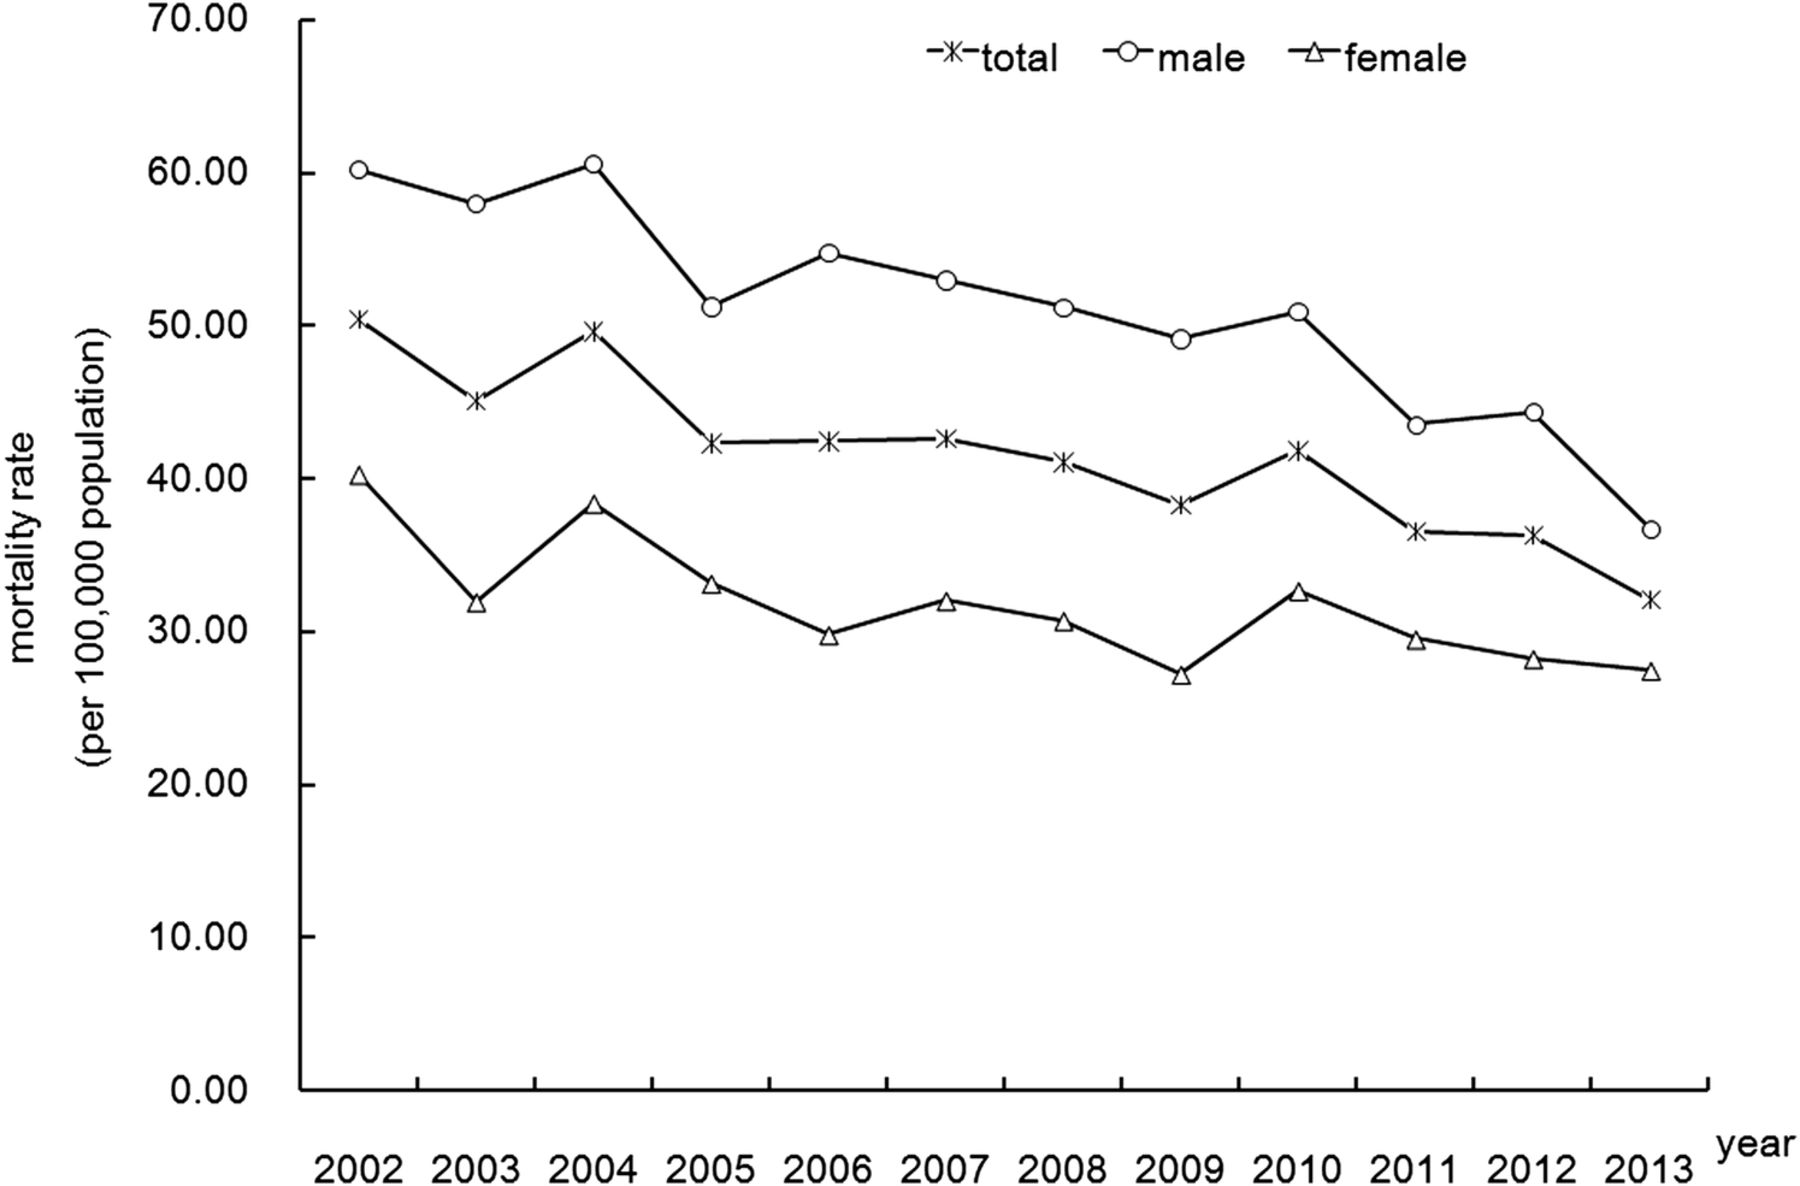
In total, there were 8274 injury-related deaths in Xiamen from 2002 to 2013 (5121 male and 3153 female), with the trough in December (632 cases) and the peak in August (749 cases). Median age was 49 years (Q1–Q3, 34–73) for the total deaths in this study, 45 years (Q1–Q3, 31–63) for male deaths and 62 years (Q1–Q3, 40–81) for female deaths. The average annual injury mortality rate during these years was 40.99/100 000 persons, with nearly 1.61 times more male than female deaths. There was a statistically significant declining trend year by year in total mortality rates from injuries during this period (figure 1); the same was found for male and female mortality rates (all p<0.01). The annual mortality rates in total decreased from 50.39/100 000 in 2002 to 32.07/100 000 in 2013 (a 34.96% decline). On average, total mortality rates total declined by approximately 3.03% per year. Male annual mortality rates decreased from 60.19/100 000 in 2002 to 36.73/100 000 in 2013 (a 38.97% decline). Female rates decreased from 40.32 to 27.46/100 000 (a 31.74% decline) over the same period.

Annual mortality rate of injuries in Xiamen, China, from 2002 to 2013.
Model fitting
The result of the above temporal trend test showed that the series of monthly injury mortality data in Xiamen from 2002 to 2013 was a non-stationary sequence. Therefore, we took the first-order differentiation to stabilise the variances. After first-order differentiation (d=1), the data that were not ‘white noise’ (p<0.01) were dispersed horizontally around zero (figure 2), suggesting that they were stationary. The ACF and PACF for first-order differentiated data are shown in figure 3. The autocorrelations of the series after first-order differentiation is within 95% CI except for the first lag. The ACF graph cut-off at lag 1 with slow decay in the PACF graph suggested an MA model (q=1) (figure 3).

Series of monthly mortality after first differentiation. The data after first-order differentiation are dispersed horizontally around zero, suggesting they are stationary.

Autocorrelation function and partial autocorrelation function (ACF and PACF) graphs after first differentiation. The shaded portion is the 95% CI range. The ACF cuts off at lag 1 with slow decay in the PACF, suggesting a moving average model (q=1).
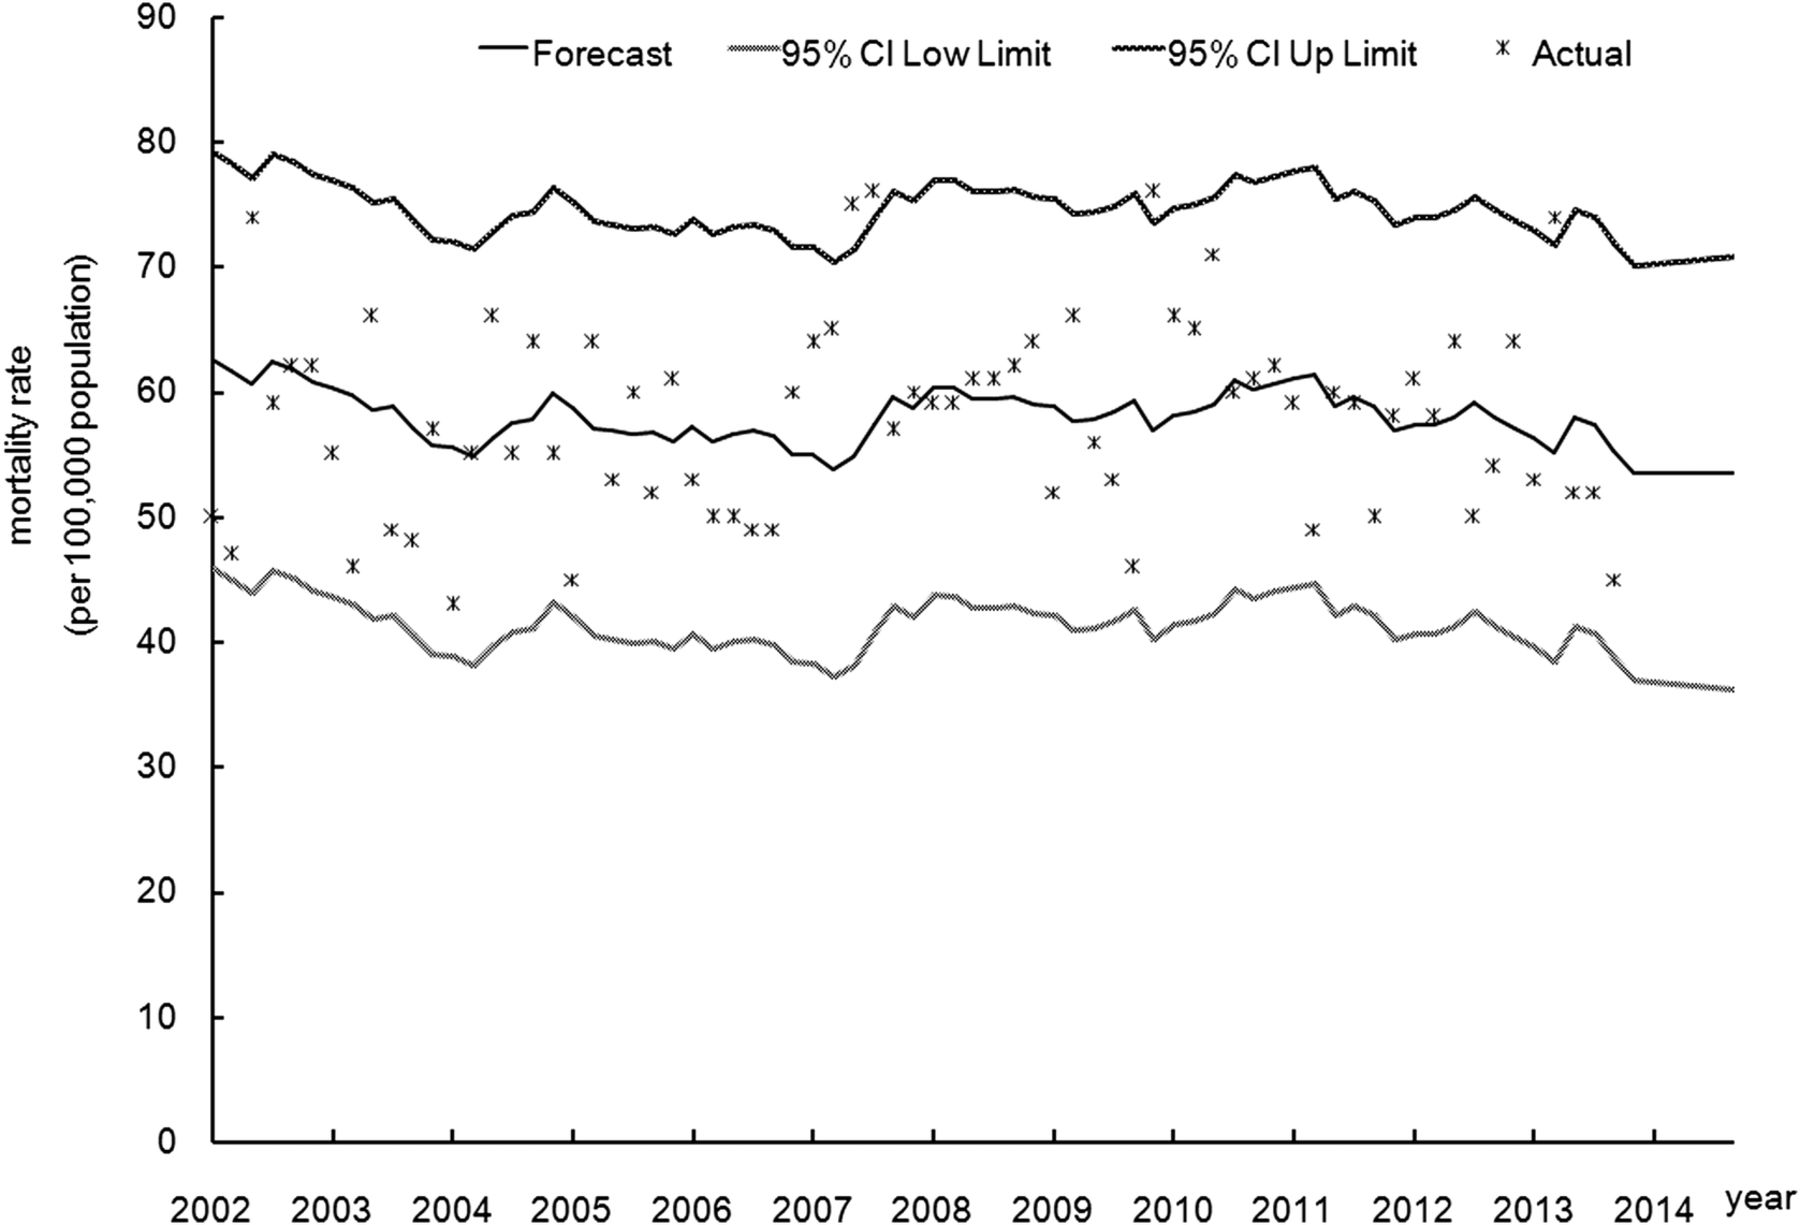
Through frequent adjustment of the parameters according to the values of the Bayesian information criterion (BIC) shown by SAS software directly from low to high, three models ultimately passed the parameter tests (p<0.01) and residual tests (p>0.05): ARIMA (0, 1, 1) with SBC value 1021.28 and MAPE value 11.91%; ARIMA (4, 1, 0) with SBC value 1040.80 and MAPE value 11.96%; and ARIMA (1, 1, (2)) with SBC value 1026.19 and MAPE value 11.90%. We chose the ARIMA (0, 1, 1) model—where the MAPE value was similar to that of the other models, but had the fewest parameters—as the most appropriate model. The ACF and PACF graphs for residuals of the ARIMA (0, 1, 1) model confirmed that the data were fully modelled and that the model was suitable to be used for prediction (figure 4). The MA (1) parameter was equal to 0.91008 (t=24.21, p<0.05). The 95% CI of the predicted values contained most of the actual observed data. The predictions for monthly mortality from injury in the upcoming 12 months in 2014 in Xiamen were all approximately 54 persons (figure 5).

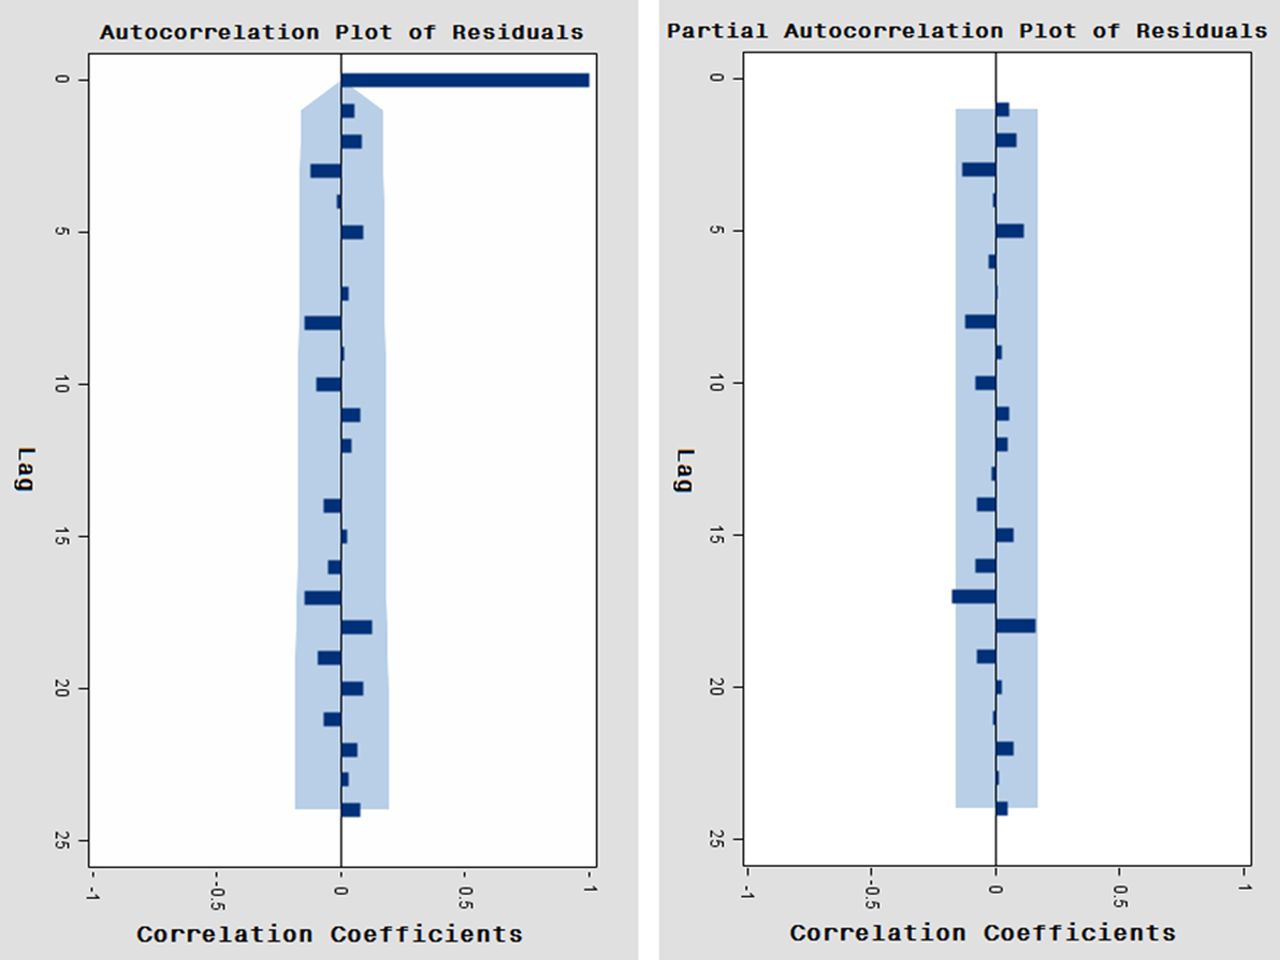
Autocorrelation function and partial autocorrelation function (ACF and PACF) graphs of the residuals for the autoregressive integrated moving average (0, 1, 1) model. The shaded portion is the 95% CI range. As their correlation values are not outside the 95% CI limits, the residuals errors are considered to be white noise, indicating that this model is appropriate for prediction.
Actual and predicted mortalities and 95% CI of predicted mortalities. Most actual observed data are contained within the 95% CI of the predicted value, revealing that the prediction for the monthly injury mortality in Xiamen using the autoregressive integrated moving average (0, 1, 1) model is acceptable.
Discussion
Predictions of injury mortality could generate useful information for designing the strategies of public health services. However, the causes of injury are complex and include personal, family and social factors.10 It is difficult using traditional regression analysis methods to predict the trend of occurrence of, and death by, injury. The time series analysis method uses time (t) to take the place of these influencing factors, so it may be a useful tool for predicting the death trend from injury without these related factors.11 The ARIMA (p, d, q) model is one of the most classic methods of time series analysis, which is established on the basis of past values of the series and the previous error terms for forecasting, using traditional mathematical theory, such as calculus and mathematical statistics.6 It is a linear conventional model for non-stationary time series that is transformed to stationary by differentiation; it has wider applicability and greater predictive ability than non-temporal techniques.12 The essential modelling data are readily available from annual or monthly reports or even from the literature.6 So far, the ARIMA model has been applied successfully to describe the temporal trend and predict the incidence of various infectious diseases such as hand–foot–mouth disease,13 malaria14 and tuberculosis.15 However, few methods have been used to forecast injury mortality.12 Therefore, we tried applying the ARIMA model to predict mortality trend from injury in Xiamen, China.
Before constructing the model, we had to test for ‘white noise’; a time sequence consists of uncorrelated random variables and cannot be used to build a model.6 The series after first-order differentiation was not ‘white noise’ (p<0.01 in the Ljung–Box test) in our study, indicating that this series was worth analysing and could be used to build the model. In the model identification stage, the ACF is a standard tool used to identify cycles, seasonality and other patterns in a series. The autocorrelation is considered to be equal to zero if it is within the 95% CI.12 All the autocorrelations of the series after first-order differentiation in our study were within 95% CI ranges except in the first lag, indicating that the series was cut off at lag 1 with slow decay without cycles, seasonality and other patterns. After identifying the model, we used the conditional least-squares method and t test to calculate and test the parameters of the model. Some parameters may present no statistically significant values (p≥0.05); in such cases, these parameters can be removed from the study in order to improve the arrangement of data.12 The Ljung–Box test is then performed again to ensure that the residuals after parameter estimation and testing consist of uncorrelated random variables. If the residuals of the series are ‘white noise’, it indicates that the building model fits the data adequately and appropriately, and can be used for prediction. If not, the process of identification must be performed again to assess other patterns that fit the data.6 In our study, three models ultimately passed the parameter tests (all p<0.01) and residual tests (all p>0.05): ARIMA (0, 1, 1), ARIMA (4, 1, 0) and ARIMA (1, 1, (2)).
Finally, the MAPE was calculated to assess the accuracy of the forecast and to select the optimum model. A lower MAPE value indicates a better fit of the data. The model with fewest parameters is preferred among those with similar MAPE values, because of the difficulty presented by the ARIMA model in explaining the parameters.6 In this study, the MAPE of the ARIMA (0, 1, 1) model (11.91%) was less than that of the ARIMA (4, 1, 0) model (11.96%), but close to that of the ARIMA (1, 1, (2)) model (11.90%). Therefore, we chose the ARIMA (0, 1, 1) model—which had fewer parameters than the ARIMA (1, 1, (2)) model—as the most appropriate model. The p value in the Ljung–Box test for the residuals was >0.05, which indicated that the fitted ARIMA (0, 1, 1) model already contained all the trends in the original series.6 Therefore, we could use this model to forecast future injury mortality. However, the 95% CIs of the predicted value in our study cannot include all of the actual observed data and enlarge rapidly over time, indicating that the fitted model cannot accommodate extreme values and is only suitable for short-term prediction. The newest data have to be updated frequently. The predictions showed that the value for monthly mortality due to injury in Xiamen was about 54 persons in 2014, slightly fewer than the 57 persons per month who died from injuries during the period 2002–2009.16 We have to strengthen the ‘5E comprehensive strategies’ by engineering intervention, environmental modification, enforcement intervention, educational intervention and evaluation, to prevent and control injuries. The research of Wu et al16 showed that road traffic accidents were the main cause of death due to injury in Xiamen. The government should establish sound traffic safety regulations to reinforce traffic management, including standardising warning signs, setting speed limits, introducing new legislation, dispensing severe punishment for drunk drivers, and improving the driving test.
The use of ARIMA models enables us to create short-term predictions of injury mortality in China. However, certain points must be taken into account in the course of building these models. First, the predicted outcomes would be affected by small changes in various parameters. In order to improve the accuracy of prediction, the most recent data model should be added to update the ARIMA model.12 The ARIMA (0, 1, 1) model in our study is able to show the epidemic trend-of-injury curve and forecast future mortality relatively accurately. However, it is only suitable for short-term prediction. We have to update data frequently to predict further monthly mortality due to injury. Second, when the mean of the fitted series is more than zero, the errors between the predicted values and the actual values would be too great to forecast if the constant term without statistical significance were to be deleted. Therefore, the model should include the constant term unless the mean of the fitted data is close to zero.6 The mean of the fitted series after first-order differentiation was close to zero in our model. As a result, the forecast was not affected by deleting the absolute term that was not statistically significant. Finally, model identification is the hardest step in the course of fitting a model. We usually explore the orders using a step-by-step method in accordance with the features of ACF or PACF (cut or decay). It would be difficult for a non-expert to build the model quickly. SAS software could supply the values of BIC (namely SBC), where the orders of p and q are both ≤5, and directly identify the order with the smallest value of BIC.6 The beginner could attempt to identify the initial order on the basis of the above BIC values from small to large and select the best model according to the BIC and MAPE values (the smaller, the better) among those that pass the parameter and residual tests.
There is at least one limitation in this study. The ARIMA (0, 1, 1) model could reflect the trend of injury mortality in Xiamen and forecast the future mortality reliably for a short time period. However, the model did not consider possible impact factors related to injury mortality, such as behavioural factors and weather changes (eg, rainfall, temperature).17 This may partly explain why the MAPE (11.9%) in this study is larger than the value of 5.5% in the research of Yu et al,18 which used the ARIMA model to forecast the number of HIV infections in Korea. In a future study, we will explore more sophisticated prediction techniques such as hybrid or multiple models related to the above impact factors to make more accurate predictions over the longer term. Some of the data reported in the Death Surveillance System were collected retrospectively from the bereaved, who did not necessarily know all of the illnesses of the deceased. It was only in about 2.41% of all deaths that cause of death was unknown/unspecific (ICD-10 codes begin with ‘R’). The bereaved may not have known for certain how the injuries occurred, but they could usually confirm that the injuries had indeed happened. So this might not affect the monthly mortality from injury data used to build the model in our study.
Conclusion
The government urgently needs to evaluate the loss caused by injuries, using statistical methods such as time series. Our modelling approach shows that applying the ARIMA time series models to forecast injury mortality in Xiamen is feasible. ARIMA models based on historical surveillance data are important tools for monitoring and forecasting injuries.
Acknowledgments
The authors thank Director Long Dai and other colleagues in the Department of Chronic Non-communicable Disease Control and Prevention of the Xiamen Municipal CDC for data collection.
Footnotes
Contributors YL conceived and designed the research, and wrote the paper. TL performed the statistical analysis. MC and GC were responsible for materials and analysis tools. XW was responsible for study supervision. All the authors were involved in revision of the manuscript for important intellectual content.
Funding This research received funding from The Fourth Period of the Xiamen Municipal Key Department Construction Project.
Competing interests None declared.
Ethics approval The medical ethics committee of Xiamen Center for Disease Control and Prevention agreed that the use of injury mortality from the Disease Surveillance System did not involve personal private information, and the present study was retrospective without any biological experiment related to humans or animals. The committee therefore waived the need for ethics approval for utilisation of the data.
Provenance and peer review Not commissioned; externally peer reviewed.
Data sharing statement No additional data are available.