Article Text

Abstract
Objectives To assess the accuracy of preschool vision screening in a large, ethnically diverse, urban population in South Auckland, New Zealand.
Design Retrospective longitudinal study.
Methods B4 School Check vision screening records (n=5572) were compared with hospital eye department data for children referred from screening due to impaired acuity in one or both eyes who attended a referral appointment (n=556). False positive screens were identified by comparing screening data from the eyes that failed screening with hospital data. Estimation of false negative screening rates relied on data from eyes that passed screening. Data were analysed using logistic regression modelling accounting for the high correlation between results for the two eyes of each child.
Primary outcome measure Positive predictive value of the preschool vision screening programme.
Results Screening produced high numbers of false positive referrals, resulting in poor positive predictive value (PPV=31%, 95% CI 26% to 38%). High estimated negative predictive value (NPV=92%, 95% CI 88% to 95%) suggested most children with a vision disorder were identified at screening. Relaxing the referral criteria for acuity from worse than 6/9 to worse than 6/12 improved PPV without adversely affecting NPV.
Conclusions The B4 School Check generated numerous false positive referrals and consequently had a low PPV. There is scope for reducing costs by altering the visual acuity criterion for referral.
This is an Open Access article distributed in accordance with the Creative Commons Attribution Non Commercial (CC BY-NC 4.0) license, which permits others to distribute, remix, adapt, build upon this work non-commercially, and license their derivative works on different terms, provided the original work is properly cited and the use is non-commercial. See: http://creativecommons.org/licenses/by-nc/4.0/
Statistics from Altmetric.com
Strengths and limitations of this study
First assessment of the efficacy of the B4 School Check vision screening that was implemented in New Zealand in 2008.
Retrospective longitudinal evaluation of vision screening results from 1 year of the B4 School Check programme with records available for over 5500 children.
As full ophthalmic examination results were only available for children who were referred from vision screening, negative predictive value, sensitivity and specificity were estimated using data from both eyes of children and logistic regression modelling.
Inter-eye correlation was taken into account by introducing a random effect assuming common positive predictive value and negative predictive value. However, using data from both eyes of an individual remains controversial.
Introduction
Recently published best practice guidelines recommend two vision screening protocols in 3–6 year-old children:1–3 measurement of acuity with a single letter or picture surrounded by crowding bars at 1.5 m2; or autorefraction.3 However, these guidelines have not been adopted in New Zealand (NZ) where vision screening is conducted on >90% of preschool children by lay-screeners as part of the B4 School Check, a national well-child programme. The current NZ protocol uses the Parr Vision chart at 4 m to screen for amblyopia, strabismus and significant refractive errors. Preschool children who fail vision screening are referred to their local hospital eye department where they are further evaluated by an optometrist, orthoptist or ophthalmologist. The Parr Chart, which is the same as the Sheridan Gardiner test4 with the exception that it is used at 4 m rather than 3 m, contains a single letter surrounded by confusion bars on each page. However, there is no published validation of the Parr Chart against other commonly used paediatric tests. Neither the Parr Chart, nor the Sheridan Gardiner test, meet the International Visual Acuity Chart Guidelines5 due to the non-standardised progression of letter sizes and the use of letters which do not have equal legibility. Although the Sheridan Gardiner and Parr tests are quick and easy to administer,4 the uncrowded versions of these tests have been found to produce a high number of false positive results when used in a screening context.6 Screening with the crowded version of the Parr Chart was implemented with the introduction of the B4 School Check in 2008/2009 because crowding elements may improve the sensitivity of vision tests for the detection of amblyopia.7 ,8 However, a formal evaluation is required to examine the accuracy of vision screening for NZ children using the crowded Parr Chart.
The primary aim of this study was to evaluate the positive predictive value (PPV) of the B4 School Check preschool vision screening programme and the precision of the acuity test used in a large cohort of ethnically diverse children living in an urban environment.
Methods
A retrospective review of children who participated in the B4 School Check Vision Screening Programme from 1 March 2010 to 28 February 2011 was conducted. South Auckland was chosen as the study site to provide a wide demographic; it has the largest Māori and Pacifika populations in NZ and a large number of low socioeconomic status (SES) residents.9 The study was approved by the Health and Disability North X Regional Ethics Committee and all data was de-identified to preserve patients’ anonymity.
Participants
Children who were referred from vision screening were identified through the Ministry of Health Database and data were collected on: age at screening, ethnicity, deprivation class (NZDep index)10 and unaided visual acuity (UVA) for the left and right eye. Basic demographic information was also gathered for children who declined vision screening. For children referred from the B4 School Check and seen at the hospital eye department in South Auckland, NZ, data were collected on UVA for the right and left eyes at the hospital eye assessment, ocular diagnosis and best corrected visual acuity (BCVA). Where possible, a reason was sought for non-attendance of children referred from the vision screening but not seen at Counties Manukau District Health Board (CMDHB).
B4 school check vision screening
The B4 School Check measured monocular UVA using the Parr Chart and either an optotype matching or letter naming task depending on the ability of the child. Uncrowded optotypes were used only when crowded measures could not be obtained. Referral for further assessment occurred if the UVA was worse than 6/9 in either eye or there was more than one line difference in UVA between the eyes. Unaided acuity measurements from vision screening were converted to logarithmic minimum angle of resolution (logMAR) results for comparison purposes.
Hospital eye examination
Initial assessment included a comprehensive ocular and medical history, monocular distance UVA with either the Crowded Keeler logMAR or Crowded Kay Pictures charts,11 ,12 assessment of ocular alignment and a red reflex check for media opacities. Additional tests were conducted at the discretion of the clinician. Children were discharged after initial consultation if UVA measured at the hospital eye examination was 6/9.5+1 (0.18 logMAR units) or better and no other abnormalities were detected.13 Refraction was not performed on children if UVA measured at the hospital eye appointment was better than 6/9.5+1 (0.18 logMAR), unless other ocular abnormalities were detected at the initial consultation. Children with UVA between 6/9.5−2 (0.25 logMAR units) and 6/9.5 (0.20 logMAR units) were re-examined within 2 months and scheduled for a comprehensive assessment if no improvement was found. All other children received a cycloplegic refraction and ocular health examination. Where required, spectacles were prescribed based on standard guidelines14 adopted by the hospital eye department. Children prescribed spectacles and/or amblyopia therapy were examined every 6–8 weeks until BCVA improved to age-appropriate levels or it was deemed that BCVA had stabilised and was unlikely to improve further.
Data analysis
As the study cohort only included children with a positive screening test who were referred for further care, analysis of PPV, negative predictive value (NPV), sensitivity and specificity was only possible if each eye of a child was considered separately as a statistical unit.15 ,16 A mixed logistic regression model was constructed, taking into account the correlation between the two eye measurements by introducing a random effect and assuming common PPV and NPV (as well as sensitivity and specificity) regardless of eye. PPV and NPV were estimated by setting the results of the hospital eye examination as the binary dependent variable (diagnosed vision disorder or no disorder) and regressing it on the screening UVA pass/fail criterion. Sensitivity and specificity were estimated similarly, but setting the results of the UVA pass/fail criterion as a binary random variable and regressing on the hospital eye examination result. The effect of varying the pass/fail criterion for UVA measured at the vision screening on PPV and NPV was examined by calculating odds ratios (ORs) for a range of acuity referral criteria, which enabled the drawing of a receiver operating characteristic curve. Mixed logistic regression modelling to determine PPV, NPV, sensitivity and specificity data was performed using Statistical Analysis System (SAS Institute) V.9.4 and R (The R Foundation) V.3.1. The Bland Altman plot was constructed in SPSS (IBM) V.22.
Definition of terms
A vision disorder was classified as reduced UVA (worse than 0.20 logMAR) in one or both eyes that was due to uncorrected refractive error or amblyopia, the presence of strabismus with or without reduced UVA, or ocular pathology. Children were classified as false positive referrals if they had normal UVA (better than 6/9.5 at the hospital eye department) or reduced UVA that normalised over time without intervention. The further classification of refractive error into either myopia or hyperopia depended on the spherical component of the cycloplegic retinoscopy. Myopia ≤−1.00 DS, hyperopia ≥+2.00 DS, astigmatism ≥1.00 DC, and anisometropia≥1.00 D difference between the eyes in any meridian were deemed significant refractive errors.17 PPV was defined as the proportion of eyes referred from vision screening that had a vision defect diagnosed and treated at the hospital eye department. NPV was the proportion of eyes that had normal vision at screening and were found to be visually normal at the hospital eye examination. Sensitivity provided an estimate of the true positive results and specificity an estimate of the true negative results of the acuity test used at screening.
Results
Cohort
A breakdown of the records that were available for retrospective review is shown in figure 1. Six hundred and two children declined vision screening and over half were of Māori (23.1%) or Pacifika ethnicity (37.4%), which is higher than the proportion of these children who received vision screening (15.7% and 25%, respectively). SES appeared to be a factor affecting whether vision screening was accepted or declined, as 54% of the families who declined screening lived in the most deprived areas, whereas only 12% of the families who declined lived in the most affluent areas.

Retrospective records review of B4 School Check vision screening results in the South Auckland region of New Zealand from 1 March 2010 to 28 February 2011.
The average age at vision screening was 52±4 months (range 37–70 months). More than 14% of children were referred from vision screening (n=698) and the majority of these (80%) were seen at the hospital eye department, CMDHB. For the children not evaluated at the ophthalmology department (n=140) the most common reasons were: unable to contact parents/caregivers (26%), failure to attend scheduled appointments (22%), seen by another eye care provider (9%), moved outside the area (9%) or ineligible for subsidised healthcare (8%). No information on non-attendance was available for 35 children.
Estimates of PPV, NPV, sensitivity and specificity
PPV of the B4 School Check vision screening was low (31%, 95% CIs 26% to 38%) while estimates of NPV were high (92%, 95% CI 88% to 95%). OR analysis found that increasing the referral cut-off to UVA worse than 6/12 would improve the PPV significantly (53%, 95% CI 42% to 64%) but would not lower the NPV markedly (86%, 95% CI 82% to 89%). Sensitivity for the screening was good (0.89, 95% CI 0.84 to 0.93), however, specificity was low (0.47, 95% CI 0.41 to 0.53). A large number of children (n=112) had reduced UVA at the initial eye examination, but UVA measurement normalised over time without intervention. These children were classified as false positive referrals, as no treatment was provided and UVA improved with time.
Comparison of UVA between vision screening and hospital eye assessment
There was poor agreement between UVA measured at vision screening using the Parr Chart and UVA measured at the hospital eye department using the Crowded Keeler (n=495) or Crowded Kay Picture tests (n=56). Figure 2 shows the level of agreement between UVA measurements made using the Parr Chart and the Crowded Keeler logMAR test (mean difference in UVA=−0.08±0.16 logMAR; t=−10.97, p<0.0001). Wide 95% limits of agreement (−0.39 to+0.23 logMAR) suggested the two measures did not produce equivalent results in the same cohort of children. As only a small proportion of children had UVA measured with the Crowded Kay Pictures test they were not included in the Bland-Altman analysis.
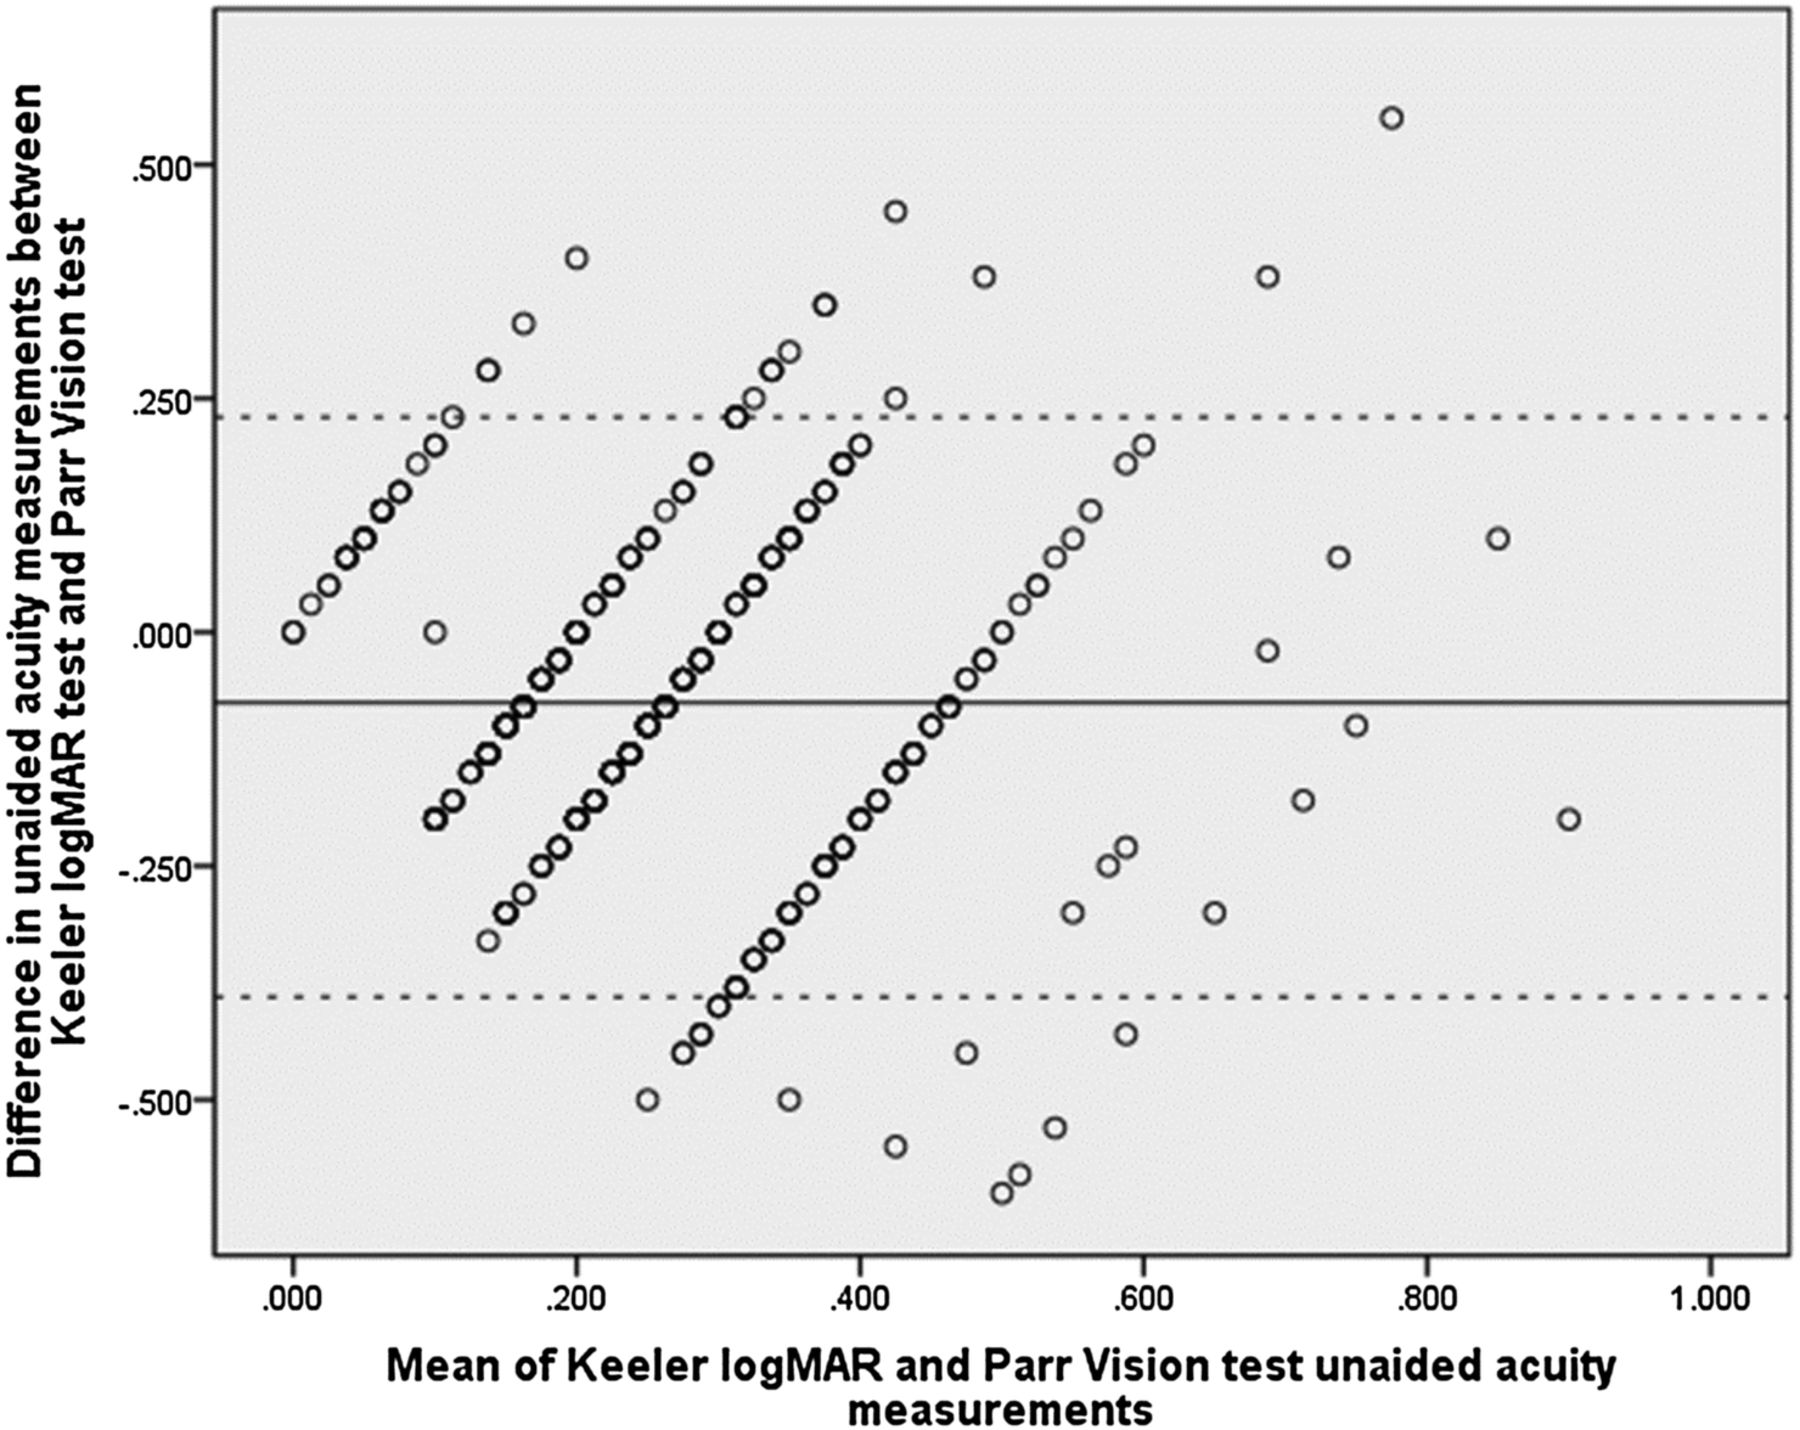
Bland-Altman analysis of unaided visual acuity (UVA) of the right eye of children screened as part of the B4 School Check (Parr Vision Test) who attended the ophthalmology department where UVA was measured with the Keeler logMAR Test. The solid black line represents the average difference between these two measures (in logMAR), while the dashed black lines show the 95% confidence limits of agreement between the two measures.
Prevalence of vision disorders in the cohort
The most common ocular diagnosis was significant refractive error (n=184, table 1), while strabismus (n=23), amblyopia (n=36) and ocular pathology (n=6) were less prevalent in this cohort of children.
Prevalence of significant refractive errors in children (n=184) referred from B4 School Check in Counties Manukau region who had visual acuity worse than 0.2 logMAR (6/9.5) in at least one eye
Reduced UVA was present at the hospital eye assessment in all children with myopia; however, 12 children with other refractive errors had UVA better than 6/9 (0.18 logMAR). Figure 3 demonstrates that that the different ocular diagnoses, including unexplained reduced UVA, had overlapping acuity levels. Therefore, UVA alone could not be used to differentiate between different visual disorders. Even when acuity was measured with standardised charts by experienced eye care providers, there was no reliable difference in UVA in children with refractive error and those with unexplained reduced UVA which normalised over time.

Boxplot representing the level of unaided visual acuity (UVA) for children with refractive errors, unexplained reduced UVA and for those discharged after the initial consultation. The width of each boxplot corresponds to the number of observations, although some children had more than one refractive diagnosis.
Overall, 230 children required ophthalmic treatment (spectacle prescription, patching or strabismus surgery) which improved acuity from 0.34±0.20 logMAR at initial assessment to 0.12±0.11 logMAR at discharge. When a success criterion of BCVA in the better eye of 6/12 (0.30 logMAR which is equal to the NZ driving standard) was applied, treatment was unsuccessful in only two children due to pathology. A further 10 children had BCVA of worse than 6/12 in the poorer eye, primarily due to poor compliance with amblyopia treatment (n=9).
Discussion
The principal finding of this study was the low PPV of the current NZ preschool vision screening; only 31% of children who were referred from vision screening had a diagnosed visual deficit. The poor PPV appeared to be primarily due to the poor specificity of the screening test and the acuity criteria used, as many visually normal children failed screening with the cut-off criterion of UVA worse than 6/9. Modelling of our data suggests UVA worse than 6/12, one line larger than the current criteria, may provide a more accurate referral cut-off. The low PPV was also due to the significant number of children (16%) who had unexplained reduced UVA at the initial hospital eye examination which normalised over time. It is unclear the reason for this reduced UVA and what processes occur that lead to acuity normalising over time. Retinal structure is fully developed by 4 years of age,18 ,19 although other aspects of the visual pathway are still developing and the effects of letter crowding may be more pronounced in children up until the teenage years.20 ,21 Other factors may also play a role in the poor specificity of the current preschool vision screening programme. For example, the Vision in Preschoolers (VIP) group has recommended 1.5 m testing distance when screening is conducted by nurses or lay screeners2 which is much shorter than the 4 m distance employed in the B4 School Check vision screening. The VIP study group has also found that testing by nurses and lay screeners was less successful compared with licensed eye-care professionals,2 although trained nurses were better at performing acuity measures than lay screeners. This suggests that additional training for vision screeners could improve outcomes from preschool vision screening in NZ. Finally our findings suggest, that while the B4 School Check reaches the majority of children in South Auckland approximately 10% of children declined vision screening and half of these children are of Māori/Pacifika ethnicity. This is consistent with Ministry of Health (NZ) data from 2011 which showed that Māori children have a risk ratio (RR) for declining vision screening of 2.7 (95% CI (2.3 to 3.1), p<0.0000001) compared to non-Māori, non-Pasifika children. Pasifika children had an RR of 3.1 (95% CI (2.7 to 3.6), p<0.0000001) compared to the same reference group, as well as a higher RR of declining screening than Māori (95% CI (1.04 to 1.33), p=0.011). Māori and Pacifika face significant barriers to healthcare including socioeconomic disadvantage,22 lack of cultural awareness in health care22 and cost of care.23 ,24 Although the B4 School Check is free, the cost of lost earnings for parents, transport and treatment (spectacle prescriptions and patching), need to be considered when identifying barriers to service utilisation.25 As such, socioeconomic factors also played a role in the uptake of preschool vision screening and the Ministry of Health 2011 B4 School Check data found the RR of declining between quintile 5 (lowest) and quintiles 1 (highest) to 3 aggregated was 2.8 (95% CI (2.4 to 3.2), p<0.0000001).
This is the first study to evaluate the efficacy of the B4 School Check vision screening since the programme was implemented throughout NZ in 2008. It involved analysis of screening results from a large number of ethnically diverse children over a 1 year period and was primarily designed to investigate the positive predicative value of the current preschool vision screening protocol. Additionally, most studies find a proportion of children (2–30%26–28) with unexplained reduced UVA that ranges although few follow these children to see if acuity improves with time. One of the strengths of this study was that these children received follow-up care and normalisation of UVA was able to be observed. PPV, NPV, sensitivity and specificity were all obtained by data modelling from children referred from the B4 School Vision Check and therefore are only estimates of the true values. Each eye was considered as an individual statistical unit, which made it possible to evaluate true positive, false positive, true negative and false negative results from the data available. Nevertheless, the use of data from both eyes of the same individual is controversial. Recent publications argue that using data from both eyes is valid, as long as appropriate inter-eye correlations are incorporated into the analysis15 ,16 ,29 and in this study was taken into account by introducing a random effect into the logistic regression model. Based on our results, approximately 4.5% of children screened had a vision deficit, which is consistent with the prevalence of vision disorders found in other studies.17 ,30 ,31 However, some studies have shown a much higher prevalence of vision problems and a recent study from the USA found 20% of 3–5 year-old children had a vision disorder.32 If the true prevalence of refractive error is closer to one in five, then our estimates of NPV, sensitivity and specificity are too low. It is possible that some children with mild-moderate hyperopia and astigmatism passed the B4 School Check vision screening and data from these children were not available for analysis.33 As data were only available from individual eyes that had ‘passed’ vision screening we were only able to estimate the false negative rate of the B4 School Check programme. Studies designed to specifically address false negative rates are required to evaluate the accuracy of our estimates.
The poor PPV and low specificity found in NZ preschool vision screening is also seen in many other screening programmes, such as breast screening 34 and newborn hearing screening.35 Improvements in the specificity of newborn hearing screening occurred by rescreening all children who failed the initial test, with 80% passing a rescreening test.36 Similarly, the Multi-Ethnic Pediatric Eye Disease Study found 25% of children had reduced UVA at initial assessment, which improved on retesting in 81% of participants.37 A similar strategy for preschool vision screening has been proposed whereby those children with reduced vision at screening should undergo a full refractive examination before referral to hospital eye services.38 Alternatively evaluating the use of other acuity charts for performing preschool vision screening in NZ may be warranted. There was poor agreement between UVA measurements with the screening test and the acuity chart used by hospital staff to assess vision. The difference between the results for the two charts is likely to be due to a combination of: (1) differences between the tests themselves for example, the absence of a 0.1 logMAR line on the Parr Chart, (2) the different training levels of the staff administering the tests and (3) different testing environments. While our study design does not allow us to identify which of these was the most important factor, the results indicate that the screening and clinical tests should be made as similar as possible to minimise false positive referrals. Other studies show higher specificity (61%3 to 68%39) using alternative acuity charts when sensitivity was set to a similar level (90%) as that found in the current study, and this may reflect unequal progression of letter sizes and the absence of the 6/7.5 (0.1 logMAR) line on the NZ screening test.
The PPV of preschool vision screening in South Auckland, NZ was low, with many visually normal children referred due to the poor specificity of the current B4 School screening protocol. This has significant implications for the healthcare system, by putting an unnecessary burden on hospital eye departments. Altering the referral criteria, to refer children with UVA worse than 6/12, improved the PPV without affecting the NPV and this simple solution should be further investigated. In school-aged children, with more advanced cognitive development and attention levels than the preschool children who were the focus of the present study, acuity of 6/9.5 (0.2 logMAR) is rarely associated with a visual problem that requires treatment.40 ,41 Internationally, a variety of acuity cut-offs are employed for vision screening; a recent vision survey in East Timor found that only 0.2% of students with a significant refractive error passed a screening using a 6/12 Tumbling E target.42 In a Native American population with a high prevalence of astigmatism, the highest sensitivity(97%) and specificity (79%) was found with a fail criteria of UVA worse than 6/19 combined with automated measures of corneal curvature.43
Data modelling suggested that both the NPV and sensitivity of vision screening were high. However, as data were only available from children who were referred from vision screening, analysis of NPV, sensitivity and specificity relied on utilising data from both eyes of each child, taking into account the correlation between the two eyes. While this should not affect our estimates of PPV, a large scale study of vision disorders in NZ children and prospective evaluation of preschool screening protocols is needed to find the actual prevalence of eye conditions in NZ and provide accurate estimates of NPV, sensitivity and specificity of the B4 School Check.
Acknowledgments
The authors thank Associate Professor Robert Jacobs and Dr John Phillips for commenting on an earlier draft of this manuscript.
References
Footnotes
Contributors MAL-S, BT and NSA designed the study; MAL-S collected data; ACV and VB performed the analysis; MAL-S and NSA drafted the manuscript and all authors approved the final version to be published.
Funding This work was supported by the Arthur D Bronlund Trust, CCRep and University of Auckland Faculty Research Development Fund Grants (3704420).
Competing interests None declared.
Ethics approval This study received ethics approval from the Northern X Regional Ethics Committee (NZ).
Provenance and peer review Not commissioned; externally peer reviewed.
Data sharing statement Additional data can be accessed via the Dryad data repository at http://datadryad.org/ with the doi:10.5061/dryad.ht357.