Article Text

Abstract
Objectives This study examines palliative care (PC) coding practices since the introduction of a national coding standard and assesses a potential association with hospital standardised mortality ratio (HSMR) results.
Setting Acute-care hospitals in Canada.
Participants ∼16 million hospital discharges recorded in Canadian Institute for Health Information (CIHI)'s Discharge Abstract Database from April 2006 to March 2013.
Primary and secondary outcome measures In-hospital mortality, patient characteristics and service utilisation among all hospitalisations, HSMR cases and palliative patients.
Methods We assessed all separations in the Discharge Abstract Database between fiscal years 2006–2007 and 2012–2013 for PC cases at national, provincial and facility levels. In-hospital mortality was measured among all hospitalisations (including HSMR cases) and palliative patients. We calculated a variant HSMR-PC that included PC cases.
Results There was an increase in the frequency of PC coding over the study period (from 0.78% to 1.12% of all separations), and year-over-year improvement in adherence to PC coding guidelines. Characteristics and resource utilisation of PC patients remained stable within provinces. Crude mortality among HSMR cases declined from 8.7% to 7.3%. National HSMR declined by 22% during the study period, compared with a 17% decline in HSMR-PC. Provincial results for HSMR-PC are not significantly different from regular HSMR calculation.
Conclusions The introduction of a national coding standard resulted in increased identification of palliative patients and services. Aside from PC coding practices, we note numerous independent drivers of improving HSMR results, notably, a significant reduction of in-hospital mortality, and increase in admissions accompanied by a greater number of coded comorbidities. While PC impacts the HSMR indicator, its influence remains modest.
- HSMR
- Clinical coding
- Hospital mortality
- Health services research
- PALLIATIVE CARE
This is an Open Access article distributed in accordance with the Creative Commons Attribution Non Commercial (CC BY-NC 4.0) license, which permits others to distribute, remix, adapt, build upon this work non-commercially, and license their derivative works on different terms, provided the original work is properly cited and the use is non-commercial. See: http://creativecommons.org/licenses/by-nc/4.0/
Statistics from Altmetric.com
Strengths and limitations of this study
This study examines all Canadian hospitalisations over 7 years (∼16 million hospital discharges).
Sensitivity analysis is performed using a variant HSMR that includes palliative cases.
Additional explanatory factors beyond coding frequency are investigated.
The usual limitations of analysing administrative data apply.
Introduction
In 2005, the Canadian Institute for Health Information (CIHI) began examining palliative care (PC) coding practices associated with discharge abstract data received from hospitals across Canada. At the time, there were wide variations in local coding practices for PC patients, largely due to the absence of a formal coding standard for palliative services. Little corrective action had been taken, mainly because the data were not used to produce performance indicators. Shortly after, when CIHI was in the exploratory phase of introducing its hospital standardised mortality ratio (HSMR) indicator, which is clearly affected by the inclusion of PC patients, PC coding came under greater scrutiny.
PC is a branch of medicine whose main goal is to reduce patient discomfort. It is also referred to as end-of-life care, comfort care, supportive care and compassionate care.1 While PC is predominantly associated with incurable conditions, it can also apply to reversible ailments. The need for palliation can be identified any time during a hospital stay. Furthermore, palliation can be delivered regardless of whether there are designated PC beds, units or delivery teams. Pain control unaccompanied by other palliative services is not considered palliation.
Accurate measurement and record-keeping is fundamental to improving hospital care and to reporting indicators of health system performance. To fully understand the extent of PC delivery in Canada, we require precise and detailed notations of patient characteristics and clinical interventions. In Canada, the Canadian Coding Standards for ICD-10-CA and Canadian Classification of Health Interventions (CCI) prescribes standard definitions to identify and capture PC patients in clinical administrative databases.
During development of the HSMR, CIHI conducted stakeholder consultations, methodological investigations, pilot-testing and literature reviews regarding whether or not to include PC patients in HSMR calculations. CIHI was not the only producer of an HSMR grappling with this issue. British counterparts first introduced an HSMR without risk-adjustment for PC patients but, in 2004, reversed their decision in response to the concerns of hospitals with palliative units.2 Two of four entities producing hospital mortality rates in the USA exclude PC encounters from their calculations.3 In the end, CIHI excluded PC patients from HSMR calculations but recognised the need to implement a national coding standard on PC. To address this need, the National Coding Advisory Committee released an interim PC coding bulletin on 1 October 2007, followed by a national coding standard effective 1 April 2008.
Traditionally, it takes time for changes in coding standards to be reflected in abstracted clinical administrative data. During development of the HSMR, hospitals were sent results of their PC coding to aid education efforts. Likewise, discharge abstract coders received targeted professional education so they could conform to the new national coding standard.
Additionally, with the introduction of the HSMR, many facilities and regions instituted programmes to improve overall clinical documentation. Historically, in-hospital patient care documentation focused on the delivery of care, and less so on the use of abstracted data for performance indicators. Given the transparency that public reporting of the HSMR generates, a greater focus was placed on the completeness as well as the accuracy of the data being submitted. One initiative to address this divide was the introduction of the concept of Clinical Documentation Improvement (CDI) and the training of CDI specialists to guide physicians regarding the impact of patient charting on the capture of significant comorbidities.
Two data quality assurance protocols were also introduced as a result of the new PC coding standard. The first ensures that abstracts with PC as the most responsible diagnosis (MRDx) also include a secondary diagnosis. The second states that the ICD-10-CA code Z51.5 Palliative care must not be assigned as a post-admission comorbidity.1
In this paper, we explore the following research questions:
the extent of PC coding in Canada and adherence to the coding standard,
patient case-mix changes and resource utilisation across all hospitalisations, PC and HSMR cases,
rates of mortality in and out of hospital,
changes in HSMR results over time, and
variation in HSMR results when including PC cases.
Methods
Using the Discharge Abstract Database (DAD), we analysed all inpatient acute care hospitalisations (n∼2.4 million/year) in Canada between fiscal years 2006–2007 and 2012–2013. Owing to differences in coding standards, our study excluded PC cases from Quebec, however, inpatient hospitalisations from the province are included in HSMR risk-adjustment and baseline calculations. Prince Edward Island, Yukon, the Northwest Territories and Nunavut were excluded from provincial/territorial analysis due to small counts, however, their cases were included in national and facility-level analyses.
ICD-10-CA code Z51.5 Palliative care on a patient discharge abstract was used to identify patients who fulfilled the standardised criteria for PC diagnoses. We analysed all records, as well as a subset of those containing Z51.5.
We calculated crude percentage of discharges that had PC diagnosis code Z51.5 coded as the MRDx, preadmit comorbidity (type 1) and service transfers (types W, X and Y). To examine potential changes in the characteristics of PC patients over time, we assessed age, disease burden (using the Charlson Comorbidity Index) and resource utilisation (resource intensity weight (RIW), alternate level of care (ALC) days and length of stay (LOS)). We also assessed adherence to the coding standard following the introduction of new coding guidelines.
We used vital statistics from Statistics Canada CANSIM tables4 ,5 to report mortality trends in and out of hospital. Additionally, we reviewed complementary in-hospital mortality indicators (following acute myocardial infarction and stroke) to examine changes over time.
HSMR methodology
The HSMR is the ratio of observed deaths to expected deaths, multiplied by 100. We used CIHI HSMR methodology V.4.0 and the reference year 2009–2010 for this study. Seventy-two diagnosis groups, accounting for about 80% of all inpatient mortality in Canada, are included in HSMR calculations. Records coded with one of the 72 diagnosis groups as the MRDx qualify as HSMR cases. To ensure meaningful comparison of stable results, facility-level analysis was restricted to hospitals with a minimum of 1000 HSMR cases in each data year between 2006–2007 and 2012–2013.
To determine the impact of PC cases on HSMR, we created a 73rd diagnosis group within HSMR calculation methodology to account for PC cases coded as MRDx. All other HSMR calculation methods remained constant in order to control for only the inclusion of PC cases. The results of this sensitivity analysis are reported as HSMR-PC. We performed a linear regression test to assess similarities in provincial trends of HSMR and HSMR-PC.
The Charlson Index is one of six HSMR risk-adjustment variables; it takes into account preadmission diagnoses. The Charlson Index is an overall comorbidity score that has been shown to be highly and positively associated with mortality, and has been widely used in clinical research.6 Detailed methodology on HSMR calculation is available elsewhere.7
Canadian Coding Standards define comorbidity as a condition that is present at the time of admission or that subsequently develops and meets at least one of the following conditions: requiring treatment beyond maintenance of the pre-existing condition, increases the LOS by at least 24 h, or significantly affects the treatment received. In all instances, assignment of a comorbid diagnosis type must be supported by physician documentation.1
Statistical analyses were run on SAS V9.2 (SAS Institute Inc, Cary, North Carolina, USA) and R V.3.1.2 (R Foundation for Statistical Computing, Vienna, Austria).
Results
PC coding changes from 2006–2007 to 2012–2013
Beginning in 2006–2007, the percentage of all hospitalisations coded with an MRDx of PC varied across provinces from 0.5% to 1.4% (figure 1). After years of fluctuation in provincial PC coding rates, the introduction of coding standards in 2008–2009 led to mostly stabilised rates, beginning in 2009–2010. The Atlantic provinces of Newfoundland and Labrador and Nova Scotia, which have small populations and few facilities, accounted for the largest increase and the greatest volatility in PC coding. Between 2010–2011 and 2012–2013, provincial rates of PC coding in the MRDx field mostly declined or remained stable (except in Newfoundland and Labrador). The percentage of PC cases as a proportion of in-hospital deaths mirrors the trend of overall PC coding. We observe an increase during the guideline uptake period, and a subsequent plateau beginning 2009–2010 (see online supplementary table S1 and figure A).

Provincial palliative care coding trends. Percentage of records with palliative care coded as MRDx. MRDx, most responsible diagnosis.
The percentage of abstracts with a PC code appearing as a comorbidity diagnosis (type 1, W, X or Y) more than doubled (138%, p<0.001) between 2006–2007 and 2009–2010, with an insignificant increase (22%, p=0.368) from 2009–2010 to 2012–2013.
To assess adherence to PC coding standards, we examined a subset of records where the MRDx of PC was assigned without any secondary diagnosis code (table 1). Comparing 2006–2007 and 2012–2013, instances of these records dropped sharply, from 201 to 29/10 000 records. Instances where PC was assigned as a postadmission comorbidity also dropped from 52 to 6/10 000 PC records.
Descriptive statistics of all DAD, HSMR and palliative care records/cases
Analysis of the PC cohort revealed consistent patient-level characteristics of LOS and RIW (table 1). With similar trends in DAD records and HSMR cases, the mean age of PC patients also increased (from 70.4 to 73.4 between 2006–2007 and 2012–2013). Total ALC days of PC patients rose sharply during the new coding adoption phase between 2006–2007 and 2009–2010, but plateaued thereafter. Provincial breakdowns of variables are contained in online supplementary table S1. These findings indicate a relatively homogenous PC patient cohort throughout Canada and provincial consistency during the study period.
Mortality in Canada
Vital statistics were analysed for mortality trends in and out of hospital. Comparing 2000 with 2011, total deaths in Canada increased from 218 062 to 242 074 (see online supplementary table A).4 While crude mortality rates in Canada remained stable (711/100 000 population in 2000; 705/100 000 population in 2011) (see online supplementary figure B), we observed an 11% decrease (from 512 to 456/100 000 population) of in-hospital mortality. This illustrates the increasing trend of Canadians dying out of hospital, with a concurrent decline in the proportion of in-hospital deaths between 2000 and 2011.
Crude mortality among all hospitalisations declined between 2006–2007 and 2012–2013 from 3.52% to 3.45%. Among all HSMR cases, crude mortality declined from 8.7% in 2006–2007 to 7.3% in 2012–2013. There is an inverse trend of increased crude mortality in the PC cohort from 67.1% to 69.9%.
HSMR
Nationally, the HSMR declined by 22% between 2006–2007 and 2012–2013. HSMR results improved for all provinces, with the largest improvements seen in Ontario (31 points, from 120 (95% CI 118 to 121) to 89 (95% CI 88 to 90)), Nova Scotia (27 points, from 133 (95% CI 128 to 138) to 106 (95% CI 102 to 110)), Newfoundland and Labrador (24 points, from 134 (95% CI 127 to 141) to 110 (95% CI 104 to 116)) and British Columbia (23 points, from 108 (95% CI 106 to 110) to 85 (95% CI 84 to 87)) (figure 2). Provincial reductions in crude mortality among HSMR cases for the same time period were highest in Ontario (−20.3%) Nova Scotia (−17.7%) and Manitoba (−14.8%).

Change in provincial HSMR relative to 2006–2007 (set at 0). HSMR, hospital standardised Mortality Ratio.
From 2009–2010 to 2012–2013, there was a positive correlation between reduction in crude mortality among DAD records and improvement in HSMR rates among all provinces except Newfoundland and Labrador (correlation coefficients: Newfoundland and Labrador, −0.80; Nova Scotia, 0.87; New Brunswick, 0.77; Ontario, 0.79; Manitoba, 0.82; Saskatchewan, 0.79; Alberta, 0.66; British Columbia, 0.92).
In addition to a reduction in crude mortality, we observe changes in risk-adjustment variables included in the HSMR model. Increases in patient population groups with more pre-admission conditions led to a higher likelihood of expected in-hospital mortality. There are pronounced trends when comparing Charlson Index groups over time (figure 3). Provincial results show consistent declines in HSMR cases without comorbidities (Charlson group 0). Increases in Charlson groups 1 and 2 indicate a greater proportion of patients with significant comorbidities.

Percentage of HSMR cases within each Charlson group by province. HSMR, hospital standardised mortality ratio.
Another risk-adjustment variable that contributed to a decrease in the HSMR is patient age at admission, which has increased over time (table 1). With constant model coefficients, increases in patient age led to higher values of expected death, resulting in HSMR improvement.
Although all provinces have improved HSMRs, not all have shown increases in PC coding (figure 1). British Columbia had a lower PC coding percentage in 2012–2013 (1.08%) than in 2006–2007 (1.18%). Between 2009–2010 and 2012–2013, British Columbia, Manitoba and New Brunswick all had lower rates of PC coding than in previous years. Ontario and Saskatchewan are the only provinces that showed a slight increase between 2009–2010 and 2012–2013 compared with the period 2006–2007 and 2008–2009.
To explore the association between change in HSMR and PC coding at the facility level, we observed a weak correlation year-over-year (between −0.05 and −0.21) between 2006–2007 and 2012–2013 for (n=142) facilities that met the criterion of 1000 HSMR cases in each data year.
To further examine in-hospital mortality, and to determine whether HSMR trends are similar to those for other health system performance indicators, we examined two other in-hospital mortality indicators that have shown considerable declines over a similar study period. Between 2006–2007 and 2011–2012, 30 day in-hospital mortality following acute myocardial infarction8 declined by 25.5% (from 9.4% to 7%), while 30 day in-hospital mortality following stroke8 declined by 18.3% (from 18% to 14.7%) (see online supplementary figure C).
Sensitivity analysis when including PC cases into HSMR calculation
We performed sensitivity analysis to determine the extent PC coding may influence HSMR results if included in the calculation methodology, and denote it by HSMR-PC.
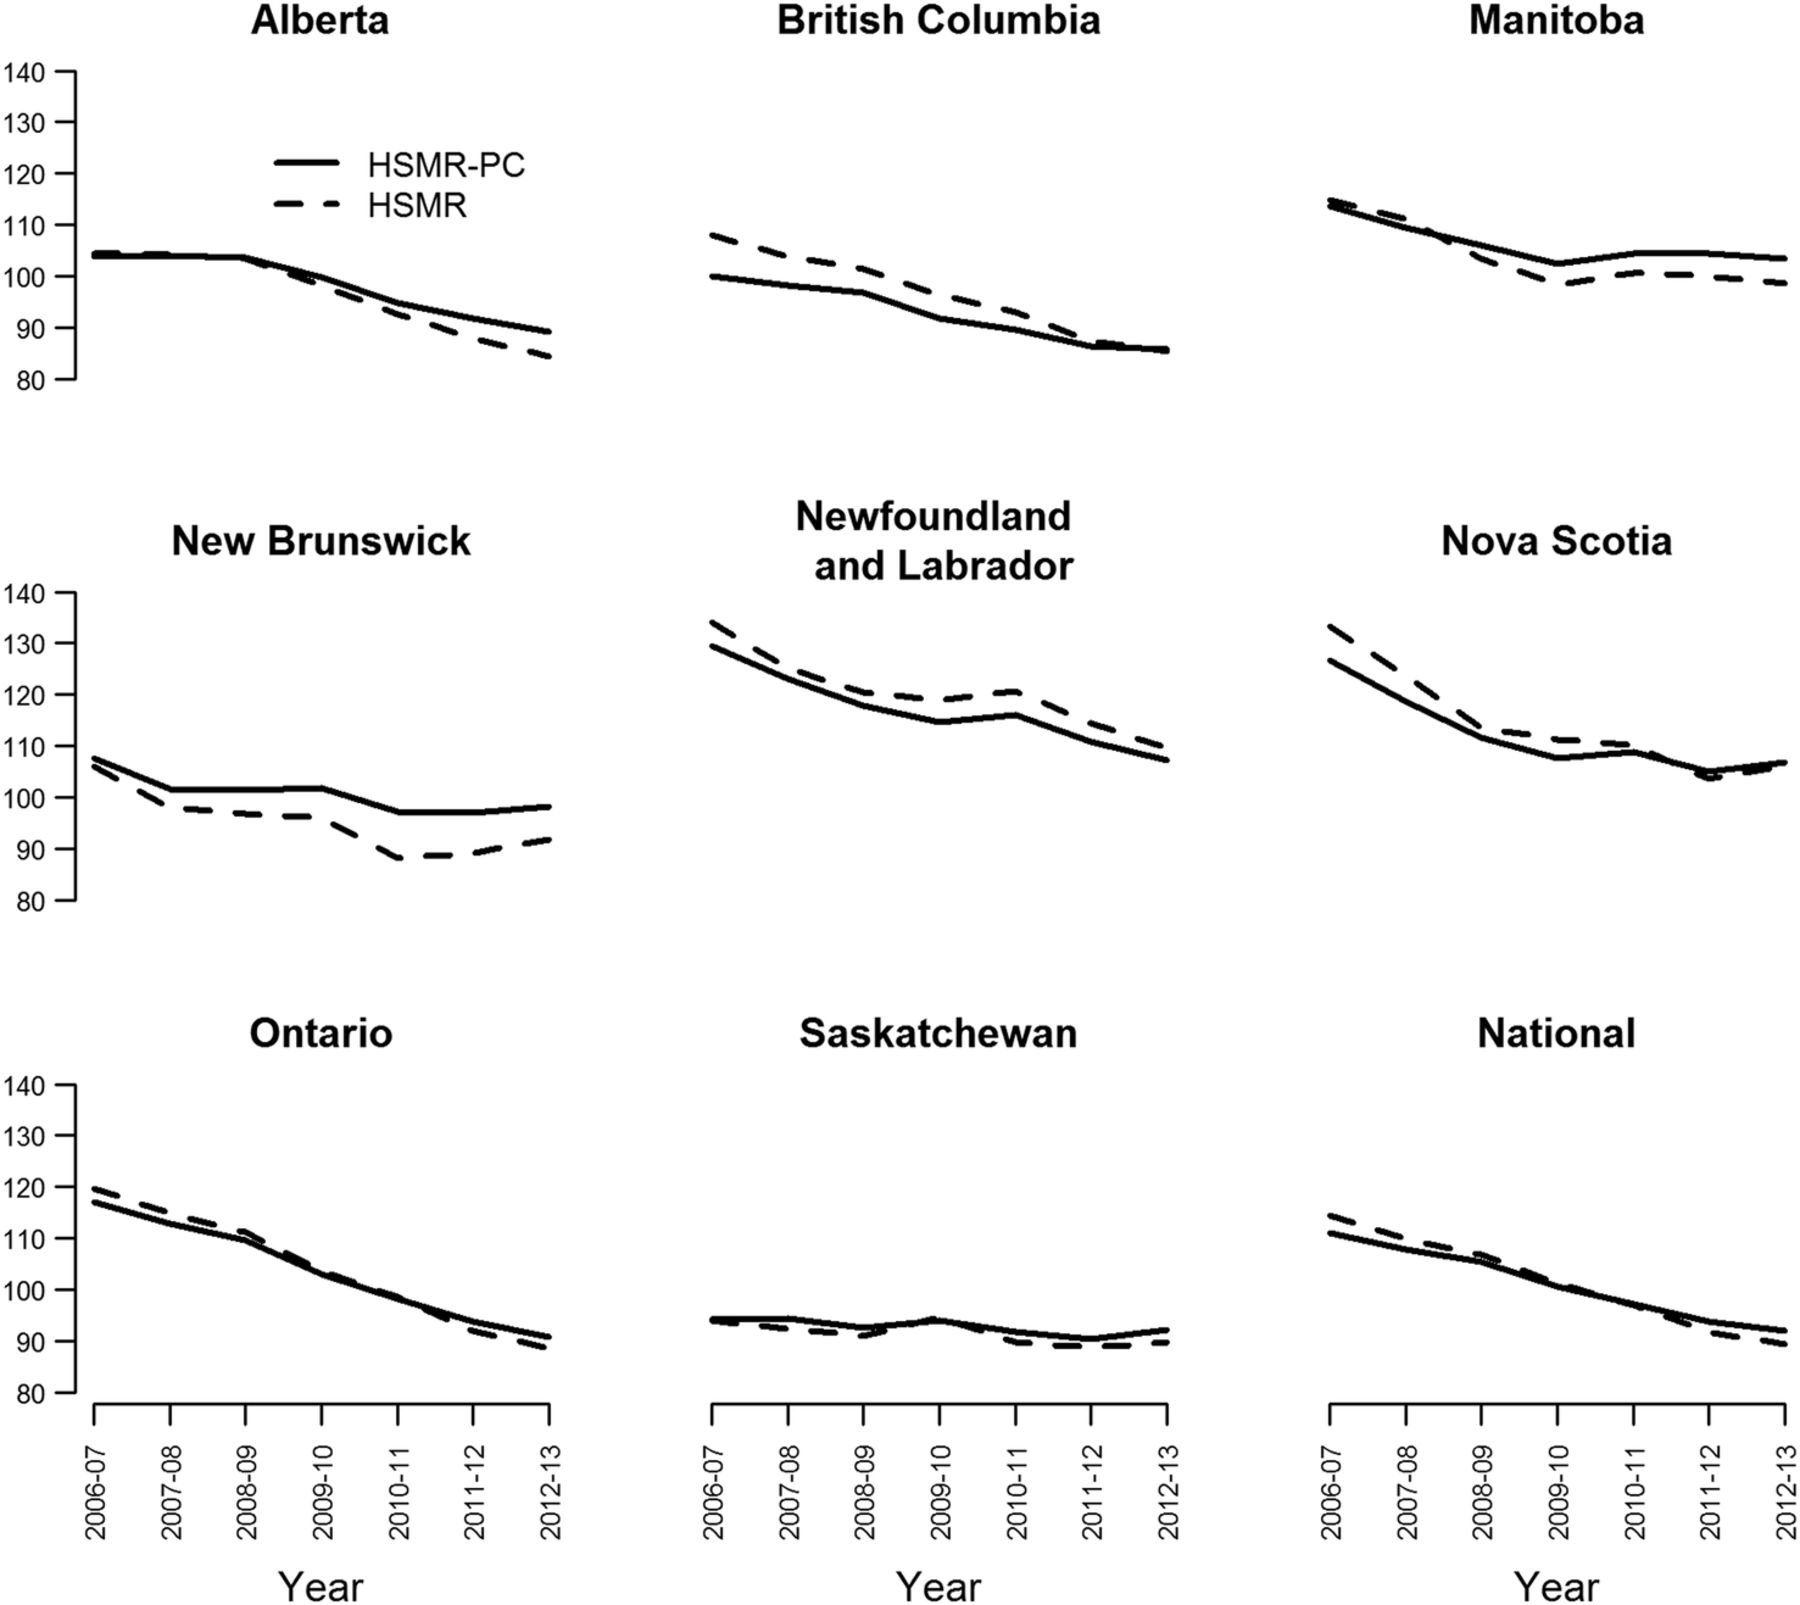
At the national level, HSMR-PC declined by 17.2% (from 111 in 2006–2007 to 92 in 2012–2013), compared to a 22% decline in regular HSMR (from 114 in 2006–2007 to 89 in 2012–2013). Adjustment for PC cases resulted in an increase of 2.6 points in national HSMR for 2012–2013. We observe no significant differences when comparing provincial results of HSMR and HSMR-PC (see figure 4). Analysing eight provinces over seven data years, we note four instances (7%) of non-overlapping CIs between HSMR and HSMR-PC results. A linear regression test shows that regular HSMR and HSMR-PC provincial trends are not significantly different for all provinces.
Provincial and National HSMR results with and without inclusion of palliative care cases. HSMR, hospital standardised mortality ratio.
Furthermore, positioning of provinces remained relatively constant when comparing HSMR and HSMR-PC. For example, in 2012–2013, in either calculation scenario, British Columbia, Alberta and Ontario remain as the top three provinces with the lowest HSMR. Similarly, both calculation methods produce highest HSMR results for Manitoba, Nova Scotia and Newfoundland. This illustrates an insignificant impact on relative positioning at the provincial level when including PC cases in HSMR calculation methodologies.
Discussion
Our analysis sheds light on the extent and quality of PC coding in Canada. PC coding increased in Canada after the introduction of the national coding standard (interim in October 2007 and permanent in April 2008), which reflects an expected outcome of the uptake of the new coding standard and intensive coder education. Traditionally, it takes time for changes in coding standards to be fully reflected in abstracted clinical administrative data. The percentage of PC cases coded has plateaued in recent years. Our study showed that adherence to the PC coding standard has improved since it was introduced in 2008. The proportion of records where an MRDx of PC was coded without any secondary diagnosis has dropped sharply over the years. Instances where PC was assigned as a post-admission comorbidity have also dropped. Moreover, a reabstraction study of the 2007–2008 DAD data showed that 92.8% (95% CI 91% to 95%) of hospitalisations in which PC was recorded were confirmed by the second independent coder; this increased to 96.4% (95% CI 95% to 98%) for a similar study on the 2009–2010 DAD data.9 ,10
Clinical administrative databases such as the DAD have several uses, with health system reporting being only one. Prior to 2007, the PC code was not routinely part of the methodology used to produce health system performance indicators in Canada. Therefore, it was not a priority (nor a mandatory requirement) for hospitals to ensure standardisation of coding for such cases. For this and other reasons, it is likely that there was under-coding of PC patients prior to the introduction of the HSMR.
The decision to include or exclude PC patients from the HSMR indicator is a contested subject with some studies concluding that excluding PC patients from HSMR calculations will artificially improve results,11 ,12 even though sensitivity analyses have found minimal overall differences in HSMR results when comparing those that include and exclude these cases.2
A recent Canadian study by Chong et al13 suggests that PC coding may have been manipulated since the introduction of public reporting of HSMR. Our analysis confirms that rates of HSMR improvement are slower when PC cases are included into the model. However, adjustment for PC cases explains no more than a quarter of the overall HSMR improvement. We found no evidence to suggest measurable manipulation of PC coding on the HSMR.
We report on numerous independent factors that also contributed to improving HSMR. Our alternative conclusion on the importance of PC coding on HSMR is supported by more granular and comprehensive analyses. By examining beyond 2009–2010 up until 2012–2013, we show a clear and consistent plateau of PC coding. The trajectory of increased PC coding clearly occurs during the PC guideline adoption phase, and stabilises beginning 2009–2010 up until 2012–2013.
While Chong et al suggest that hospitals have dramatically increased PC coding since public reporting of HSMR, our study arrives at a different conclusion. Our analyses demonstrate that throughout the study period, there was no consistent increase of PC coding across all provinces. Analysis at the provincial level illustrates that select provinces maintained a low rate of PC coding or even lowered their rate throughout the study period. It is possible that Chong et al's use of a 2004–2005 baseline year, when stable coding of PC cases had not yet been achieved, overestimated the influence of PC on improving HSMR results in Canada.
Complementary health system performance indicators and vital statistics confirm that substantially fewer Canadians are dying in hospital. Furthermore, we noted an increase in the database capture of comorbidities, which could be partly explained by improved coder and physician education via CDI initiatives. Such pronounced trends towards recording and managing more complex cases of patients with multiple chronic conditions ultimately lead to a higher calculated probability of death. These, in conjunction with lower observed rates of in-hospital mortality, are significant drivers of improving HSMR results. Nonetheless, we continue to recognise and acknowledge that for some hospitals, PC coding may play a larger role in HSMR improvements. Owing to the limitations of administrative abstract data in definitively determining the appropriateness of a patient's PC diagnosis in terms of his or her clinical severity and the services and interventions received, we are unable to clearly identify the manipulation of PC coding. However, our current analyses and previous reabstraction studies9 ,10 indicate that any potential manipulation of data may occur in only an inconsequential number of facilities. Further research is required to precisely quantify the changes and effects of risk-adjustment variables included within the HSMR model.
There is no question that coding precision is a continuous refinement process. As particular health topics become more significant, attention and effort are directed toward providing the most accurate and authoritative reflection of these in the context of Canadian health services. There are rigorous standards and legal agreements for hospitals to report accurate records on the patients they treat. Analyses such as this study are one way to monitor the uptake and impact of changes in coding standards and the impact on the resulting data abstracted by hospitals. The impetus behind developing the HSMR indicator was to provide facilities and health system decision-makers with the ability to track their hospital's mortality over time. This big-dot indicator is designed to be unpacked to hone in on certain patient groups, disease categories and diagnosis groups to understand which patient populations are driving their HSMR results, with a view to assessing the quality of care these patients are receiving. With the understanding that no single indicator is perfect, the HSMR framework still allows for a starting point in the quality assessment journey, provided that patient groups are accurately identified and reflected in the measure.
Results of our analysis can be summarised into five main findings:
Quality of PC coding has improved year-over-year.
PC patient characteristic trends are consistent within provinces.
In-hospital mortality has declined substantially.
HSMR results show consistent improvement across provinces for factors beyond PC coding.
Inclusion of PC cases into the model results in minimal HSMR differences at the provincial level.
Strengths and limitations
CIHI has inherent advantages and strengths in conducting this type of study; these include the ability to analyse all Canadian hospitalisations (n∼16 million records) over seven fiscal years, not just those considered HSMR cases, which allows us to compare patient characteristics and resource utilisation against a non-palliative population. Our study additionally examined adherence to the national PC coding standard.
PC cases from Quebec were excluded from this analysis due to differences in coding standards. Quebec is currently discussing the introduction of coding standards that would align it with other jurisdictions in Canada. Prince Edward Island, Yukon, the Northwest Territories and Nunavut were excluded from provincial/territorial analyses due to low counts and unstable results; however, their cases were included in national and facility-level analyses. There are inherent limitations in the use of administrative abstraction data, particularly for the calculation of mortality indicators. Application of algorithms are limited to available variables within administrative databases, and therefore cannot entirely account for patient severity or comorbidities.14
Supplementary materials
Supplementary Data
This web only file has been produced by the BMJ Publishing Group from an electronic file supplied by the author(s) and has not been edited for content.
- Data supplement 1 - Online supplement
Footnotes
Contributors OF participated in the design of the study, performed data analysis, drafted the manuscript and interpreted results. JEA initially conceived of and designed the study, performed data analysis, assisted with drafting of manuscript, and interpreted results. VH participated in the design of the study, performed data analysis, assisted with drafting of the manuscript and interpreted results. ZC participated in the design of the study, assisted with drafting of the manuscript, and interpreted results. KL initially conceived of and designed the study, assisted with drafting of the manuscript, and interpreted results. YG participated in the design of the study and interpreted results. All authors reviewed and approved the final version.
Funding This research received no specific grant from any funding agency in the public, commercial or not-for-profit sectors.
Competing interests None declared.
Provenance and peer review Not commissioned; externally peer reviewed.
Data sharing statement HSMR results for facilities that meet public-reporting criteria are available at http://yourhealthsystem.cihi.ca/. HSMR results for non-reportable facilities and palliative care coding rates are available upon request. All requests are subject to CIHI privacy policies, please write hsmr@cihi.ca.