Article Text

Abstract
Objective To examine if streamlining a medical research funding application process saved time for applicants.
Design Cross-sectional surveys before and after the streamlining.
Setting The National Health and Medical Research Council (NHMRC) of Australia.
Participants Researchers who submitted one or more NHMRC Project Grant applications in 2012 or 2014.
Main outcome measures Average researcher time spent preparing an application and the total time for all applications in working days.
Results The average time per application increased from 34 working days before streamlining (95% CI 33 to 35) to 38 working days after streamlining (95% CI 37 to 39; mean difference 4 days, bootstrap p value <0.001). The estimated total time spent by all researchers on applications after streamlining was 614 working years, a 67-year increase from before streamlining.
Conclusions Streamlined applications were shorter but took longer to prepare on average. Researchers may be allocating a fixed amount of time to preparing funding applications based on their expected return, or may be increasing their time in response to increased competition. Many potentially productive years of researcher time are still being lost to preparing failed applications.
- STATISTICS & RESEARCH METHODS
- HEALTH ECONOMICS
This is an Open Access article distributed in accordance with the Creative Commons Attribution Non Commercial (CC BY-NC 4.0) license, which permits others to distribute, remix, adapt, build upon this work non-commercially, and license their derivative works on different terms, provided the original work is properly cited and the use is non-commercial. See: http://creativecommons.org/licenses/by-nc/4.0/
Statistics from Altmetric.com
Strengths and limitations of this study
This is the first research to examine whether simplifying a research funding application process saves time for applicants.
Time spent preparing applications may be driven by competition or the expected financial return rather than the number of pages to complete.
Many potentially productive years of researcher time are still being lost to preparing failed applications.
The two surveys were not random samples and responses from the same participant were not linked.
Introduction
Applying for research funding is time-consuming and often ends in failure. Our previous research found that over five centuries of researchers’ time went into just one funding round for the major health and medical research scheme in Australia,1 and that for most researchers the process is stressful and impacts on work and family life.2 As success rates are often between 10% and 20%, this means that many productive research days are lost, which adds to the research community's sense of frustration.
The lost productivity of Australian researchers was picked up the two major Australian political parties and cutting the application time became official policy of the current government.3 The National Health and Medical Research Council (NHMRC) of Australia began streamlining their Project Grant application process in 2014. The number of data fields in the online form was reduced from 180 to 68.2 Applications were around 50 pages long for the streamlined system compared with 100 pages for the old system.
To see if the streamlined application process saved time we repeated our 2012 survey of Australian health and medical researchers in 2014. Our survey was only concerned with Project Grants which are the biggest national source of funding for new medical research in Australia. In 2014 there were 3810 applications with a budget of $458 million (£246 million).4
Methods
Survey methods
We used an online cross-sectional survey in 2012 before the streamlining and repeated the time spent questions from this survey in another online cross-sectional survey in 2014 just after the streamlined application round. In March 2012 and March 2014 (just after the funding round closed) email invitations to participate in the surveys were distributed to the Australian research community through existing networks from previous studies.1 ,2 The target group was researchers who had applied for NHMRC Project Grant funding. Researchers responded from March to May 2012 and March to April 2014, and took 10–20 min to complete the survey depending on how many additional comments they provided.
Our surveys were emailed via distribution lists as privacy considerations prevented the construction of a sampling frame from official sources. The only publicly available information is the list of previous Project Grant winners, but this would be biased towards more successful researchers.
Survey questions
In both surveys researchers were first asked how many applications they had submitted. Then for each application they were asked: their position on the application (first, second, etc), how much time they spent (in working days), and whether the application was new or a resubmission. Researchers were asked to estimate the time in full working days of 7.5 h, and to include time spent on weekends. This time could include: background reading, analysing pilot data, writing the application and the budget, attending meetings about the application, and entering data into the online submission form.
In the first survey we asked researchers to give their salary (in a range) so that we could cost their time. Owing to large amounts of missing data for the salary question we changed this in later surveys to academic position, from which salary can be estimated. To compare our two surveys we assume a salary above $140K indicates a professor.
In the second survey we asked researchers if they thought the new streamlined process was better than the old system. We also asked researchers to comment on their experience with the streamlined process.
Statistical methods
To investigate representativeness we compared our sample of researchers to the wider population of all researchers who applied using location and success rate.
We used a bootstrap procedure to estimate the mean time per application and the mean time for all applications.5 We used the bootstrap in order to convert the estimated times of individual researchers into estimated times per application involving multiple researchers as illustrated in figure 1. For each bootstrap application we first randomly generated the number of researchers from 1 to 10 using the observed frequency distribution from successful applications in 2013. We then randomly generated whether the application was a resubmission or not using a Binomial distribution based on data from our 2012 survey. We then randomly sampled researcher times conditional on the position of the researcher and whether it was a resubmission. We created times for 3727 applications, which was the number submitted in 2012. We calculated the average time per application and the time for all 3727 applications. We repeated the simulation 10 000 times and generated means, bootstrap CIs and bootstrap p values for the time per application and overall times.

Illustration of the bootstrap procedure for estimating total application time from individual researcher times where n is the total number of responses from researchers and P is the total number of applications submitted to the NHMRC.
The number of applications in 2014 was 3810 (2% more than 2012), but we use the 2012 number for both years so that the overall times before and after streamlining are independent of the increase in application numbers.
In our previous analysis we used a formula to estimate the time for all applications.1 We used the bootstrap here instead of a formula because it provides a distribution free method for estimating the uncertainty in the mean and hence comparing the mean times before and after streamlining. The estimated mean times from the bootstrap and the formula differed by only 0.5%.
To graphically compare the time spent on applications we smoothed the density of times before and after streamlining using a binned kernel density estimate with a bandwidth of 5 days.6 To simplify the comparison we only used the times of the lead researcher, and these researchers usually contribute the most amount of time. To compare the time spent by all researchers we used boxplots of time before and after streamlining by researcher position (first, second, third, etc). We tabulated the mean times by resubmission and researcher position, and estimated the mean difference and 95% CI using a regression model with a random intercept to adjust for multiple responses from the same researcher.
For the satisfaction question, we present mean percentages together with 95% CIs assuming a Binomial distribution.
The R package (V.3.0.2) was used for all analyses.
Results
Sample characteristics
The characteristics of the researchers and their applications are in table 1. Our sample was under-representative of the Go8 (eight leading universities in Australia), but the success rate of our sample in 2012 was the same as the observed success rate. The two samples were reasonably similar in terms of salary or academic level, and the percentage resubmissions. The average number of applications per researcher was 2.2 in 2012 and 3.1 in 2014, an increase of 0.9 (95% CI 0.7 to 1.1). The percentage of lead researchers decreased by 7% between 2012 and 2014 (95% CI 0.8% to 13.1%).
Characteristics of surveyed researchers and their applications, and information from the National Health and Medical Research Council (NHMRC) where available
Application time
The average time spent on applications increased after streamlining. The average time per application increased from 34 working days (95% CI 33 to 35) to 38 working days (95% CI 37 to 39; 4-day increase, bootstrap p value <0.001). The overall time spent was 547 working years (95% CI 535 to 559) before streamlining and 614 working years after streamlining (95% CI 600 to 629). This is an increase of 67 working years after streamlining.
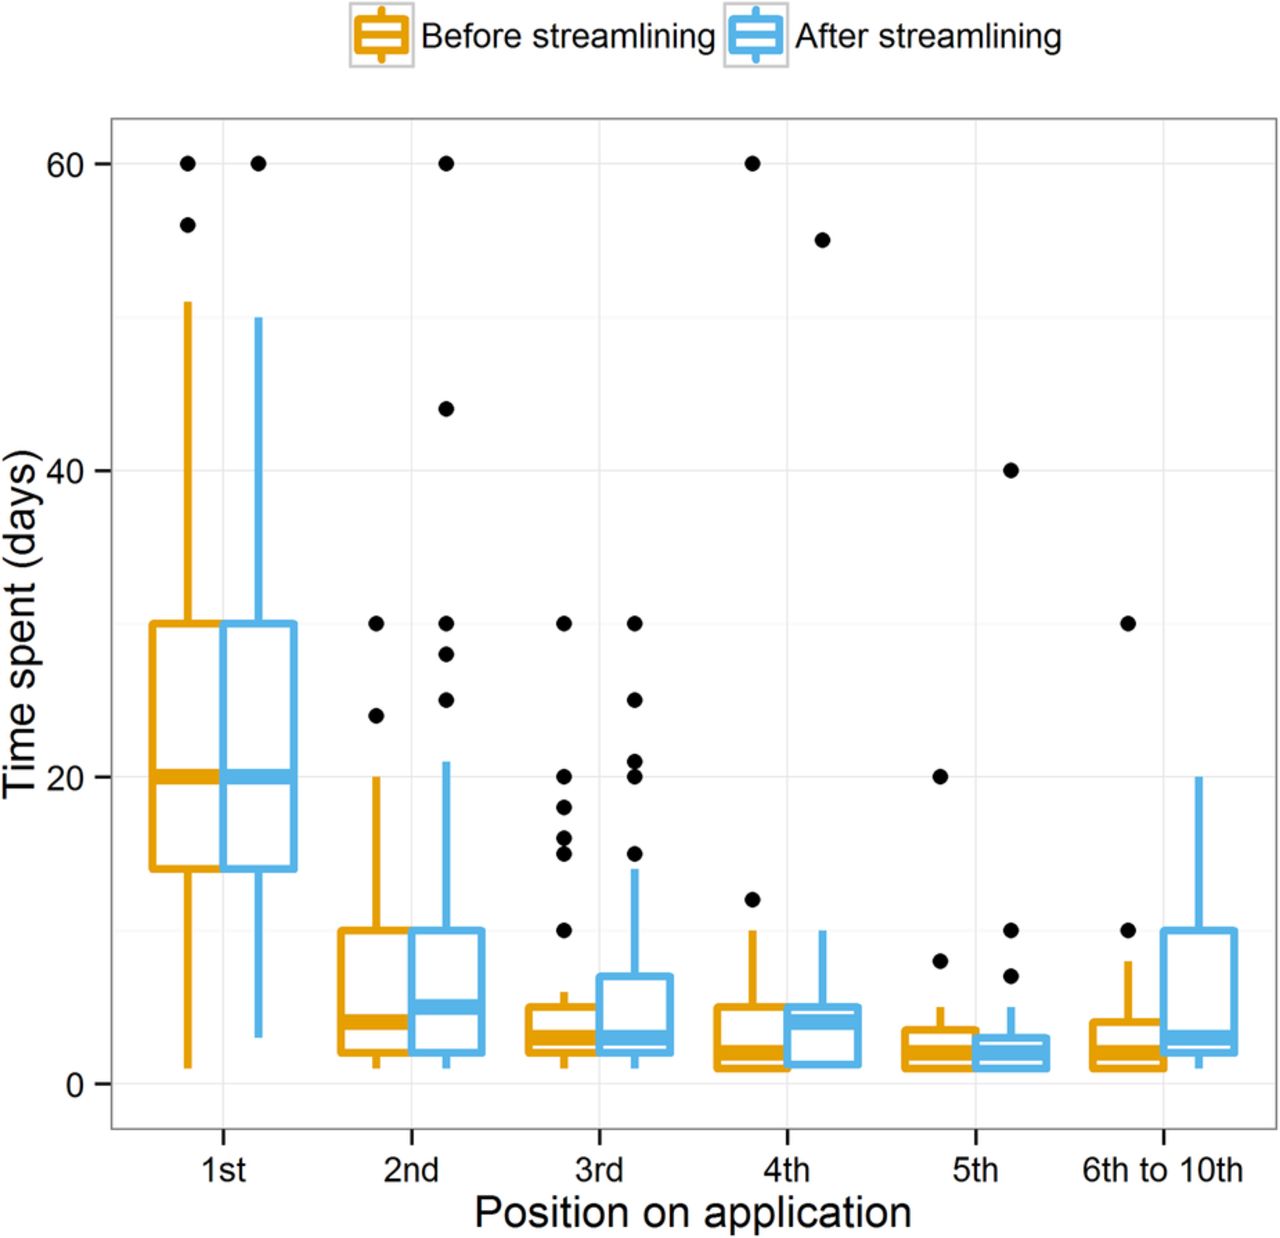
The densities of time spent are similar (figure 2), but after streamlining there was a smaller peak around 15 days and a larger probability around 27 days. The boxplots of time by position show that the first researcher usually did the majority of the work (figure 3). For most other researchers the time spent after streamlining was slightly larger. The summary statistics of time spent according to resubmission status and lead researcher in table 2 show that the mean times were fairly similar. The only decrease in time spent after streamlining was for resubmissions for the lead researcher.
Summary statistics on the average time spent on applications in working days by round, resubmission status and researcher position

Smoothed density of application time for the lead researcher in each survey. The lines show a binned kernel density estimate with a bandwidth of 5 days.

Boxplots of application times by researcher position and survey. Positions 6–10 are combined due to small numbers (under 10) when examining individual positions. The y-axis has been truncated at 60 days in order to focus on the majority of the data (99% of times were 60 days or under).
Most researchers agreed that the streamlined system was better with 75% (95% CI 69% to 81%) agreeing that it was better than in previous years.
Discussion
Streamlining the application system has not had the desired effect of reducing applicants’ time. Instead the amount of time spent has increased by an estimated 67 working years. This could be because the application time is independent of the length of the application and is instead dependent on the potential financial return or the competitiveness of the process.
Financial return
Researchers may be allocating a fixed amount of their year for preparing grant applications. This fixed allocation would be in proportion to the potential funding available. In 2013 the average awarded grant was AUD $650K (GBP £350K), and a success rate of 20% gives an expected return of $130K (GBP £70K). Allocating 1–2 months for this return is therefore a rational decision for those who believe they have an average chance of success. Pressure to apply also comes from colleagues and the university, and for researchers who are dependent on grant funding to continue working, there is no alternative than to dedicate large amounts of time to applications.
If researchers spend a fixed amount of time on applications then streamlining the system is still worthwhile because it means that they will spend more time on the sections that require the most thought (such as the scientific plan) and less time on ancillary and bureaucratic information. This is supported by many comments from our surveyed researchers, including:I think I ended up spending more time on the science of the application itself because I had less ‘other’ parts to write.
The amount of time researchers spent logged on to the online submission system decreased by 50% in 2014 (personal communication, NHMRC staff member). As researchers primarily log-in simply to enter data then this reduction suggests that less time was spent on bureaucratic activities. Most researchers also preferred the streamlined system, with 75% of our survey respondents agreeing that it was better.
Response to competition
Researchers may be increasing their preparation time—regardless of the application process—because the competition is getting stronger. When the funding total is fixed, it is the relative performance of the applicant that determines success. Success rates for the Project Grant scheme have steadily declined from 23.5% in 2010 to a low of 16.9% in 2013. In a similar fashion to elite athletes whose relative effort in training determines success, increased competition for research funds means that success depends on even more carefully crafted applications requiring more time, or that more applications are submitted in order to increase the chance of getting some funding. Our respondents increased their average number of applications from 2.2 per researcher in 2012 to 3.1 in 2014 (0.9 increase, 95% CI 0.7 to 1.1).
A simulated study found that in competitive funding systems there was spiralling competition with researchers spending an average of 55% of their time writing applications.7 The simulated system became over-competitive which then inflated preparation time and decreased application quality.7 If competition is driving application time then saving researchers’ time will only be achieved by reducing competition. Reducing competition is achievable by: (1) increasing the funding pool, which is unlikely in the current economic climate or (2) decreasing the number of applications, which is possible via unpopular methods such as cooling off periods for unsuccessful applicants8 or levying a submission fee.9
Another potential approach to save time is to use a lottery to select applications that attain a certain standard.10 If this was adopted the incentive on the researcher would change significantly, as applications could be judged solely on the grounds that they are considered fundable, and the random allocation of funds amongst these fundable applications reduces the incentive to expend additional preparation effort. The New Zealand Health Research Council is using exactly this approach for its Explorer grants,11 and so there are opportunities to study how applicant behaviour changes with this approach.
More streamlining needed
The streamlining may not have been severe enough. Most time is spent on the scientific plan and track records, which were sensibly not cut. Time may only be saved if these key sections are reduced as part of the further planned streamlining.12
Another potential cause of the increase in time was that other changes were made to the application process, including formatting changes and changes to track records and references. These changes may have offset the benefits of streamlining as described by one researcher:Any changes that were made to make it shorter were counteracted by the time spent adjusting the application to conform to the new structure and guidelines.
This may explain the increase in time after streamlining for non-lead researchers shown in figure 3, as they had to update their two-page track records to conform to the new system.
Limitations
Our survey participants were not randomly selected and therefore our results may not be an accurate representation of the wider population. We were limited in our ability to compare our sample with the wider population. We were under-representative of the leading eight universities, but we were representative in terms of success rate in 2012.
Our findings are based on retrospective self-reported times spent preparing proposals, and we could not verify these times. Participants completed our survey soon after the NHMRC closing date for submissions which should have reduced recall bias. Ideally participants would have prospectively completed a diary of their time and what they were doing, which would also help identify what parts of the application process take the most time. Researchers may have responded to both surveys, but we did not link their data as we did not collect any identifying information. This was a deliberate choice in order to make the survey anonymous and hence increase the number of responses.
Conclusions
Researchers invest lots of time in preparing applications and many potentially productive years of research are currently being lost on failed applications. Preventing this lost research time is a high priority in Australia, but streamlining applications may not be the answer. Answers may be found by spending some of the research budget on research into research,13 including experiments and pilot projects that examine alternative funding systems.14
Reducing wasted time is not just an issue in Australia. A survey of 29 funding agencies in 22 countries found that 12 reported that there were too many applications in the system, and 11 reported that the administrative burden was worse than 5 years ago.
Footnotes
Twitter Follow Adrian Barnett at @aidybarnett
Contributors All authors contributed to the design of the survey and edited the text. DH helped design the online survey and oversaw the data collection. AGB, DH, NG and PC designed the survey questions. DH, NG and PC edited the first draft of the paper. NG and PC provided the economic theory. All authors had full access to all of the data (including statistical reports and tables) in the study and can take responsibility for the integrity of the data and the accuracy of the data analysis. AGB (the manuscript's guarantor) affirms that the manuscript is an honest, accurate and transparent account of the study being reported; that no important aspects of the study have been omitted; and that any discrepancies from the study as planned have been explained.
Funding This work was funded by the National Health and Medical Research Council (Project Grant 1023735). The sole role of the NHMRC in this project is as the research funder. The NHMRC had no role in the study design, data collection, analysis, interpretation of the data, writing of the article or decision to submit for publication.
Competing interests All authors have completed the Unified Competing Interests form at http://www.icmje.org/coi_disclosure.pdf (available on request from the corresponding author).
Ethics approval The two studies were approved by the Queensland University of Technology (QUT) Human Research Ethics Committee (numbers 1300000210 and 1200000547).
Provenance and peer review Not commissioned; externally peer reviewed.
Data sharing statement Full data sets (with some blinding to preserve anonymity) and statistical codes are available from the corresponding author at a.barnett@qut.edu.au.