Article Text

Abstract
Introduction Stress-induced hyperglycaemia, which has been shown to be associated with an unfavourable prognosis, is common among critically ill patients. Additionally, it has been reported that hypoglycaemia and high glucose variabilities are also associated with adverse outcomes. Thus, continuous glucose monitoring (CGM) may be the optimal method to detect severe hypoglycaemia, hyperglycaemia and decrease glucose excursion. However, the overall accuracy and reliability of CGM systems and the effects of CGM systems on glucose control and prognosis in critically ill patients remain inconclusive. Therefore, we will conduct a systematic review and meta-analysis to clarify the associations between CGM systems and clinical outcome.
Methods and analysis We will search PubMed, EMBASE and the Cochrane Library from inception to October 2014. Studies comparing CGM systems with any other glucose monitoring methods in critically ill patients will be eligible for our meta-analysis. The primary endpoints include the incidence of hypoglycaemia and hyperglycaemia, mean glucose level, and percentage of time within the target range. The second endpoints include intensive care unit (ICU) mortality, hospital mortality, duration of mechanical ventilation, length of ICU and hospital stay, and the Pearson correlation coefficient and the results of error grid analysis. In addition, we will record all complications (eg, acquired infections) in control and intervention groups and local adverse events in intervention groups (eg, bleeding or infections).
Ethics and dissemination Ethics approval is not required as this is a protocol for a systematic review. The findings will be disseminated in a peer-reviewed journal and presented at a relevant conference.
Trial registration number PROSPERO registration number: CRD42014013488.
- glucose
- continuous monitoring
- hyperglycemia
- hypoglycemia
- mortality
This is an Open Access article distributed in accordance with the Creative Commons Attribution Non Commercial (CC BY-NC 4.0) license, which permits others to distribute, remix, adapt, build upon this work non-commercially, and license their derivative works on different terms, provided the original work is properly cited and the use is non-commercial. See: http://creativecommons.org/licenses/by-nc/4.0/
Statistics from Altmetric.com
Strengths and limitations of this study
This review will be the first high-quality systematic review and meta-analysis to synthesise current evidence on continuous glucose monitoring in the intensive care unit.
It will inform clinicians of the value of continuous glucose monitoring.
This review will be limited by the quality and heterogeneity of the primary studies, especially the included observational studies.
Introduction
Up to 90% of critically ill patients in the intensive care unit (ICU) may experience hyperglycaemia, which has been reported to be associated with poor prognosis, including morbidity and mortality.1 ,2 Van den Berghe et al3 reported that intensive insulin therapy could significantly decrease the risk of morbidity and mortality; however, these benefits were not observed in several subsequent studies as well as a large meta-analysis. In this meta-analysis, the authors indicated that intensive insulin therapy had no effect on survival rate in critically ill patients but rather resulted in a six-fold increase in severe hypoglycaemia.4–6 As a result, two multicentre studies were stopped prematurely because of a high incidence of hypoglycaemia.4 ,5 Apart from hyperglycaemia and hypoglycaemia, elevated glucose variability has also been shown to be related to adverse outcomes.6–11 Therefore, glucose regulation remains a challenge in the ICU. The fact that glucose levels in critically ill patients are not measured continuously may contribute to the high incidence of hyperglycaemia and hypoglycaemia and increased glucose fluctuation. Conventional glucose monitoring regimens often require nurses to monitor blood glucose frequently and this both increases the workload of the intensive care nurses and also increases the number of blood samples and accompanying blood loss. More seriously, insulin-induced severe hypoglycaemia may be unnoticed between two measurements.12
To optimise glucose control, it is necessary to monitor glucose levels in real time. Subcutaneous continuous glucose monitoring (CGM) has been extensively evaluated in patients with diabetes.13–15 In critically ill patients, the accuracy and reliability of CGM sensors have been evaluated in several small studies in recent years,16–19 however, the Pearson correlation coefficients reported by different studies ranged from 0.69 to 0.92.16 ,17 Additionally, little is known about whether the application of CGM is associated with satisfactory glycaemic control and improved prognosis. We describe here the protocol of a systematic review and meta-analysis for exploring the overall accuracy and reliability of CGM as compared with other reference methods in critically patients and examining whether the use of CGM could decrease the incidence of hypoglycaemia and hyperglycaemia and improve the prognosis of critically ill patients. This systematic review has been registered with PROSPERO (the National Institute for Health Research (NIHR) International Prospective Register of Systematic Reviews, http://www.crd.york.ac.uk/PROSPERO) under registration number CRD42014013488.
Methods
The present systematic review and meta-analysis will be reported according to the recommendations from the Preferred Reporting Items for Systematic Reviews and Meta-Analyses (PRISMA, http://www.prisma-statement.org/) statement.
Search methods for identifying studies
Electronic searches
We will systematically search PubMed, EMBASE and the Cochrane Library from inception to October 2014. We will also screen the reference lists of relevant studies and reviews for additional articles. In addition, we will search the following websites for unpublished or ongoing studies: http://www.controlled-trials.com and http://clinicaltrials.gov, and review abstracts from selected scientific proceedings (the Society of Critical Care Medicine and the European Society of Intensive Care Medicine). There will be no language restrictions. If we identify relevant non-Chinese or non-English studies, we will invite experts to translate these documents into Chinese or English.
Search terms/search strategy
The keywords and Medical Subject Headings related to CGM (real-time glucose monitoring, real-time CGM, subcutaneous CGM, and continuous measurement of glucose) and critically ill patients (intensive care, ICU, critically ill, intensive care unit, critical care, critical illness, critical care nursing, severely ill and emergency) will be used alone or in combination to retrieve relevant articles. The search strategy has been developed for PubMed (see online supplementary file 1), and a similar search strategy will be adapted for the other databases.
Inclusion criteria of studies
Participants
Studies including critically patients (general ICU patients, medical ICU patients, surgical ICU patients, trauma ICU patients, and so on) will be eligible for our meta-analysis.
Intervention group and control group
Glucose regulation in the intervention group must be performed by use of a subcutaneous CGM system. In the control group, blood glucose levels must be regulated by conventional methods (point-of-care devices, arterial blood gas analysis, or central laboratory testing). In some studies, patients in the control group may also receive the CGM system but these data must be blinded to nurses and clinicians and not used for glucose regulation; these studies will be also eligible for our meta-analysis. CGM systems used in intervention or control groups must be calibrated according to the manufacturer's instructions; no restriction will be placed on the frequency of calibration.
Study endpoints
The primary endpoints include the incidence of hypoglycaemia and severe hypoglycaemia,20 the incidence of hyperglycaemia, mean glucose level, and percentage of time within the target glucose range. For hypoglycaemia, severe hypoglycaemia, hyperglycaemia and normal glucose range, we will use definitions as defined in the included studies.
The second endpoints include ICU mortality, hospital mortality, duration of mechanical ventilation, and the length of ICU and hospital stay. In order to assess the accuracy of the CGM system, we will also extract the Pearson correlation coefficient and the results of error grid analysis between the CGM system and other glucose monitoring methods. In the error grid analysis, we will extract the percentage of data points which fall within in zone A, B, C, D and E. In addition, we will record all complications (eg, acquired infections) in the control and intervention groups and local adverse events in the intervention group (eg, bleeding or infections).
Study design
Both prospective and retrospective observational cohort studies and randomised controlled trials (RCTs) will be eligible for the present systematic review and meta-analysis.
Data collection and analysis
Selection of studies
Three reviewers (WZ, LJ and SJ) will independently examine the titles and/or abstracts and eliminate irrelevant studies. The full text of all potential eligible studies will be read and their suitability for inclusion determined according to the PICO (Participant, Intervention, Comparison, and Outcome) model. Discrepancy will be resolved by consensus or discussion with another reviewer (YM or MZ). Inter-rater agreement was assessed using the kappa statistic (k<0.01: no agreement; k=0.01–0.20: poor agreement; k=0.21–0.40: fair agreement; k=0.41–0.60: moderate agreement; k=0.61–0.80: good agreement; k=0.81–1.00: very good or perfect agreement) (http://www.internovi.it/software/kappa).
Data extraction
Two reviewers (WZ and LJ) will abstract data from the retrieved trials independently using a predefined data extraction sheet. Any discrepancy will be managed by consensus. The following variables will be recorded for each study: the name of the first author, publication year, country of origin, type of setting (general ICU patients, surgical ICU patients, trauma ICU patients, and so on), patients’ characteristics (gender, age, number, inclusion and exclusion criteria), characteristics of interventions, characteristics of control methods (venous blood glucose, capillary blood glucose or artery blood glucose), target blood glucose range, mortality, Pearson correlation coefficient between the CGM system and other methods and the results of error grid analysis, the incidence of hypoglycaemia and hyperglycaemia, mean glucose levels, percentage of time within the target range, duration of mechanical ventilation, duration of follow-up, the length of ICU and hospital stay, all complications in the two groups, and adverse events in the intervention group. If necessary (unclear data, missing data and extractable data), we will attempt to contact the corresponding authors of the included studies for missing data and for clarification.
Assessment of the quality of included studies
The methodological quality of RCTs will be evaluated by using the Jadad criteria (box 1). The Jadad scale determines the quality of an RCT from three domains: (1) randomisation; (2) double-blinding; (3) and explanation of withdrawals or loss to follow-up (http://www.anzjsurg.com/view/0/JadadScore.html). Studies will be considered to be of low quality if the Jadad score is less than 2 and high quality if the score is more than 3. The Newcastle-Ottawa Scale will be used to assess the methodological quality of included observational studies (http://www.ohri.ca/programs/clinical_epidemiology/oxford.asp). The quality of a study will be judged by the selection of the study groups, the comparability of the groups, and the ascertainment of the outcome. The selection of the study groups will be evaluated from four items: representativeness of the exposed cohort, selection of the non-exposed cohort, ascertainment of exposure to implants, and demonstration that the outcome of interest is not present at the start of the study. The comparability of the groups will be evaluated from one item: study controls for confounders. The ascertainment of the outcome will be evaluated from three items: assessment of outcome, duration of follow-up and completeness of follow-up. A study can be awarded a maximum of one star for each numbered item within selection and outcome categories, and a maximum of two stars for comparability. All the above processes will be completed independently by two reviewers and inter-rater agreement will be assessed using the kappa statistic.
Jadad score
Randomisation (2 points possible)
1 point if study described as randomised
Add 1 point if randomisation method described and appropriate (eg, random numbers generated)
Deduct 1 point if randomisation is described and inappropriate
Double-blinding (2 points possible)
1 point if study described as double-blinded
Add 1 point if method of double-blinding is described and appropriate
Deduct 1 point if double-blinding is described and inappropriate
Withdrawals (1 point possible)
Give 1 point for a description of withdrawals and drop-outs
Dealing with missing data
If there are any missing or insufficient data in included studies, we will contact the first or corresponding authors of the study by telephone or email to obtain more information. If we are unable to obtain the missing data, the methods reported by Ebrahim et al21 and Akl et al22 will be used to perform complete case analysis, and a sensitivity analysis will be conducted.
Statistical analysis and data synthesis
Stata V.12.0 (serial no. 40120519635) will be used to calculate pooled ORs and 95% CIs for dichotomous variables and pooled weighted mean differences (WMDs) and 95% CIs for continuous variables. A fixed-effects model and a random-effects model will be used to pool effect size as appropriate according to the results of heterogeneity tests (http://www.cochrane.org/handbook). If the included studies demonstrate heterogeneity, the random-effects model will be used; otherwise, the fixed-effects model will be used. The Pearson correlation coefficient between the intervention and control group and according 95% CI will be combined using the method of ‘generic inverse variance’ (http://www.cochrane.org/handbook). The data required for the generic inverse variance method are an estimate for the Pearson correlation coefficient and its SE for each of the studies. Each study is given a weight which is equal to the inverse of the variance of the effect estimate (ie, 1 divided by the SE squared). Then, we need to enter the Napierian logarithm (ln) of the effect size and the SE of the ln (Pearson correlation coefficient). If these two values are entered as the effect estimate and SE, from them STATA V.12.0 will calculate the effect size and 95% CI (this is not on the log scale). In our study, we will use the 95% CI of the Pearson correlation coefficient to work backwards and calculate the SE of the ln (Pearson correlation coefficient.).
Assessment of heterogeneity
Heterogeneity will be assessed using Cochran’s Q statistic and I2 statistic, where p<0.1 or I2 >50% indicates the presence of significant heterogeneity.23 ,24 I2 will be calculated according to the equation I2=100%×(Q−df)/Q, where Q is the Cochran heterogeneity statistic.23
Meta-regression and subgroup analysis
We will perform meta-regression to test the significance of each pre-defined covariate, including year of publication, age (ie, paediatric or adult), type and generation of CGM device, type of patient (general ICU patients, surgical ICU patients, trauma ICU patients, and so on), method of blood glucose monitoring in the control group (venous blood glucose, capillary blood glucose or artery blood glucose), calibration frequency, and type of study design (RCT or observational study). Additionally, we will perform subgroup analyses based on covariates which are statistically significance in the meta-regression.
Sensitivity analysis
First, sensitivity analysis will be performed by excluding trials at high risk of bias; second, a leave-one-out sensitivity analysis will be performed by iteratively removing one study at a time to confirm the robustness of our results.
Publication bias
A symmetrical funnel plot indicates that there is non-significant publication bias. However, asymmetry in a funnel plot can be explained by many factors, including publication bias and differing study quality.25 Therefore, a contour-enhanced funnel plot will be applied to aid interpretation of the funnel plot. If studies are missing in areas of low statistical significance, the asymmetry may be due to publication bias. If studies are missing in areas of high statistical significance, the asymmetry may be due to other factors.25 In addition, Egger's test will be used to quantitatively detect publication bias. Egger's method regresses the standard normal deviate on precision. This regression line must be weighed by the inverse of variance. A regression line originating in the y-axis zero indicates there is not a significant publication bias, but if it originates further away from zero, there is publication bias.26
Discussion
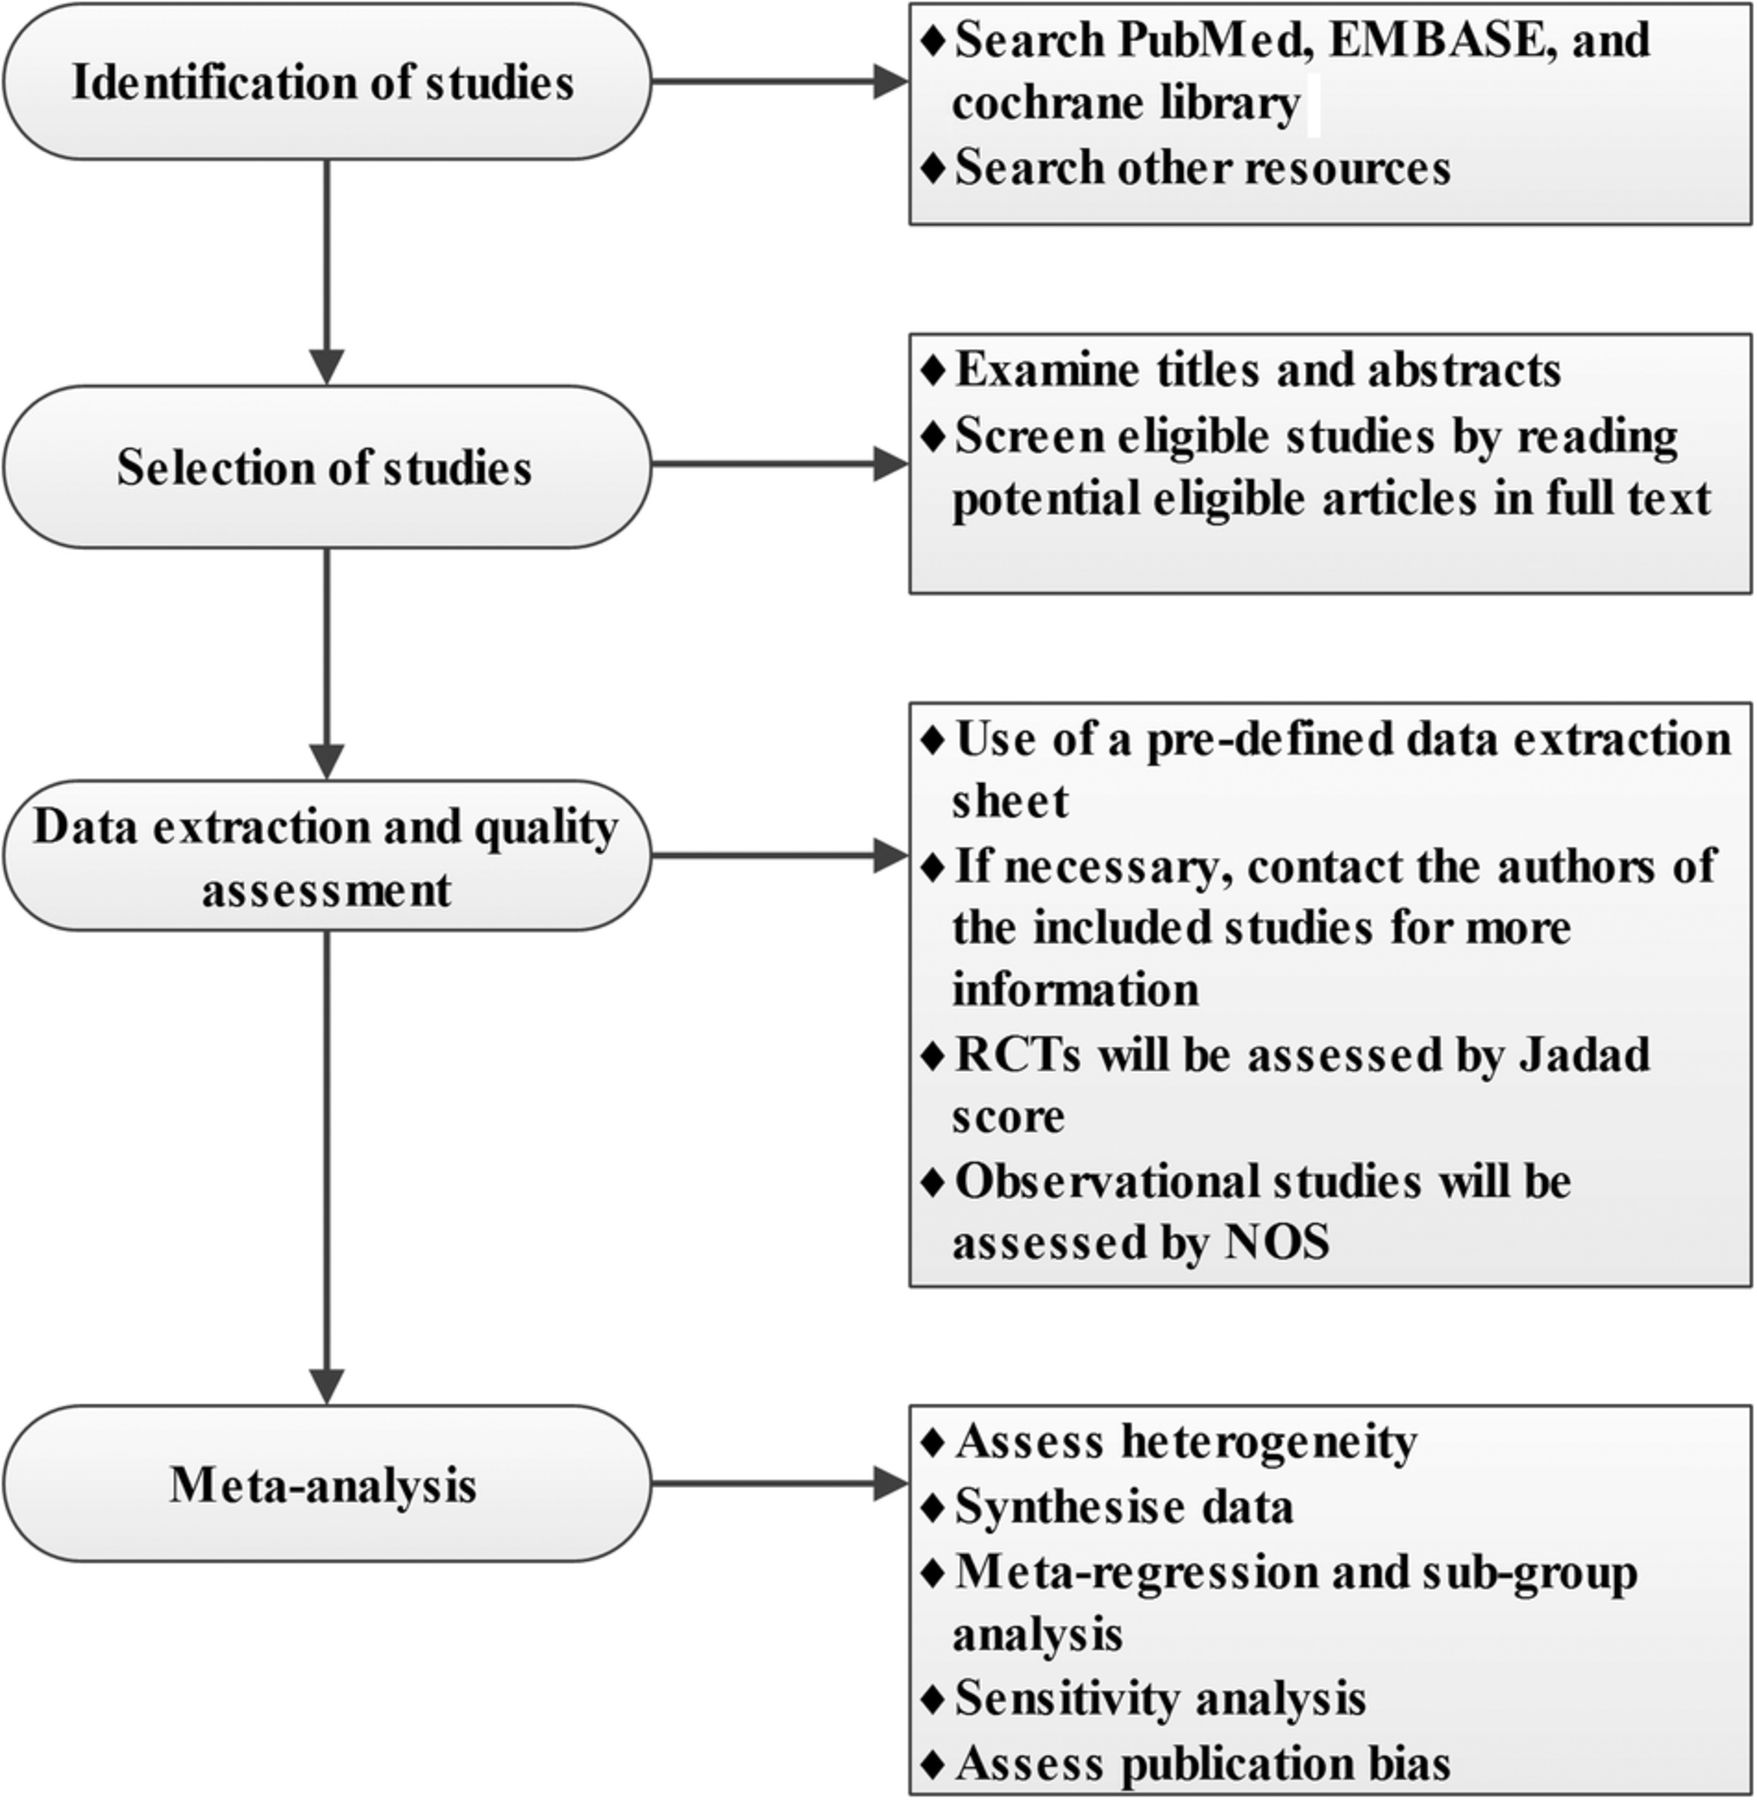
Stress-induced hyperglycaemia, which is common in ICUs, has been reported to be an independent risk factor for adverse outcomes.27 ,28 Management of hyperglycaemia in critically ill patients has been widely discussed, especially whether tight glycaemic control is beneficial or harmful for critically ill patients. The benefits of intensive insulin control reported by Van den Berghe et al were not observed in subsequent RCTs.3–5 However, irrespective of the selected blood glucose target range, in none of the RCTs was the predefined target range reached due to the increased rate of severe hypoglycaemia.4 ,5 ,7 A large meta-analysis even reported that intensive insulin therapy was associated with a six-fold increase in severe hypoglycaemia.6 Based on the above analysis, we suggest that the real benefit of intensive glucose control may be masked by the incidence of severe hypoglycaemia. Additionally, substantial glucose fluctuation has also been shown to be related to unfavourable outcomes. However, it is difficult to achieve a further decrease in glucose excursions using current glucose monitoring methods. Therefore, real-time CGM may be more appropriate for managing hyperglycaemia in critically ill patients. Subcutaneous CGM has been extensively evaluated in the management of patients with diabetes.13–15 Although CGM has been used in critically ill patients in recent years, and has been reported to be associated with a decreased risk of severe hypoglycaemia,12 ,29 the overall accuracy and reliability of CGM have not been well defined.16–19 For instance, the Pearson correlation coefficient between CGM and conventional glucose monitoring methods ranged from 0.69 to 0.92, as reported by different studies.16 ,17 Moreover, we still do not know whether CGM reduces the workload of nurses and medical costs and improves glucose control and the prognosis of critically ill patients. Therefore, a high quality systematic review and meta-analysis is required; figure 1 shows a flowchart of our study. Our review will be limited by the quality and heterogeneity of the primary studies, including noted between-study variability in enrolled patient populations, different glucose regulation protocols, different types and generations of CGM devices, different frequencies of calibration, and different definitions of hypoglycaemia, hyperglycaemia and the target glucose range. Additionally, observational studies, especially retrospective cohort studies, will be included in our meta-analysis; this may increase the risk of potential selection and information bias, and the imbalanced baseline variables in observational studies will further limit the generalisation of our results.

Flowchart of the systematic review. NOS, Newcastle-Ottawa Scale; RCT, randomised controlled trial.
References
Supplementary materials
Supplementary Data
This web only file has been produced by the BMJ Publishing Group from an electronic file supplied by the author(s) and has not been edited for content.
Files in this Data Supplement:
- Data supplement 1 - Online supplement
Footnotes
Contributors WZ, LJ, SJ, YM and MZ contributed to the conception of the study. The manuscript protocol was drafted by WZ, LJ and SJ and was revised by YM and MZ. The search strategy was developed by all the authors and will be performed by LJ, WZ and SJ, who will also independently screen the potential studies, extract data from the included studies, assess the risk of bias and complete the data synthesis. MZ and YM will arbitrate in cases of disagreement and ensure the absence of errors. All authors approved the publication of the protocol. The above authors all are members of the China Emergency and Critical Care Evidence-based Medicine Group (CECCEBMG).
Competing interests None.
Provenance and peer review Not commissioned; externally peer reviewed.
Data sharing statement The findings of this systematic review will be disseminated via peer-reviewed publications and conference presentations.