Article Text

Abstract
Objectives Effective government policies are essential to increase the healthiness of food environments. The International Network for Food and Obesity/non-communicable diseases (NCDs) Research, Monitoring and Action Support (INFORMAS) has developed a monitoring tool (the Healthy Food Environment Policy Index (Food-EPI)) and process to rate government policies to create healthy food environments against international best practice. The aims of this study were to pilot test the Food-EPI, and revise the tool and process for international implementation.
Setting New Zealand.
Participants Thirty-nine informed, independent public health experts and non-governmental organisation (NGO) representatives.
Primary and secondary outcome measures Evidence on the extent of government implementation of different policies on food environments and infrastructure support was collected in New Zealand and validated with government officials. Two whole-day workshops were convened of public health experts and NGO representatives who rated performance of their government for seven policy and seven infrastructure support domains against international best practice. In addition, the raters evaluated the level of difficulty of rating, and appropriateness and completeness of the evidence presented for each indicator.
Results Inter-rater reliability was 0.85 (95% CI 0.81 to 0.88; Gwet’s AC2) using quadratic weights, and increased to 0.89 (95% CI 0.85 to 0.92) after deletion of the problematic indicators. Based on raters’ assessments and comments, major changes to the Food-EPI tool include strengthening the leadership domain, removing the workforce development domain, a stronger focus on equity, and adding community-based programmes and government funding for research on obesity and diet-related NCD prevention, as good practice indicators.
Conclusions The resulting tool and process will be promoted and offered to countries of varying size and income globally. International benchmarking of the extent of government policy implementation on food environments has the potential to catalyse greater government action to reduce obesity and NCDs, and increase civil society's capacity to advocate for healthy food environments.
- NUTRITION & DIETETICS
- PUBLIC HEALTH
This is an Open Access article distributed in accordance with the Creative Commons Attribution Non Commercial (CC BY-NC 4.0) license, which permits others to distribute, remix, adapt, build upon this work non-commercially, and license their derivative works on different terms, provided the original work is properly cited and the use is non-commercial. See: http://creativecommons.org/licenses/by-nc/4.0/
Statistics from Altmetric.com
Strengths and limitations of this study
The Healthy Food Environment Policy Index (Food-EPI) assesses the extent of implementation of government policies on food environments; no similar tools are currently available.
The Food-EPI has the potential to catalyse government action and lift engagement of non-governmental organisations and researchers.
Although experts from low-income and middle-income countries revised the tool in its development phase, further testing in those settings is recommended.
More international best practice exemplars need to be collected for the infrastructure support indicators.
Evidence of impact of best practice policies on reducing obesity and diet-related non-communicable diseases is currently limited.
Introduction
Effective government policies and actions are essential to increase the healthiness of food environments (such as food composition, labelling, promotion, prices, provision and availability) and reduce obesity, diet-related non-communicable diseases (NCDs) and their related inequalities.1 According to the latest report from the Organisation for Economic Co-operation and Development (OECD), over half of the adults and one in five children are now overweight or obese in the OECD countries. A nearly 10-fold variation in rates of obesity and overweight is observed among those countries.2 Serious action from governments and the food industry to improve food environments has been slow and inadequate, in part due to the successful pressure of commercial food and media sectors on governments.3–5 In addition, difficulties providing robust evidence on the likely effectiveness of policies before they have been introduced, and competition for resources between public health preventive services and other government-provided services may have played a role.6 However, some governments have recently demonstrated leadership and taken thoughtful actions, which may serve as good or best practice exemplars or benchmarks for other countries globally. Some non-exhaustive, topical examples include the approval of mandatory multiple traffic lights front-of-pack labelling in Ecuador, the soda and junk food tax recently implemented in Mexico, warning labels on high fat, sugar and salt foods approved in Chile, and legislation approved on maximum sodium levels in different categories of foods in South Africa and Argentina.7 Some Pacific island countries increased import and excise tariffs on sugar-sweetened beverages, other high-sugar products and palm oil and lowered tariffs on fruits and vegetables.8
The International Network for Food and Obesity/NCDs Research, Monitoring and Action Support (INFORMAS)9 was recently founded to monitor and benchmark food environments, government policies and private sector actions and practices globally. Food environments are defined as the collective physical, economic, policy and sociocultural surroundings, opportunities and conditions that influence people's food and beverage choices and nutritional status.9 INFORMAS aims to complement existing monitoring efforts of the WHO, such as the global NCD monitoring framework, which is deficient with regard to those more upstream indicators.10 This is a serious gap because current food environments are driving unhealthy diets and energy overconsumption.11 ,12
INFORMAS has developed a monitoring tool (the Healthy Food Environment Policy Index (Food-EPI)) and process to assess government policies and actions for creating healthy food environments against international best practice. The Food-EPI has been developed based on a review of policy documents and consultation with international experts, including experts from low-income and middle-income countries. Full details on the development of the Food-EPI have been described elsewhere.13 The Food-EPI comprises a ‘policy’ component with seven domains on specific aspects of food environments (food composition, labelling, promotion, provision, retail, prices, trade) that can be acted on by governments as well as the private sector to increase the healthiness of food environments, and an ‘infrastructure support’ component with seven domains (leadership, governance, funding and resources, monitoring and intelligence, workforce development, platforms for interaction and health-in-all-policies) to strengthen systems to prevent obesity and NCDs. The domains included in the ‘infrastructure support’ component are based on the WHO ‘system building blocks’ approach for health systems.14 The proposed Food-EPI tool is consistent with, and supportive of, the list of proposed policy options for member states included in the WHO's Global Action Plan for the Prevention and Control of Non-Communicable Diseases (2013–2020)10 and the World Cancer Research Fund (WCRF) International NOURISHING Food Policy Framework for Healthy Diets.1 ,7 A set of good practice indicators has been proposed within each domain and these will evolve into benchmarks established by governments at the forefront of creating and implementing food policies for good health.
A rating process is proposed to assess a government's level of policy and infrastructure support implementation towards best practice.13 A process for rating government action on obesity prevention has previously been used in Australia,15 whereby informed, non-government public health experts annually rate their state government's recent progress on obesity prevention against a series of good practice indicators. The media coverage and responses from bureaucrats and politicians indicated that the award stimulated discussion within their jurisdictions.15 The Food-EPI,13 however, will assess current levels of policy implementation rather than recent progress over time, as the latter may disadvantage governments that already made good progress.
A similar initiative to monitor actions and practices of private sector companies is the Access to Nutrition Index (ATNI),16 which has rated and benchmarked 25 of the world's largest food and beverage manufacturers on their commitments, performance and disclosure practices globally related to obesity and undernutrition across seven different categories (governance, products, accessibility, marketing, labelling, lifestyles and engagement). It was launched for the first time in 2013 and will be published every 2 years to track and encourage improvements in companies’ nutrition practices. One of the INFORMAS modules aims to evaluate the extent of implementation of priority actions by the food industry in countries globally.17
The aim of this study was to pilot test the Food-EPI tool and process for the first time in New Zealand and to revise the tool and rating process for implementation in countries of varying size and income. The aim is for the Food-EPI process to be repeated regularly (depending on governments’ terms) in order to check progress over time and against international best practice.
Materials and methods
The tools, methods and processes used in this study have been approved by the University of Auckland Human Participants Ethics Committee (reference number 9326).
Establishment of the national Expert Panel
A comprehensive group of informed, non-government public health and nutrition experts and academics, and representatives of relevant public health organisations (eg, National Heart Foundation, Cancer Society, Nutrition Society, Nutrition Foundation, Dieticians New Zealand, Diabetes New Zealand, Kidney Health, Public Health Association of New Zealand, New Zealand Medical Association, Agencies for Nutrition Action, Stroke Foundation of New Zealand) were invited to form a New Zealand Expert Panel on food policy. Since obesity and diet-related NCDs are very high among Māori and Pacific populations, it was ensured that there was strong representation from these organisations as well (Pacific HeartBeat, Te Hotu Manawa Māori, Te Ro¯pu¯ Mate Huka o Atearoa, Toi Tangata). The national Expert Panel excludes individuals working for government or the food industry. Having a broad range of public health nutrition organisations and experts within this group could ultimately increase the power of civil society to hold governments to account for their actions and policies on food environments. All participants signed an informed consent form and declared their conflicts of interest.
Compilation of evidence on the extent of government policy implementation
Evidence on the extent of government implementation of actions, policies and infrastructure support systems was collected during the period February–August 2013 for all good practice indicators within the 14 Food-EPI domains (table 1, column 2) for the current government's term.
List of original (including average rater scores) and adapted good practice indicators for the seven food policy and the seven infrastructure support domains of the Healthy Food Environment Policy Index (Food-EPI)
Searches for government documents and budget information were conducted on governmental websites, libraries, via contact with government officials and via submission of official information requests (Official Information Act 1982). Most assessments were on the current level of implementation (ie, status over the past 3 years), but the infrastructure support domain on ‘monitoring and intelligence’ needed to take a longer view, since some of the surveys (eg, food consumption surveys) might be too expensive to run every 3 years.
The evidence collection focused on the national government, but took into account government policies, actions and infrastructure support systems at subnational levels where relevant (eg, funding for population nutrition promotion and actions in the domain of food retail by councils, public health units and district health boards in New Zealand) in order to avoid underestimation of implementation. The output from this step was a report of notated evidence related to each of the good practice indicators within the 14 Food-EPI domains (44 pages, available on request). An example of the good practice indicator on front-of-pack labelling within the labelling domain is given in box 1.
Example of the evidence collected on the extent of implementation of a front-of-pack supplementary nutrition information system in New Zealand (as of November 2013)
Good practice for ‘food labelling’ domain: There is a consumer-oriented regulatory system implemented for labelling on food packaging and menu boards in restaurants to enable consumers to easily make informed food choices and to prevent misleading claims.
Good practice indicator ‘Label 3’: A single, consistent, interpretive, evidence-informed front-of-pack supplementary nutrition information system, which readily allows consumers to assess a product's healthiness, is applied to all processed foods.
Evidence:
The labelling logic report, commissioned by the New Zealand Government, contained several recommendations related to front-of-pack nutrition labelling:
Recommendation 50: That an interpretative front-of-pack labelling system be developed that is reflective of a comprehensive Nutrition Policy and agreed public health priorities.
Recommendation 51: That a multiple traffic lights front-of-pack labelling system be introduced. Such a system is to be voluntary in the first instance, except where general or high level health claims are made or equivalent endorsements/trade names/marks appear on the label, in which case it should be mandatory.
Recommendation 52: That government advice and support be provided to producers adopting the multiple traffic lights system and that its introduction be accompanied by comprehensive consumer education to explain and support the system.
Recommendation 53: That ongoing monitoring and evaluation of the multiple traffic lights system be undertaken to assess industry compliance and the effectiveness of the system in improving the food supply and influencing consumers’ food choices.
There is currently no mandatory or voluntary front-of-pack labelling system in place in New Zealand.
Under the leadership of the Ministry for Primary Industries (MPI), an expert advisory group composed of industry, government and public health stakeholders, has been working on development of a voluntary approach to front-of-pack labelling in New Zealand. Recently, on 14 June 2013, the Health Star Rating system was approved by the Australian government.28 The preferred implementation option at this stage is a voluntary system, subject to consistent and widespread uptake of the system by industry. If, following evaluation after 2 years, a voluntary implementation is found to be unsuccessful, a mandatory approach will be considered. New Zealand intends to align as much as possible with what is happening in Australia and has supported a voluntary interpretive front of pack labelling system system. The traffic lights system is not being considered in New Zealand or Australia. New Zealand is still working through areas of difference from the proposed Australian system, in particular the proposed exemptions.
International best practice: In the UK a new consistent system of front-of-pack food labelling has been introduced: A combination of colour coding and nutritional information is used to show how much fat, salt and sugar and how many calories are in each product. It is estimated that about 60% of foods will be covered by the system because it will remain voluntary.
Validation of evidence with government officials
The evidence collected was fed back to government officials in relevant departments (Ministry of Health, Ministry for Primary Industries, Ministry of Education, Ministry of Foreign Affairs and Trade and Ministry for Social Development, State Services Commission) and agencies (Health Promotion Agency) to verify its completeness and accuracy. Personal meetings were held with each of the Ministries during August 2013. The evidence was then updated and finalised during September–October 2013 for presentation to the raters during the rating workshops.
International benchmarks
International benchmarks for the good practice indicators within the different Food-EPI domains were mainly derived from the World Cancer Research Fund NOURISHING database1 ,7 and from international experts.
Rating workshops
All individuals within the national Expert Panel were invited to participate in one of two whole-day workshops, one in Auckland and one in Wellington in November 2013. They underwent a short training session on how to assess the current level of government policy implementation for each of the good practice indicators.
Government officials were present as observers during the workshops. During the workshops, the good practice, the evidence on the extent of implementation and the benchmarks were presented separately for each domain and good practice indicator. After some plenary discussions on the evidence presented, each rater independently scored the current degree of implementation towards best practice for each indicator on a scale from 1 to 5 (1=less than 20% implementation, 2=20–40% implementation, 3=40–60% implementation, 4=60–80% implementation, 5=80–100% implementation) using Qwizdom Actionpoint, which is a PowerPoint Add-in allowing users to make their presentations interactive by posing questions. ‘Cannot rate’ was also an option. In addition, the raters evaluated the level of difficulty to rate and the appropriateness and completeness of the evidence presented on a scale from 1 to 5 for each of the good practice indicators. An example of the rating questionnaire for the domain on ‘food labelling’ is presented in table 2 and for the domain on ‘leadership’ in table 3.
Questionnaire for the raters, example for the food labelling domain within the food policy component of the Healthy Food Environment Policy Index (Food-EPI)
Questionnaire for the raters, example for the leadership domain within the infrastructure support component of the Healthy Food Environment Policy Index (Food-EPI)
During the second part of the workshop, the distribution of ratings was presented for each of the good practice indicators and major issues related to clarity, policy relevance, appropriateness and content of the good practice indicators, difficulty of rating, appropriateness and completeness of evidence presented were discussed in plenary.
The discussion of the two workshops was then synthesised and summarised (23 pages, available on request).
Data analysis
The Gwet AC2 inter-rater reliability coefficient and its variance were determined by calculating the percentage of agreement between the raters using quadratic weights.18 The AC1 statistic (AC2 for ordinal ratings) has been proposed by Gwet18 as an alternative to the unstable κ coefficient, which relies on a chance-agreement probability expression that is valid only under the improbable assumption that all ratings are known to be independent.
In order to calculate the variance, the sample of ‘subjects’ (=indicators of the Food-EPI) to rate was set at 100%, while the sample of ‘raters’ was set at 50%, as about 50% of the invited experts from the national Expert Panel were able to make it to one of the whole-day workshops. A correction for finite population was applied. The answers from raters who did not rate for particular indicators were omitted.
Results
In total, 39 public health experts and non-governmental organisation (NGO) representatives (about 50% of those invited) participated in both rating workshops (20 persons in Auckland and 19 persons in Wellington). Of those, 18 raters were researchers working at university, 1 working at the Plant and Food Research Institute, 19 representatives of different NGOs and 1 representative of other organisations (Dieticians New Zealand). In total, 10 participants were of Maori, Pacific or mixed descent, while 28 were of NZ European and 1 of European descent. After participation, all experts indicated a willingness to remain involved in future rating workshops.
Difficulty of rating
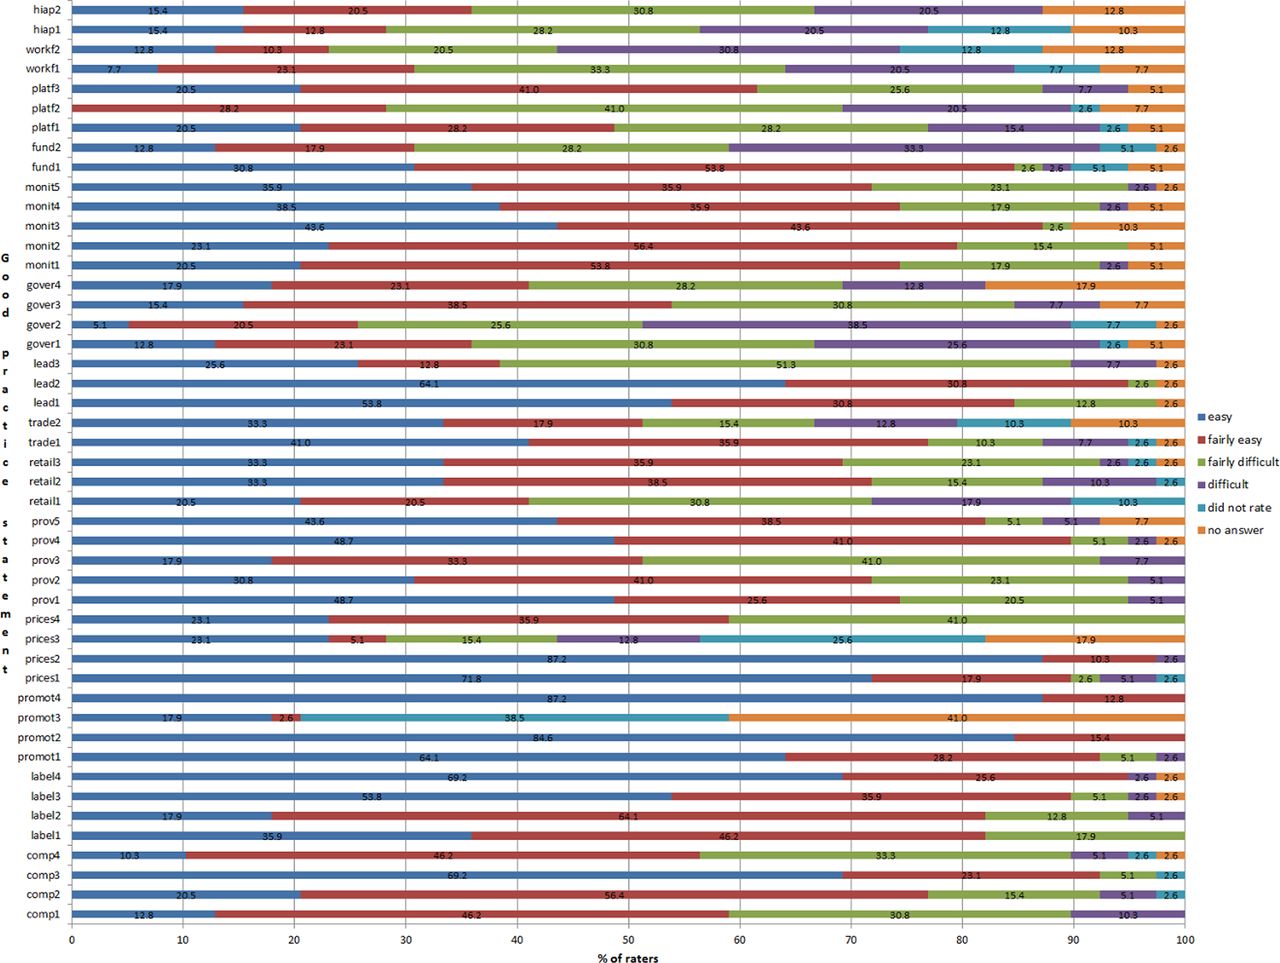
According to the raters, good practice indicators within the domains of ‘food promotion’ (promot1, promot2, promot4), ‘food prices’ (prices1, prices2), ‘leadership’ (lead1, lead2), ‘food labelling’ (label3, label4) and ‘food composition’ (comp3) were the easiest to rate (>50% of the raters found them easy to rate), while the indicators within the domains of ‘governance’ (gover1, gover2), ‘funding and resources’ (funding2) and ‘workforce development’ (workf2) were found to be the most difficult to rate (>25% of the raters found them difficult to rate; figure 1).

Level of difficulty of rating for each of the good practice indicators (comp, composition; label, labelling; promot, promotion; prov, provision; lead, leadership; gover, governance; monit, monitoring; fund, funding; platf, platforms; workf, workforce; hiap, health-in-all-policies; see table 1 for details on each of the good practice indicators).
Completeness and appropriateness of the evidence presented
More than 80% of the raters found that the completeness and appropriateness of the evidence presented for the indicators within the domains ‘food labelling’ (label1, label2, label3, label4), ‘food promotion’ (promot1, promot2, promot4), ‘ food prices’ (prices1, prices2), ‘leadership’ (lead2), ‘food provision’ (prov1, prov4), ‘monitoring and intelligence’ (monit3) and ‘funding and resources’ (fund1) were sufficient or fairly sufficient. More than 50% of the raters found the evidence presented for the indicators within the domains ‘workforce development’ (workf1, workf2), ‘food provision’ (prov3), ‘funding and resources’ (fund2), governance (gover1) and ‘health-in-all-policies’ (hiap1) insufficient or fairly insufficient (figure 2).

Appropriateness and completeness of the evidence presented (comp, composition; label, labelling; promot, promotion; prov, provision; lead, leadership; gover, governance; monit, monitoring; fund, funding; platf, platforms; workf, workforce; hiap, health-in-all-policies; see table 1 for details on each of the good practice indicators).
The good practice indicators on subsidies (prices3) and cross-border broadcasting (promotion3) were found too problematic to rate during the workshop due to insufficient evidence. More research has to be carried out on those areas to improve the evidence base.
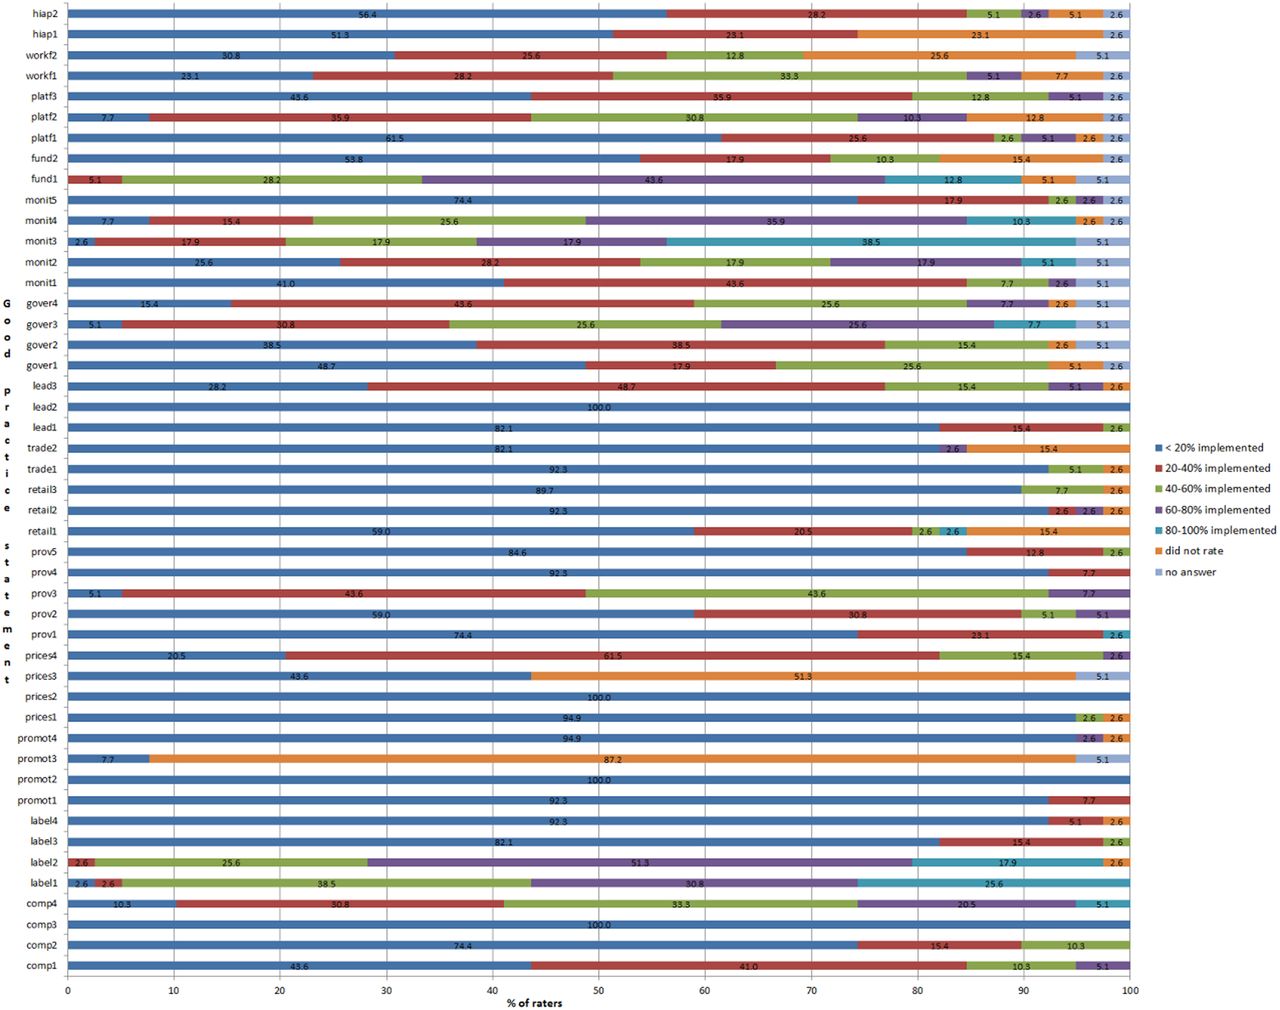
Distribution of ratings
The distribution of ratings for the different good practice indicators is presented in figure 3 and the average scores are presented in table 1. The largest variations of scores (SD >0.80) were obtained for the indicators within the domains ‘monitoring’ (monit2, monit3, monit4), ‘platforms for interaction’ (platf1, platf2, platf3), ‘governance’ (gover1, gover3, gover4), ‘food composition’ (comp1, comp4), ‘food provision’ (prov2), ‘leadership’ (lead3), ‘food retail’ (retail1), ‘workforce development’ (workf1) and ‘food labelling’ (label1).
Distribution of the ratings for each of the good practice indicators (comp, composition; label, labelling; promot, promotion; prov, provision; lead, leadership; gover, governance; monit, monitoring; fund, funding; platf, platforms; workf, workforce; hiap, health-in-all-policies; see table 1 for details on each of the good practice indicators).
Reasons for variations in rating scores for the good practice indicators are diverse: difficulty to rate, completeness and accuracy of the evidence presented, clarity of the good practice indicators and/or adequacy of international benchmarks to rate against.
The highest average scores (>2.5 or more than 50% implementation) were obtained for comp4, label1, label2, prov3, gover3, monit3, monit4, platf2 and fund1 (table 1).
Inter-rater reliability of the Food-EPI was 0.85 (95% CI 0.81 to 0.88), and increased to 0.89 (95% CI 0.85 to 0.92) after deletion of the good practice indicators difficult to rate and the ones for which the evidence presented was found to be insufficient (32 of 47 good practice indicators retained). There was no significant difference (p=0.92) between the mean rating scores of public health academics (n=18) and those of NGO representatives and other experts (n=21). Inter-rater reliability was similar among public health academics (0.88, 95% CI 0.87 to 0.90, n=18) and NGO representatives and other experts (0.82, 95% CI 0.76 to 0.88, n=21).
Adaptations to the Food-EPI tool based on rating results and synthesis of raters’ comments
The adapted Food-EPI tool can be found in table 1 (column 3). The major changes made, based on the results of the pilot test, include a stronger focus on equity. An extra good practice indicator on monitoring progress towards reducing health inequalities was added. An equity-based approach is also included as one of the overarching principles within the global NCD action plan.10
In addition, the leadership domain was strengthened, as the importance of setting population intake targets for nutrients of concern (such as sodium, saturated and trans fatty acids), and establishing and implementing evidence-based food-based dietary guidelines as a key role for government were recognised. Apart from their use in health promotion, these are important tools for policymaking as well. This has been recognised in the recent NCD global action plan of WHO.10
The workforce development domain has been deleted from the Food-EPI since the good practice indicators were found too difficult to rate and, according to experts, workforce capacity is a result of leadership and adequate funding.
The indicator on nutrition in school curricula has been deleted as most countries have this included somehow and it would be difficult to identify a good indicator to sufficiently discriminate between countries.
A good practice indicator on community-based programmes was added to the ‘platforms for interaction’ domain. Community-based programmes were not really captured within the Food-EPI, but have been shown to be effective to reduce obesity, and to be cost-effective and sustainable,19–22 and thus important to be added to the Food-EPI tool. An international benchmark for this may be the ‘Healthy Together Victoria’ programme, led by the Department of Health in Victoria, Australia.23
The government funding for population nutrition promotion (2012/2013) was found to be 29 million dollars or 0.21% of Vote Health in New Zealand, which is less than one-twentieth of what the health system pays for the consequences of overweight and obesity.24 However, this figure did not include government funding for research on obesity and NCD prevention. An additional good practice indicator was therefore added to the ‘funding’ domain (table 1).
In order to clearly distinguish ‘policies’ from ‘infrastructure support’, good practice indicators on monitoring food composition, food promotion and food provision have now been combined within the good practice indicator on monitoring food environments under the infrastructure support domain on ‘monitoring’.
Other specific changes for several domains include the following:
Food composition
Maximising the healthy components (eg, whole grains, fruits and vegetables) in food products was deleted as part of the overall domain good practice. Promoting fruit and vegetable consumption among the population is important and is part of population health promotion (captured under the domains of funding and leadership). For setting food composition and reformulation targets, however, it turned out that it was much more plausible and feasible to set upper limits of unhealthy components (eg, maximum salt content in bread or trans fats in processed foods) than setting lower limits of healthy components (eg, minimum amount of fibre in bread or breakfast cereals, or the amount of vegetables in ready meals). Food composition regulations are a difficult and low priority way to promote the intake of healthy components of food.
The evaluation of existence of targets and strategies to improve population intakes has been moved to the leadership domain as it is too broad to fit under the food composition domain only. Monitoring food consumption has been deleted, as performance of countries on food composition and consumption monitoring might differ, and monitoring food consumption was already part of the monitoring domain.
Food marketing
The good practice indicator on cross-border broadcasting has been deleted, since this issue ideally has to be addressed at the international level.
Food prices
The phrase ‘taking into account tax system efficiency, feasibility and distributional effects’ has been changed to ‘where possible’ for the first two indicators, as this level of complexity was not taken into account for any of the other good practice indicators. The second indicator now includes an additional part on reinvesting taxes for improving population health.
Food retail
The first indicator has been deleted as it was considered not to be of major importance for priority action by governments.
Governance
The indicator on using evidence and ensuring transparency has been separated into two different indicators. The last indicator was deleted in order not to overlap with platforms for interaction between government and civil society.
Monitoring
The regularity of monitoring was taken out as it depends on design of surveys and detail of information collected. International benchmarks will include regularity of surveys in other countries globally.
Funding
The indicator on transparency of government budget was taken out as accessibility to budgets will become apparent from the evidence collected for the indicator on government funding for population nutrition promotion.
No other major changes (apart from rewording to improve clarity of some of the good practice indicators) have been made to the Food-EPI tool.
Based on the comments of the raters, the evidence on extent of policy implementation by the New Zealand government for some of the good practice indicators will be revised and refined before full implementation of the Food-EPI in New Zealand (eg, specifically looking into government-funded research on obesity and NCD prevention, effective support of the government for international initiatives on obesity and NCD prevention, consideration of the intent of existing subsidies, more comprehensive overview of programmes and policies at the local level, proportion of ministry contracts funded specifically including an objective on reducing health inequalities, processes of establishing government committees and advisory groups, details on conflict of interest registers of boards and how these are managed, translation of global NCD targets and indicators into national action).
In addition, more or better international best practice exemplars need to be sought for good practice indicators within the infrastructure support domains against which experts rate government performance.
A list of key assumptions and definitions will be included as part of the Food-EPI tool as a help for the raters during the workshop (table 1).
Adaptations to the process based on rating results and raters’ comments
Some raters found that the time to read, discuss and answer was not sufficient for some of the indicators. In order to keep the timing feasible and have sufficient time for discussion, initial rating can be performed by the raters at home after reading the evidence. After presentation of the evidence and plenary discussion during the workshop, initial ratings may be changed.
Discussion
Overall, the raters found the Food-EPI process very useful and very informative. The Expert Panel included a good mix of expertise and skills, which informed the discussions. An incentive for them was to be updated on the extent of policy implementation by their government. Although the major aim of the Food-EPI tool and process is to increase government action on food environments, the potential of the Food-EPI to also enhance civil society's capacity to advocate for healthy food environments was clearly recognised.
Future developments
This study involved pilot testing the Food-EPI tool and process, and revising those for implementation in New Zealand and other countries of varying size and income.
Although experts from low-income and middle-income countries revised the Food-EPI tool in its development phase,13 additional pilot testing and adaptations for implementation of the tool and process in those settings might be needed. It is anticipated that the availability and accessibility of information on policy implementation might differ among countries.
For a small country with a dominant national government role for food policies the process is relatively simple, compared with a large country where responsibility for food policies is covered by different federal, state and local authorities. For subnational levels of government, it is proposed that these are sampled using either a complete sample (eg, for high-income countries such as Australia, with good data and a low number of subnational jurisdictions), or a stratified representative sample (eg, for high-income countries such as the USA with good data but a large number of states), or a sentinel site sample (eg, for low-income and middle-income countries such as India with less data and many states).
Implementing the Food-EPI tool and process will include an additional prioritisation approach with the national Expert Panel after the rating workshops. Based on the results of the ratings, the experts will formulate concrete actions for their government and these will then be prioritised by importance (need, impact, equity, other positive and negative effects) and achievability (feasibility, acceptability, affordability and efficiency) for the policy and infrastructure support domains separately.
A weighting system for the different domains and good practice indicators is being developed based on international evidence on effectiveness and expert opinions through a Delphi process. This will be mostly needed once benchmarking of countries is attempted.
Ideally, over time, theoretically defined good practice indicators should evolve into existing best practice real life benchmarks. The World Cancer Research Fund is developing a repository of international best practice examples on food policies for the purposes of benchmarking progress.7 This repository is expected to grow into sufficient numbers of examples to allow policy benchmarking for the Food-EPI. Further best practice examples will also be collected for the infrastructure support domains (eg, funding for population nutrition promotion in relation to NCD burden and as a percentage of the total health expenditure) as part of INFORMAS and in collaboration with WCRF and the World Obesity Federation. Benchmarks are very important to prevent that raters would be too harsh for their government. In this study, all average rating scores were lower than 4 out of 5 (<80% implemented), while, for example, the regulation on nutrition and health claims, and the associated nutrient profiling scoring system25 in New Zealand has been considered as an international best practice example by WCRF.
In addition, relevant country-level contextual information such as a set of existing relevant key country figures and indices, demographic and socioeconomic data, key information on population health, available infrastructure, resources and capacity, political system and structure, potential constraints for monitoring, and availability and accessibility of governmental documents and budget information should be collected when ranking countries, and this will allow the results on the Food-EPI to be interpreted in light of these important factors.
In order to assess whether the implementation of the Food-EPI will improve food environments, the impact of implementation of the Food-EPI tool and process on civil society’s capacity to advocate for healthy food environments and action of government to improve food environments, needs to be effectively measured. To measure the impact of the Food-EPI tool and process on civil society's capacity to advocate for healthy food environments, a tool will be developed for public health NGOs based on existing community readiness to change measures21 ,26 and community capacity indices.27
The impact of the Food-EPI tool and process on policies and actions of governments on food environments will be measured through structured interviews with policymakers, and through updating the evidence base for running the Food-EPI.
Conclusion
The international benchmarking of the extent of government policy implementation on food environments has the potential to catalyse greater government action to reduce obesity and NCDs, and increase civil society's capacity to advocate for healthy food environments. The impact of the implementation of the Food-EPI tool and process on government action and civil society's advocacy efforts has to be evaluated.
Acknowledgments
The authors acknowledge the NGO representatives and academics in New Zealand who participated in the rating workshops. The authors acknowledge the government officials who spent time answering official information requests and checking completeness of the evidence on implementation of policies. INFORMAS is the International Network for Food and Obesity/non-communicable diseases Research, Monitoring and Action Support. The authors wish to thank all founding members of the network for their contributions to development of the Healthy Food Environment Policy Index (Food-EPI). These members include (alphabetically mentioned): Simon Barquera (Mexican National Institute of Public Health), Sharon Friel (Australian National University), Corinna Hawkes (World Cancer Research Fund), Bridget Kelly (University of Wollongong), Shiriki Kumanyika (University of Pennsylvania), Mary L'abbe (University of Toronto), Amanda Lee (Queensland University of Technology), Tim Lobstein (World Obesity Federation), Jixiang Ma (Centers for Disease Control China), Justin Macmullan (Consumers International), Sailesh Mohan (Public Health Foundation India), Carlos Monteiro (University of São Paulo), Bruce Neal (George Institute for Global Health), Mike Rayner (University of Oxford), Gary Sacks (Deakin University), David Sanders (University of the Western Cape), Wendy Snowdon (The Pacific Research Center for the Prevention of Obesity and Non-Communicable Diseases), Chris Walker (Global Alliance for Improved Nutrition).
References
Footnotes
Collaborators INFORMAS.
Contributors SV and BS designed the study and methods. SV drafted the manuscript and BS critically revised draft versions of the manuscript. All authors read and approved the final manuscript.
Funding The authors acknowledge the National Heart Foundation (grant number 1580) for funding the rating workshops in New Zealand. SV and BS are funded through The University of Auckland Vice Chancellor's Strategic Fund.
Competing interests None.
Patient consent Obtained.
Ethics approval University of Auckland Human Ethics Committee (reference number 9326).
Provenance and peer review Not commissioned; externally peer reviewed.
Data sharing statement The data set is available upon request through email to: s.vandevijvere@auckland.ac.nz