Article Text

Abstract
Objective To evaluate the effectiveness of a computerised self-adjusting anticoagulant algorithm to predict appropriate warfarin dosing and to assess its use in clinical practice.
Design A 3-year audit of anticoagulant control in patients managed by doctors and pharmacists using computer decision support and an evaluation of the impact of dose adjustments made by the users.
Participants 3660 patients on oral anticoagulants; one-third of patients managed by doctors and two-thirds by pharmacists.
Setting Anticoagulant supervision in primary care and pharmacies at 60 sites in New Zealand.
Main outcome measures The time in the therapeutic range (TTR), the outcome of adherence to the computer dosing algorithm, the percentage of time the clinicians over-ride the algorithm and the impact of their intervention on anticoagulant control.
Results A TTR of 72.9% was achieved for all patients. The TTR was significantly better in patients managed by pharmacists than doctors (75.1% versus 67.4%, p<0.0001). The computer algorithm provides appropriate dose recommendations for INR results from 1.5 to 4. Users administered a dose that differed from the computer recommendation 23.3% of the time. The doctors adjusted the dose more frequently (28.2% versus 21.1% of tests) and made larger dose changes than the pharmacists.
Conclusions The clinicians predominantly change the dose when the INR is below the therapeutic range. The changes are not necessary to correct for inaccuracies in the algorithm. The most likely explanation is the clinician's belief that their own dose adjustment would achieve better control; however, in practice, their changes tend to underdose patients. The doctors achieved poorer control than the pharmacists; this is in part due to the action of the doctors over-riding the algorithm. Our results imply that clinicians could achieve better anticoagulant control if they more closely followed the computer algorithm.
- CLINICAL PHARMACOLOGY
This is an Open Access article distributed in accordance with the Creative Commons Attribution Non Commercial (CC BY-NC 4.0) license, which permits others to distribute, remix, adapt, build upon this work non-commercially, and license their derivative works on different terms, provided the original work is properly cited and the use is non-commercial. See: http://creativecommons.org/licenses/by-nc/4.0/
Statistics from Altmetric.com
Strengths and limitations of this study
Decision support software programs are widely used for the management of oral anticoagulants, but these have not been thoroughly evaluated in clinical practice, and the impact of intervention by clinicians over-riding the decision support software has not been studied.
Data are analysed from two large cohorts of patients on anticoagulant therapy (3600 patients), both using the identical decision support software.
Anticoagulant treatment data are accurately recorded and data are available for all INR measurements (74 000).
This is a retrospective audit of unselected patients; therefore, confounding factors in one population could contribute to the difference in anticoagulant control seen between the two groups.
Introduction
Warfarin usage has declined with the introduction of the newer oral anticoagulants, but it is still widely used, especially for the management of patients with mechanical valves and for those intolerant or unsuitable for the newer agents. In practice, well-controlled warfarin with a time in the therapeutic range (TTR) of over 70% has a similar risk–benefit profile to the newer agents,1 and therefore remains a good option for many patients if this level of control can be achieved.
We developed a computerised warfarin dosing algorithm as part of an internet-based warfarin management system (INR Online Ltd), in an attempt to improve warfarin control. The dosing algorithm is unique and automatically adjusts certain parameters specifically for each patient.
The aim of this audit was to evaluate the effectiveness of the algorithm to predict an appropriate warfarin dose and to assess control in clinical practice. The online warfarin management system has been used in New Zealand by two groups of users: anticoagulant services managed by general practitioners and a community pharmacy-based anticoagulant service managed by pharmacists. We have evaluated warfarin control by both groups of users over a 3-year period in more than 3600 patients.
Patients and methods
Computer anticoagulant management system
An online computer management system (INR Online Ltd) was developed and underwent pilot studies in 2006 and has been used in clinical practice since 2008. It was initially used to manage patients in a remote region of New Zealand using point-of-care testing and for patients using self-management2 but more recently has been taken up by general practitioners. The software was first used by pharmacies in a pilot study in 2010 and has been adopted by the Ministry of Health as the software management system for the National Community Pharmacy Anticoagulant Management service.3
In New Zealand, accredited pharmacists have been able to manage anticoagulant patients since 2010. There are limitations to the pharmacists’ practice controlled by a standing order; of note, the pharmacist can only manage patients established on warfarin and cannot initiate warfarin therapy.
The testing process and data storage
INR Online is a comprehensive anticoagulant management system that offers automated dosing and a recommended date for the next test. It records INR results, test dates, warfarin doses and details of compliance, adverse events, changes in medication and hospital admissions for each patient. All results are automatically transferred to the doctor's Patient Management System and to the national storage repositories for laboratory results. Patients have access to their own results online; they receive a printed dosing calendar after each test and an email reminder when their next test is due. The system automatically provides reports on control (TTRs), compliance, adverse events and test frequency. These are reported to the Ministry of Health each month.
The dosing algorithm is based on the assumption that if all external factors were stable, each patient could be maintained on their own ‘optimum’ dose. If the INR falls outside the therapeutic range, the algorithm adjusts the dose accordingly, but reverts to the ‘optimum’ dose as soon as the INR is back under control. The optimum dose is constantly modified over time based on the previous INR results and level of control. The dose adjustment also takes into account two other parameters: the individual patient's sensitivity to warfarin and the stability of control. These two parameters change automatically over time to help maintain stable control.
Pharmacists are not able to start new patients on warfarin and can only take on cases after the initial loading. To eliminate the influence of data from patients recently started on warfarin, the results for the first 28 days of treatment for all new patients were removed.
Patients
The audit was carried out over a 3-year period between October 2010 and October 2013. A total of 3664 patients on oral anticoagulant therapy were managed using the online management system; 1188 patients were managed by doctors in general practice and 2476 were managed by pharmacists through the community pharmacy service. Ethics approval was not required as this is a clinical audit reviewing practice. The study was unfunded.
Anticoagulant control was assessed by monitoring TTR using the method of Rosendaal.4 Population means were compared using the z-test for large sample comparison and t testing for comparison of results at each INR value. The incidence of adverse events was compared using χ2 test. A p value of <0.01 was regarded as statistically significant.
Results
Time in the therapeutic range
TTR was 72.9% for the full cohort of patients based on 1.51 million treatment days. TTR was significantly better in patients managed by pharmacists compared with those managed by doctors (TTR 75.1% versus 67.4%, p<0.0001). The difference is largely due to the INR being below the therapeutic range for significantly more time in the patients managed by doctors. The time above the therapeutic range was similar in both groups (table 1).
Time below, above and within the therapeutic range
Dose modifications
A dose recommendation is generated by the algorithm each time an INR result is entered. During the review period, 74 330 INR results were entered, and in 76.6% the computer recommended dose was given to the patient. In the remaining 23.4%, the doctor or pharmacist administered a dose that differed from the computer recommendation. In approximately half (11%) of these, the dose change was small at 0.5 mg or less per day. In our series, doctors over-ride the algorithm significantly more frequently than pharmacists (28.2% versus 21.1% (difference 7.1%, CI 6.4% to 7.7%, p<0.001); table 2).
Total number and percentage of computer recommended doses administered
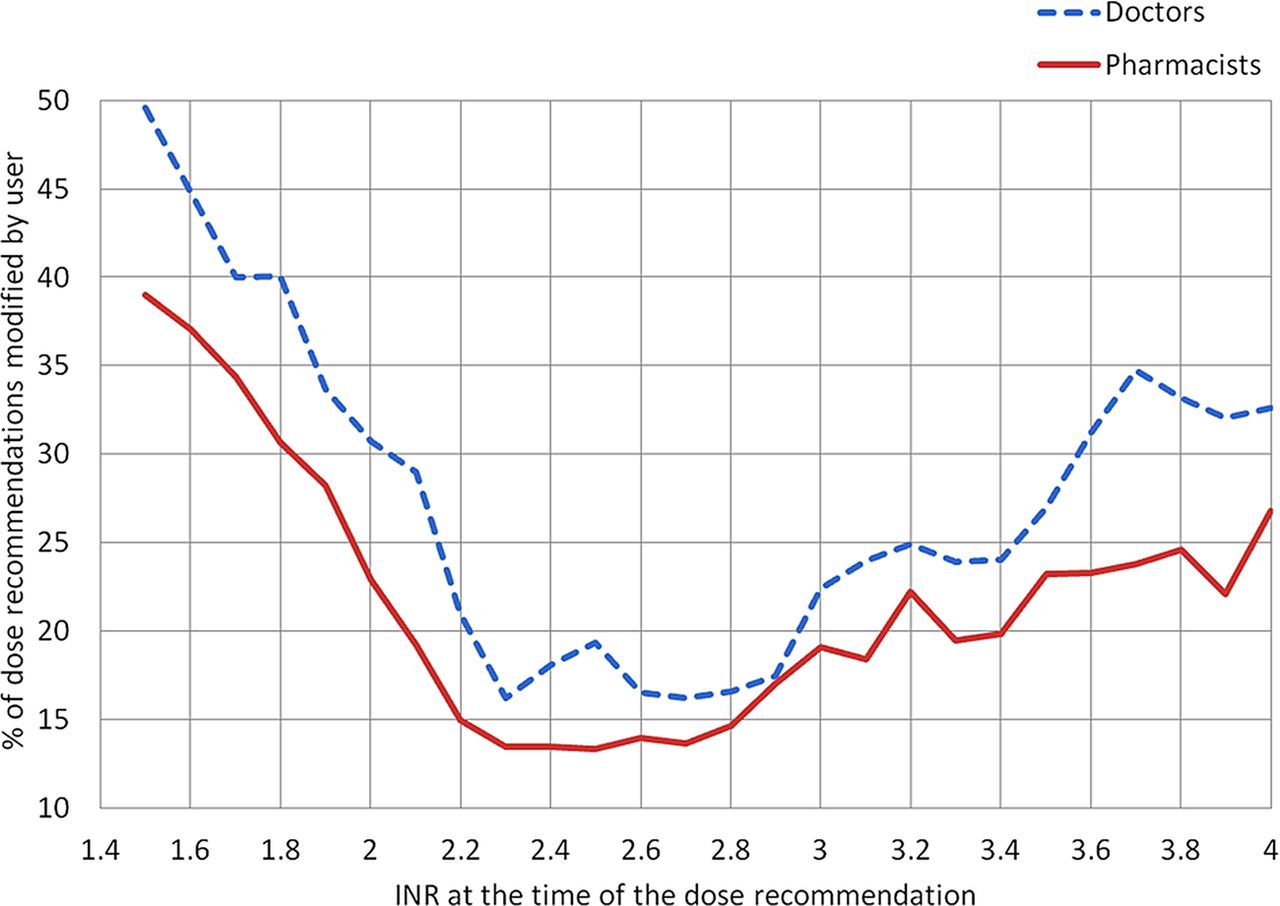
The proportion of times the user over-rides the algorithm differed depending on the INR at the time of the test. When the INR was low at 1.5, up to 50% of the patients received a dose that differed from the computer recommendation; however, when the INR was in the therapeutic range, under 20% of doses were altered (figure 1). In a proportion of patients, the doctors and pharmacists administered a dose lower than the computer recommended dose when the INR was within or below the therapeutic range with the most marked difference when the INR was below 2 (figure 2). The doctors made significantly larger dose reductions than the pharmacists (figure 2).

Percentage of results where the dose administered by the doctors or pharmacists differed from the computer recommendation in relation to the INR result at the time the recommendation was made. All results are from patients with a recommended therapeutic range for the INR of 2–3.

The difference between the computer recommended dose and given dose was calculated for each test where the computer recommended dose was not administered. The results were grouped by the INR result at the time of the test and the mean dose difference (±SEM) plotted against the INR.
The effect of the dose changes
To evaluate the outcome of the warfarin dosing, we looked at what effect the given dose had on the next INR result. In the ideal case, the dose selected by the user would be expected to result in an INR at the target value at the next test; if the dose is too low, the resulting INR would be below the target value, and if too high it would be above the target. Therefore, to assess the precision of the dosing, we measured the difference between the next INR and the target INR for all tests. If the correct dose had been selected, the mean difference would have been zero.
Computer recommended dose given
When the user adhered to the computer recommended dose (57 000 tests), the mean difference between the INR at the next test and the target INR was less than 0.2 for all INR values between 1.5 and 4 (figure 3A), suggesting that the computer algorithm is giving an appropriate dose recommendation over this range of INR values.

For all tests, the difference between the INR at the next test and the target INR was calculated. Results were grouped by the INR at the time of the first test; the mean difference was calculated (±SEM) and plotted against the initial INR result. Computer recommended dose given—solid line. Dose changed by the user—broken line. (A) All results from INR 1.3 to 4. (B) The outcome of dose changes made by doctors compared with computer dosing for INRs below the target INR. (C) The outcome of dose changes made by pharmacists compared with computer dosing for INRs below the target INR.
Computer recommended dose altered by user
When the user gives a dose that differs from the computer recommended dose, the outcome is different depending on the INR result at the time of the test. When the INR is above the target value of 2.5, the difference between the INR achieved using the computer dose and the user's modified dose is small. There is a tendency for the user to overdose patients when the INR is above 3, but the resulting INR is not significantly higher than that attained when the computer recommended dose is given (figure 3A).
However, when the INR is below the target value, the resulting INR is significantly lower when the user's modified dose is administered rather than the computer recommended dose. The difference becomes more marked the lower the INR value of the original test, and the difference is larger for patients managed by doctors (figure 3B) than those managed by pharmacists (figure 3C). These results suggest that the dose modifications made by the user will tend to underdose patients when the INR is low.
Adverse events
Details of adverse events are recorded in the computer system. Patients are asked about episodes of bleeding, missed medication, new medication and hospital admissions each time an INR result is entered. These questions must be answered before the computer will generate a dose recommendation (table 3), but the user can easily ignore these questions as the default answers are no. Our results show that the pharmacists reported bleeding and hospital admissions significantly (p<0.01) more frequently than the doctors. This probably reflects that the pharmacists adhered more closely to their management protocol where it is a requirement for them to record these data, whereas the doctors can choose to record this information at their discretion.
Percentage of tests where the patient reported an adverse event since the last test
Patient demographics, testing frequency and compliance
The two groups of patients had similar demographics with a similar median age, gender ratio and diagnostic groups (table 4). The interval between tests was similar; however, compliance with the specified testing date was better in patients managed by the pharmacists than in those managed by the doctors (table 5). This again probably reflects closer adherence to a rigorous protocol where the pharmacists contact non-attenders as part of their management process.
Patient demographics and test interval: median age, proportion of male patients, clinical indication for warfarin and mean and median time between INR tests in days for patients managed by doctors and pharmacists
Compliance: percentage of patients who had INR testing on the specified test date or within a specific time frame for patients managed by doctors and pharmacists
Discussion
Our audit demonstrates that clinicians can achieve a high level of anticoagulant control with TTR of 73% using our decision support software. This type of software is widely used for the management of oral anticoagulants, and other studies have shown that computer systems can improve control.5 However, no previous studies have looked in detail at how the clinicians use the software and to what extent they over-ride the decision support software recommendations. Our audit offers a unique opportunity to examine this in two discrete groups of clinicians to see if there are differences in practice and to see if this has any impact on anticoagulant control. In our audit, approximately one-third of patients are managed by doctors with experience of warfarin management and two-thirds are managed by pharmacists with no previous experience who attended a 1-day training course before taking on anticoagulant supervision. Unexpectedly, the pharmacists achieved significantly better anticoagulant control than the doctors with a TTR of 75.1% and 67.4%, respectively. There are obviously several confounding factors that influence anticoagulant control, but this finding led to further evaluation to see if the practice of the clinicians could at least in part explain the difference in control.
Our results show that both groups of clinicians over-ride the dosing algorithm and give a warfarin dose that differs from the computer recommendation at least 20% of the time. We would not expect the user to follow the algorithm at all times as it is not precise and there are clinical situations where a dose change may be necessary; however, such a high percentage of altered doses is of concern as one possible explanation is that the algorithm is not performing as expected. The algorithm provides a dose recommendation with every test and is designed to adjust control over time so that it provides appropriate dosing advice even in unstable patients. Therefore, if our algorithm was working ‘correctly’, we would expect the users to adhere to the dose recommendations most of the time. However, our evaluation does not support the hypothesis that the algorithm is at fault, but shows that it performs as expected over a wide range of INR values (1.5–4; figure 3A); therefore, there must be an alternative explanation for over-riding the algorithm.
Intervention by clinicians
Our results show that both the doctors and pharmacists have a tendency to underdose patients when the INR is below the therapeutic range. They alter the dose most frequently when the INR is subtherapeutic (figure 1), with a propensity to administer a dose lower than the computer recommendation (figure 2). The cumulative effect results in a mean INR below the target value at the next test (figure 3). Whatever the reason for the clinician's intervention, it will have an impact on anticoagulant control.
The only reason clinicians over-ride the algorithm is that they believe their selected dose is more appropriate or safer than the computer generated advice. In some cases, this could be appropriate to avoid an overdose and prevent erratic control with frequent dose changes, but what is not clear is why the doctors make more frequent (29% versus 21%) and significantly larger dose changes than the pharmacists (figure 2). The more frequent dose changes cannot be explained by differences in the patient populations. Although our patient groups are comparable with a similar proportion of patients in each diagnostic group, a similar age distribution, gender ratio and testing frequency (table 4), it is still likely that the doctors had a higher proportion of complex cases with unstable control or poor compliance (table 5) under their care. In spite of this difference, there is no reason why the user should over-ride the algorithm more frequently or make larger dose changes in complex unstable patients if the algorithm is performing as expected. In these cases, the dose recommendation for each individual INR result should still achieve an INR close to the target value at the next test. Even if there were a large number of unstable patients under the care of the doctors, where the INR oscillates around the target value, the only measurable effect in our audit would be an increase in the SE of the mean at each INR value. The presence of complex or unstable cases does not explain why the doctors give significantly lower doses than the pharmacists.
The most likely reasons for the difference in practice are that the doctors are more cautious than pharmacists when it comes to warfarin management and are more willing to over-ride the dosing algorithm. The pharmacists have only recently been approved to supervise warfarin management in New Zealand and have been provided with a strict treatment protocol which recommends close adherence to the algorithm, whereas the doctors act more independently and do not follow a specific protocol and feel at liberty to over-ride the algorithm as they believe appropriate. The tendency for doctors to underdose patients may reflect their inherent concern about the risk of bleeding in poorly controlled patients.
The different practice by the doctors raises the question: do the more frequent and larger dose changes explain why the doctors achieved significantly poorer anticoagulant control (TTR 67.4%) than the pharmacists (75.1%)?
This is difficult to answer from our audit as there are other confounding factors that affect anticoagulant control, in particular, differences in the patient populations. Nonetheless, the more cautious dosing by the doctors will definitely have some impact on control, but it is not possible to determine what proportion of the difference is due to the more cautious dosing and what is due to the different patient characteristics. The impact of the doctors’ actions on anticoagulant control is relevant as the doctors over-ride the algorithm up to 50% of the time when the INR is below the therapeutic range and make significant dose reductions; the cumulative effect of these changes leads to a shift in control, which at least in part explains why the patients under the care of the doctor have a higher proportion of the time below the therapeutic range (table 1).
Adherence to the dosing algorithm and protocol
Our results support the findings of a number of other studies that show that a key factor in good anticoagulant control is adherence to a dosing algorithm.6 In our series, we developed a computerised algorithm which specifically adjusts parameters for individual patients and has enabled clinicians to achieve a high level of control with a TTR of over 75%. This is in line with other studies showing that computer assisted dosing improves anticoagulant management.2 ,5 ,7 However, the specific details of the algorithm are probably not the main determinant of good anticoagulant control. In one series, a simple dosing algorithm achieved the same level of control as a computer system,8 and data from the randomised evaluation of long-term anticoagulation therapy (RELY) study showed that there was a direct correlation between adherence to a simple algorithm and TTR.9 The most important factor appears to be the proportion of time the user adheres to the algorithm. In our series, the pharmacists adhered to the algorithm 80% of the time compared with only 70% by the doctors.
It is also quite likely that adherence to a structure protocol has some impact on control. Our results suggest that the doctors do not adhere to protocol as closely as the pharmacists. In our series, the pharmacists recorded significantly more episodes of bleeding than did the doctors. It is unlikely that bleeding occurred more frequently in the group of patients with better control; the most likely explanation for this finding is due to under-reporting by the doctors who are able to over-ride the safety question, whereas the pharmacists know that they are required to ask the patients about bleeding before every test.
Our results also show that deviating from the algorithm leads to underdosing with a higher proportion of time below the therapeutic range. A similar finding was reported by Kim et al.10 They showed that the introduction of a simple two-step dosing algorithm significantly reduced the proportion of time below the therapeutic range. Another study comparing computer assisted dosing with manual dosing showed that dose adjustments made by clinicians, based on experience, tended to underdose patients, whereas the computer algorithm achieved better control.7 We also observed a similar trend in an audit of patients managed by general practitioners who were not using any form of algorithm; this showed that the INR was below the therapeutic range for approximately 25% of the time.11
The doctors’ more cautious approach to management has potentially important clinical consequences. There is a clear correlation between TTR and adverse outcomes in patients on warfarin,12 and patients with atrial fibrillation may be at particular risk as the incidence of stroke is higher when the INR is below 2.13 ,14
Conclusions
One of the key findings of our audit is that a group of approximately 100 pharmacists managing 2500 patients over 3 years can achieve a high level of anticoagulant control using our decision support software. They have little prior experience and tend to follow the dosing algorithm more closely than the doctors using the same software. The fact that the doctors achieved worse anticoagulant control and over-ride the algorithm more frequently for no clear clinical benefit implies that the doctor may achieve better control if they more closely followed the advice of the computer algorithm.
References
Footnotes
Contributors PH developed the audit, reviewed and analysed data and prepared the manuscript. JH was involved in data analysis and reviewed the manuscript. CH was involved in medical supervision of the project and reviewed and revised the manuscript.
Funding This research received no specific grant from any funding agency in the public, commercial or not-for-profit sectors.
Competing interests PH and JH are directors of INR Online Ltd.
Provenance and peer review Not commissioned; externally peer reviewed.
Data sharing statement No additional data are available.