Article Text

Abstract
Objectives To investigate the association between birth weight and blood pressure (BP) and to determine the effect of body size change from birth to adulthood on BP.
Design A cross-sectional design to collect retrospective data.
Participants 1253 female nurses aged 35–65 years in Hong Kong.
Main outcome measures Birth weight, height, weight, BP, waist circumference, demographics and lifestyle factors were collected by a self-administered questionnaire through mail survey. These self-reported variables have been validated in a pilot study. The conditional relative weight (CRW), which was calculated as a residual of current weight regressed on birth weight, was used to express higher or lower relative weight gain from birth to adulthood.
Results No significant linear association between overall range of birth weight and BP was found. The curve estimation showed a significant quadratic curvilinear association (‘J’ shape). In the piecewise-linear analysis, a significant inverse association between birth weight z-scores and BP was observed in the birth weight ≤3.1 kg group (systolic BP (SBP): coefficient B=−1.73, 95% CI −3.17 to −0.30; diastolic BP (DBP): B=−1.12, 95% CI −2.19 to −0.06). A positive but non-significant association occurred in the birth weight >3.1 kg group. Participants who belonged to the lowest 10% birth weight category but at the current top 10% BMI group had higher BP than participants in other BMI groups. The CRW z-score was positively associated with BP (coefficient B: 4.18 for SBP and 2.87 for DBP).
Conclusions Unlike most previous studies, we found a ‘J’ shape association rather than a linear association between birth weight and BP. Women with large percentile crossing of body size from birth to adulthood were more likely to have elevated BP. A higher weight gain from birth to adulthood than expected led to higher BP.
- Birth weight
- Blood pressure
- Body mass index
- Fetal programming
- Chinese women
This is an Open Access article distributed in accordance with the Creative Commons Attribution Non Commercial (CC BY-NC 3.0) license, which permits others to distribute, remix, adapt, build upon this work non-commercially, and license their derivative works on different terms, provided the original work is properly cited and the use is non-commercial. See: http://creativecommons.org/licenses/by-nc/3.0/
Statistics from Altmetric.com
Strengths and limitations of this study
This is the first study using curve estimation to examine the relationship between birth weight and adult blood pressure in the Hong Kong Chinese adult population. We observed a quadratic curvilinear association, which indicates that not only the thinnest infants but also the biggest infants may be susceptible to higher blood pressure in later life. The common use of linear regression between overall range of birth weight and blood pressure in previous studies may underestimate the true association.
We used a cross-sectional design to collect retrospective data, as well as the self-report measures, which may limit the precision of estimating the strength of association between birth weight and blood pressure.
The study sample is not representative of the general population as the study participants were nurses and the response rate to the mail survey was low.
Introduction
Early life environment plays an important role in causing later susceptibility to many chronic diseases.1 ,2 The importance of events before birth on lifetime health has been confirmed in many populations.3 One of the key findings was that lower birth weight predicted higher blood pressure (BP) in later life.4 ,5 Despite the criticisms6 ,7 of publication bias, random error or other methodology problems, many studies have shown a linear inverse association between birth weight and BP. They found that a 1 kg increase in birth weight was associated with a decrease of systolic BP (SBP) from −0.21 to −6.4 mm Hg.5 ,8–18 However, many of the effect estimates have wide CIs. The investigators disagree in their conclusions concerning whether this inverse association is real and significant.
Current concepts of the mechanisms of low birth weight leading to high BP include19 ,20: (1) impaired development of the endothelium; (2) increased sensitivity to glucocorticoids; (3) reduced nephrogenesis with a higher threshold for pressure natriuresis and greater susceptibility to progressive renal disease. All those mechanisms are based on low birth weight, an indicator of undernutrition during fetal programme. However, in utero poor nutrition status may not be applicable to normal and high birthweight babies; thus, the reported linear inverse association of birth weight with BP may not describe a precise relationship between these two variables. Furthermore, evidence21 has shown that higher birth weight leads to higher later life body mass index (BMI), which in turn is associated with high BP. It is therefore a paradox that high birth weight is associated with low BP. In fact, some other studies found a ‘J’ shape22 ,23 or ‘U’ shape24 pattern between birth weight and BP, in which both ends of the distribution of birth weight lead to high BP. Thus, it is important to re-examine the strength and nature of the association between birth weight and BP, by carefully examining the effect of the different segments of birth weight, as well as critically considering the relationship between birth weight and concurrent body size. Furthermore, low birth weight followed by ‘catch-up growth’ has been indicated as an important risk factor for later diseases.25 Lucas et al26 pointed out that postnatal body size change (postnatal centile crossing) rather than fetal biology may play a role on the development of later health outcomes. Whether birth weight plays an independent role in developing high BP in adult life, as well as the effect of postnatal body size change on BP, need to be further elucidated.
We report a study among a sample of Hong Kong Chinese adult women, with the specific aims to determine whether a non-linear association between birth weight and BP exists, and to address the effect of centile crossing of body size from birth to adulthood on BP.
Methods
Study design and sample
This study was integrated in a life course epidemiology study named ‘Hong Kong Women's Health Study (HKWHS)’ in 2010. The HKWHS investigated the relationships between early life exposures (eg, birth weight, physical activity in adolescence) and later life outcomes (eg, adult obesity, hypertension) among female Chinese nurses aged from 35 to 65 years. The study protocol was approved by the Research Ethics Committee of the Chinese University of Hong Kong. Hypertension was one of the major outcomes in the HKWHS; the initial sample size was then calculated based on the primary statistical approach between the birth weight and hypertension. We proposed to detect 20% fewer odds of hypertension with a 1 unit increase in birth weight,27 with 80% power and at the 95% level of statistical significance. After calculations, a required sample of 985 nurses was determined. The anticipated response rate was 20%, and the expected missing questionnaire was 10%. Consequently, the total number of questionnaires to be sent was calculated as: (985÷20%)÷(1–10%)=5472 (≈5500). The Association of Hong Kong Nursing Staff (AHKNS) helped with the systematic sampling of 5500 eligible nurses from their membership database. Every 17 000÷5500≈3rd participant was selected from a sorted name list of 17 000 eligible nurses, with the first participant chosen at random. A mail package was sent to the selected nurses’ home address. The mail package included a 4-double page questionnaire that consisted of 33 questions together with a cover page and an informed consent form; a paper tape measure; an introduction leaflet and a prepaid return envelope.28 All participants returned a signed statement of informed consent. After the first round mailing, the second round mailing was conducted 3 months later with the non-respondents. 975 valid questionnaires were received; the response rate was 17.8% (excluding 13 undeliverable packages). In order to increase the sample to the proposed sample size (985), the third round mailing was conducted, with an additional selection of 2820 nurses from the AHKNS database by the system sampling technique. 278 valid questionnaires were received with a response rate of 9.9% (excluded 5 undeliverable packages). In total, there were 1253 participants.
Measurement
Birth weight, height, weight, BMI and waist circumference
Participants were asked to write down the exact value of their birth weight on the questionnaire in either kilograms or pounds. They reported their height in either centimetres or inches, their weight in either pounds or kilograms. All data were converted to metric units (metres or kilograms) for analysis. BMI was calculated as weight in kilograms divided by the square of height in metres (BMI=kg/m2). Using the WHO standard for Asian populations,21 obesity was defined as BMI ≥25 kg/m2 and overweight was defined as 23.0 kg/m2≤BMI<25.0 kg/m2. The guideline for measuring waist circumference was printed on the introduction leaflet. Waist circumference should be measured at a level mid-way between the lower rib margin and iliac crest with the tape all around the body in horizontal position. Participants were encouraged to use the complimentary paper tape measure to measure their waist circumference.
Conditional relative weight
In order to estimate the separate contributions of birth weight and change in weight from birth to adulthood to BP, we used conditional relative weight (CRW) to express the relative weight change from birth to adulthood that is uncorrelated with birth weight.29 CRW was defined as the amount by which the weight at adulthood exceeds that which would have been predicted at birth; it was calculated as standardised residuals (z-score) by regressing current weight on birth weight. A positive value of CRW indicates gaining more in weight than would be expected from a given birth weight.
Blood pressure
Participants were asked to report the BP value based on the most recent body check. In addition, if a sphygmomanometer was available, they were asked to measure their BP at least twice, in person or by another professional person, and write down the mean BP on the questionnaire. Those taking antihypertension medicine at the time of the questionnaire were asked to report the BP value before medication started. For those participants with self-reported hypertension, their BP was verified by a later telephone contact. Hypertension was defined as systolic BP (SBP) ≥140 mm Hg or diastolic BP (DBP) ≥90 mm Hg by WHO standards.
Demographic characteristics, lifestyle factors and other health information
Demographic characteristics included age, current marital status, education level, occupation and who they were residing with. Lifestyle factors included smoking, drinking, salt intake during the past 5 years and physical activity. Participants were also asked to provide information on whether their birth was a premature or a twin birth, their menopause status and family history of hypertension.
Validating self-reported variables
Participants were asked to indicate their sources of birth weight22: own memory, from parents, hospital record card and other. The birthweight data from these three sources were compared with each other. They were also compared with data collected from previous studies in Hong Kong. The validity of self-reported weight, height, waist circumference and BP was examined by inviting 144 (11.5%) participants to have their body measurements at the research centre. Face-to-face measurements were taken by the research staff according to the standard protocols. Every participant was measured twice, and the mean of two measurements was calculated. The measured values were compared with their self-reported values to assess the validity of these self-reported measures.
Statistical analysis
To estimate the preliminary associations of birth weight with BP, BMI and other variables, one way analysis of variance or Pearson χ2 test or Fisher's exact test was conducted where appropriate. Curve estimation was used to describe the association between birth weight and BP. Stratified analysis was used to examine the BP levels among different participant groups by different birth weight and current BMI percentile status. Birth weight and BMI were divided into four categories for each variable, according to the percentile distribution: bottom 10%, 10–50%, 50–90%, top 10%. The mean of BP was calculated by cross tabulation of each of the two variables’ percentile distributions. So there were 16 (4×4) mean values of BP corresponding to 16 types of body size change from birth to adulthood. Analysis of covariance (ANCOVA) was used to examine the association between body size change and BP. Finally, multiple liner regression analysis was applied to investigate the associations of birth weight and changes in weight from birth to adulthood with BP. Age, height and waist circumference all had significant associations with BP and birth weight; they were treated as potential confounders and thereby adjusted in the regression models. Birth weight was converted into z-score for analysis. The unexplained residual regression models29 were used to estimate the strength and direction of the association. First, the contribution of birth weight and CRW on BP was examined by simple regression models (without adjustment) respectively; second, covariates were adjusted in each model; third, we included CRW and birth weight in one model to see their total contributions on BP; finally, the interaction between CRW and birth weight was tested. SPSS V.20.0 was used for data analysis. Statistical significance was defined as p value <0.05.
Results
General characteristics of participants
Among 1253 participants, 1192 participants (95.1%) reported birthweight information, while 1217 participants (97.1%) reported BP data. No significant differences of demographic characteristics were found between participants who presented and those with missing data on these two values (all p>0.05). The missing values of other key variables including age, gender, current weight, height and waist circumference were all less than 2%. Most of the participants were married (73.3%) and lived with their husband and children (57%), while more than 70% had received high education and 85% were employed as nurses. The prevalence of overweight/obesity and hypertension was 30.6% and 10.6%, respectively. Birth weight ranged from 1.4 to 5.4 kg. Table 1 gives the characteristics of the participants and the differences between subgroups according to birth weight. Since the mean and SD of birth weight were 3 and 0.5 kg, the cut-off points of birth weight groups were chosen to be 2.5, 3.0 and 3.5 kg. Participants with a higher birth weight were more likely to be taller and heavier; and those who were twins or born prematurely tended to have lower birth weights (table 1).
Participants’ characteristics according to birthweight (kg) groups*
Validity of self-reported birth weight, anthropometric variables and BP
In total 76.3% of the participants obtained information on their birth weight from their parents, 21.5% from their own memory and 2.2% from hospital records or other sources. There was no difference in the mean birth weights from these three different sources (p>0.05).
The self-reported and measured anthropometry and BP were highly correlated (correlation coefficients ranged from 0.72 to 0. 96). No significant differences were found between self-reported and measured BP, weight and BMI (all p>0.05), while height was overestimated and waist circumference was underestimated at an average of 0.42 and 2.33 cm, respectively (both p<0.05). The self-reporting resulted in correct classifications of BMI, waist circumference and SBP in 85%, 78% and 87% of nurses, with corresponding κ index values of 0.79, 0.55 and 0.82, respectively. The respective sensitivity and specificity were 84.6% and 95.7% for overweight/obesity detection, and 70.6% and 83.8% for central adiposity detection. The results suggest that the validity of self-reported variables in our study was generally acceptable.
Percentile stratified analyses of birth weight, BMI and BP
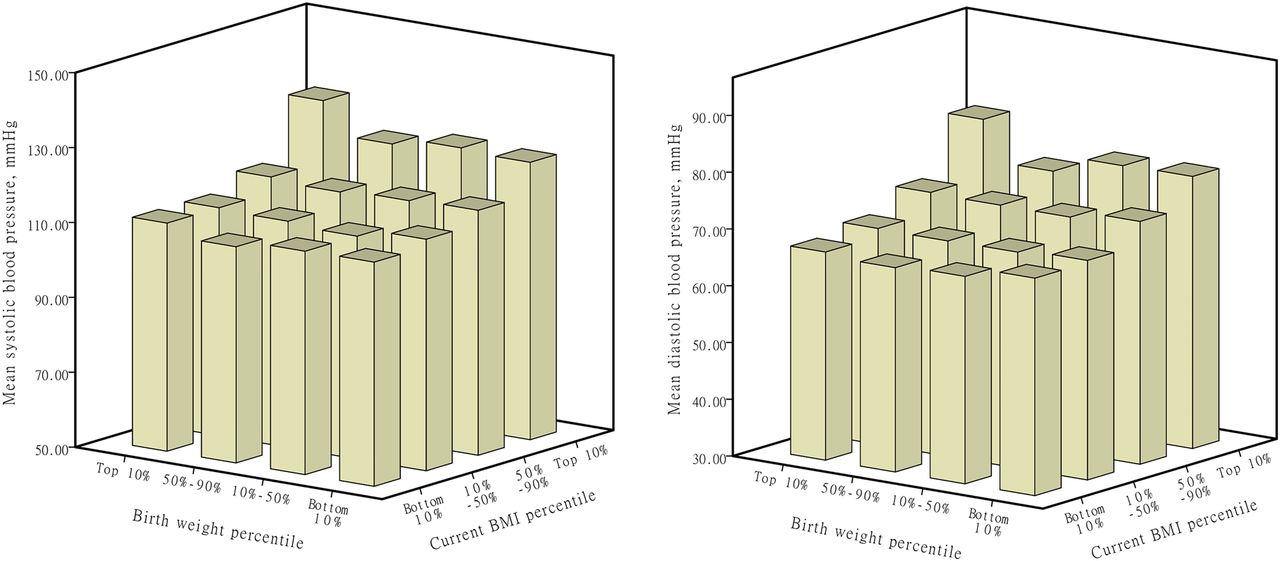
On average, the highest SBP and DBP were observed among participants who belonged to the top 10% for birth weight and current BMI (SBP: 131.2 mm Hg, DBP: 81.7 mm Hg) (table 2). In each BMI percentile strata, higher BP values were observed among the participants in both ends of the birthweight percentile strata (eg, in the 10–50% BMI strata, SBP: 115.4 and 115.0 vs 114.7 and 114.5). Furthermore, participants who belonged to the lowest 10% at birth, but the top 10% for the current BMI, appeared to have higher SBP and DBP values compared with all other current BMI categories (SBP: 126.1 mm Hg; DBP: 78.6). ANCOVA analysis showed significant associations of BMI with BP. No significant interaction between birth weight and BMI percentile on BP was observed, when controlled for age, height and waist circumference (table 2 and figure 1).
Cross tabulation of mean blood pressure according to the percentile distributions of birth weight and BMI

Mean blood pressure according to birthweight percentiles and body mass index percentiles.
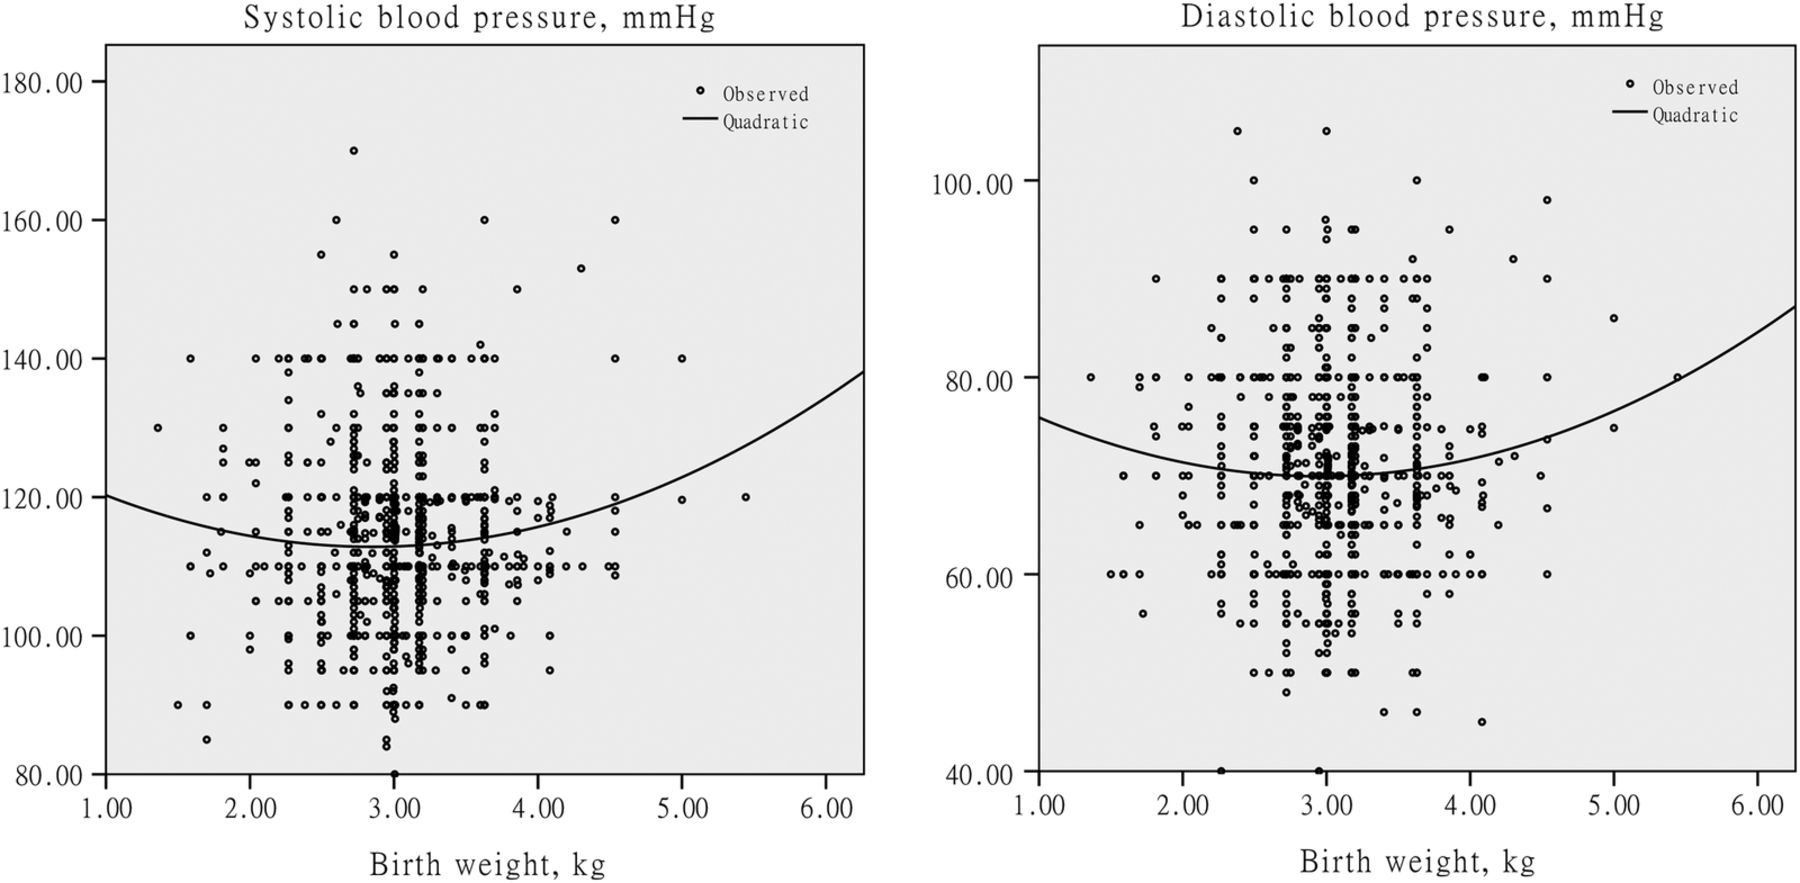
Distribution curve of BP by birth weight
Lower mean BPs were observed in participants belonging to the first three birthweight categories, while a higher mean BP was observed in the >3.5 kg group (table 1). A ‘J’ shape association between BP and birth weight was noted. The curve estimation of this ‘J’ shape relationship revealed a quadratic curve association with the following equations (table 3 and figure 2):
SBP=130.487−12.388 (birth weight)+2.173 (birth weight)2
DBP=83.600−9.259 (birth weight)+1.570 (birth weight)2
Curve estimation of associations between birth weight and blood pressure
Curve estimation of birth weight with blood pressure.
The lowest SBP and DBP values occurred at an estimated birth weight of around 3.1 kg.
Multiple linear regression analyses
No significant associations were found between the overall range of birth weight and BP either in a simple liner regression model or in an adjusted model (all p>0.05). We then divided the birth weight into ≤3.1 and >3.1 kg categories for piecewise regression analyses. It showed a strong negative association between birth weight and BP in the birth weight ≤3.1 kg group; this association was only slightly attenuated after adjustment for age, height and waist circumference (table 4). A one SD increase in birth weight was associated with a decrease in mean SBP and DBP of 1.73 and 1.12 mm Hg, respectively. However, in the birth weight >3.1 kg group, the birth weight—BP associations became positive (coefficient: 1.07 for SBP and 0.75 for DBP) but statistically non-significant (all p>0.05) (table 4). The CRW was positively associated with BP and enhanced slightly after adjustment. A one SD increase in CRW was associated with an increase in SBP and DBP of 4.18 and 2.87 mm Hg, respectively. In the combined models, the direction and strength of the birth weight—BP associations were similar, while the associations between CRW and BP were attenuated in the birth weight ≤3.1 kg group. No significant interaction between birth weight and CRW on BP was found (all p>0.05). In addition, further regression analysis showed a significant linear association between BMI and birth weight with a 1 SD increase in birth weight associated with an increase in BMI of 0.32 m/kg2 (95% CI 0.15 to 0.50, p<0.001).
Multiple linear regression coefficients for adult blood pressure (mm Hg) per 1 SD increase in birth weight and conditional relative weight (CRW) from birth to adulthood
Discussion
We examined the association between birth weight and adult BP in a sample of Hong Kong Chinese adult women. Unlike most previous studies, we found a ‘J’ shape association rather than a linear association between the overall range of birth weight and BP. Participants with a large percentile crossing of body size from birth to adulthood were observed to have higher BP compared with the other birth weight-BMI percentile groups. A higher weight gain from birth to adulthood than expected was associated with higher BP.
The curve estimation clearly showed a significant quadratic curvilinear association between birth weight and BP, with the BP rising towards the heavier end of the birthweight spectrum. Further analysis by the piecewise linear models confirmed this ‘J’ shape association. A large study22 of 25 874 participants also found a reverse J-shape association between age-adjusted birth weight and SBP; further adjustment for BMI removed this curvilinear association in men, but it still existed in women.22 A meta-analysis of 20 Nordic studies23 found that among women, the stratum-specific regression coefficient for birth weight of less than 4 kg showed a statistically significant inverse association, while the association became positive for birth weight higher than 4 kg, irrespective of whether adjustments were made for the concurrent BMI. Our results are consistent with these findings.
The reason for the J-shape pattern is not clear. We speculate that the influencing factors to the left and right sides of the J-distribution might differ. Placental insufficiency, or inadequate maternal nutrition resulting in intrauterine growth retardation, might occur on the left side of the J-distribution, while the effect of impaired maternal glucose tolerance or gestational diabetes resulting in larger babies occurs on the right side of the curve.30 The birth weight-current weight relationship might also play a role. When later BMI determined in part by birth weight with a linear relationship, and BMI and BP are linearly related, it implicitly assumes a quadratic relation between birth weight and BP.29 On the other hand, fetal hyperinsulinaemia and fetal hyperglycaemia caused by maternal overnutrition might lead to excessive fat deposition during the third trimester.21 Increased birth weight was significantly associated with increased fat-free mass, but not fat mass.31 Thus, the associations that have been observed between high birth weight and subsequent BMI could be a result of programming by the intrauterine environment or of genetic origin. This increased adiposity in fetal life may result in later life obesity that can often lead to metabolic diseases .21 Hence, in the heavier end of birthweight distribution, the birth weight—current size—BP synergy chain may lead to the increase of adult-life BP.
Percentile stratified analysis indicated that the BP values varied with the percentile distribution of birth weight and current BMI. Participants with low birth weight but heavy current weight tended to have higher BP. We noted that a large centile crossing of body size from birth to later life may be a risk factor for elevated BP. The ‘low birth weight but heavy current weight’ means gaining more weight than usual growth. A positive association between CRW and BP observed in our study further confirmed this finding. In addition, an overall highest mean BP was observed among participants who belonged to the top 10% weight at birth and at present. This finding may imply that both the lowest and the highest birth weight have an adverse impact on later life BP, especially among the high BMI adults. Hence, maintaining optimal body weight through the life course is beneficial. In our study, the linear regression analysis corroborated the fetal origins hypothesis,26 whereby a significant inverse association between birth weight and BP was found in the ≤3.1 kg birth weight group. The lack of interaction between birth weight and CRW possibly reflects a separate effect of prenatal and postnatal growth on adult BP. The mechanism of low birth weight leading to high BP is different from that of excess weight gain on BP.32 ,33
Our study has several limitations. First, we used a cross-sectional design method to collect longitudinal data. Thus, no causal relation between exposures and outcomes could be established. Second, the self-reported measures may influence the precision of estimation. However, we suggest that it would not overturn the findings observed in our study because the validity test showed a good accuracy of self-reporting. Similar to our study, some previous longitudinal studies also collected the data by participants’ self-reporting.22 ,24 ,34 Furthermore, the similarity of mean reported birth weights from the different information sources suggested that the recalled birth weight might be reasonably acceptable. The participants’ ages ranged from 35 to 65 years, their birth years ranging from 1945 to 1975. In a previous Hong Kong study, 167 590 participants were born from 1984 to 1997,35 and the mean of birth weight in women was 3.16±0.43 kg. A study36 compared the body growth of two cohorts of Chinese infants born in Hong Kong (Cohort I: infants born in 1967; Cohort II: infants born in 1994) and found that the former cohort had a relatively lower mean birth weight (mean of birth weight: 3.03±0.35 kg vs 3.23±0.24 kg). The researchers suggested that growth faltering in early life is influenced by socioeconomic factors,36 and the more recent study had a higher average level of birth weight. Our finding of a mean birth weight similar to that reported for the 1967 cohort but lower than that for the 1984–1997 cohort suggested that our reported birth weight was reasonably acceptable.35 Moreover, since nurses are well educated with professional health-related knowledge, it is reasonable to believe that our study participants would report information with reasonably high accuracy. The third limitation is the low response rate, which may raise questions about the representativeness of the participants. Some mail surveys conducted in other countries and populations were able to achieve high response rates. We suggest that the cultural sensitivity, local policies, study topic, as well as the content, formatting and the length of the questionnaire, may lead to different responses. The apparent relevance, importance and interest of the survey to the nurses may also affect their intentions to respond. As data of the non-respondents were not available, we were not able to compare the participants’ background characteristics with those of the non-respondents. However, even though there may be a selection bias in our study, we suggest that the nature of association is unlikely to change because the sample size is adequate.
A small reduction in the population's mean BP can reduce the number of individuals at risk for hypertension.9 As birth weight reflects partly maternal nutrition and maternal circumstances, it is the most commonly used proxy for reflecting fetal growth.35 Even though low birth weight has only small effects on the overall BP levels in the general population, it still exerts substantial effects on morbidity and mortality from cardiovascular diseases in later years.37 Thus, promoting the health and nutrition of women of reproductive age is important for the prevention of cardiovascular diseases in the population. In conclusion, we found a ‘J’ shape association between birth weight and adult BP rather than the linear association reported in many previous studies. We agree with a previous study that, across the range of the inverse association between birth weight and BP, the common use of linear regression analysis may underestimate the true association. We suggest that targeting an optimal birth weight is beneficial in the promotion of cardiovascular health as it seems that both very low or high birth weights may predispose participants to higher BP in later life.
References
Footnotes
Contributors YJX and SCH contributed to the study design; YJX contributed to the data collection and results analysis; YJX and SCH contributed to the manuscript writing; Z-mL and SS-cH contributed to the manuscript review.
Funding This work was supported by the Postgraduate Student Research Grant of the Jockey Club School of Public Health and Primary Care, and the Centre of Research and Promotion of Women's Health, the Chinese University of Hong Kong.
Competing interests None.
Ethics approval The study protocol was approved by the Research Ethics Committee of the Chinese University of Hong Kong. All participants returned a signed statement of informed consent.
Provenance and peer review Not commissioned; externally peer reviewed.
Data sharing statement No additional data are available.