Article Text

Abstract
Objectives To determine the variation in charges for 10 common blood tests across California hospitals in 2011, and to analyse the hospital and market-level factors that may explain any observed variation.
Design, setting and participants We conducted a cross-sectional analysis of the degree of charge variation between hospitals for 10 common blood tests using charge data reported by all non-federal California hospitals to the California Office of Statewide Health Planning and Development in 2011.
Outcome measures Charges for 10 common blood tests at California hospitals during 2011.
Results We found that charges for blood tests varied significantly between California hospitals. For example, charges for a lipid panel ranged from US$10 to US$10 169, a thousand-fold difference. Although government hospitals and teaching hospitals were found to charge significantly less than their counterparts for many blood tests, few other hospital characteristics and no market-level predictors significantly predicted charges for blood tests. Our models explained, at most, 21% of the variation between hospitals in charges for the blood test in question.
Conclusions These findings demonstrate the seemingly arbitrary nature of the charge setting process, making it difficult for patients to act as true consumers in this era of ‘consumer-directed healthcare.’
- Internal Medicine
- Health Economics
This is an Open Access article distributed in accordance with the Creative Commons Attribution Non Commercial (CC BY-NC 4.0) license, which permits others to distribute, remix, adapt, build upon this work non-commercially, and license their derivative works on different terms, provided the original work is properly cited and the use is non-commercial. See: http://creativecommons.org/licenses/by-nc/4.0/
Statistics from Altmetric.com
Strengths and limitations of this study
-
Uses line-item charges for 10 common blood tests, which should have no variability by patient characteristics or clinical presentation, to isolate institutional differences in charges.
-
Links reported charge data to hospital and market characteristics, allowing for analysis of the predictive power of different institutional factors on between-hospital charge variation.
-
Limitations include using self-reported charge data from hospitals, lack of generalisability beyond California, potential selection bias and inability to conduct the same analysis on prices paid rather than charges.
Background
In our notoriously opaque healthcare system, pricing information in healthcare is rarely available to patients in advance of their care.1 Numerous legal and institutional barriers, such as contractual gag clauses by insurers, and limited availability of reported charges in a consumer-friendly format, have limited patient access to the true costs of their care.2 As former Secretary of Health and Human Services, Mike Leavitt, said, “Americans know the price of almost everything they pay for, except for one of the most important things they pay for—their healthcare.”3
As patients have little control over their clinical presentation, one of the primary ways to control their healthcare costs is in the choice of provider. The research has shown large between-hospital variations in broad price indices,4 ,5 as well as charges for the average inpatient stay6 and charges for common surgical procedures,7 indicating possible room for consumer discrimination. However, no studies, to our knowledge, have examined variation in charges for line-item outpatient procedures, such as blood tests, which are theoretically identical across providers. These procedures should have no variability by patient characteristics or clinical presentation, and thus provide an ideal element on which to evaluate the true between-hospital variation in charges and the possible explanations for that variation.
We sought to determine the across-hospital variation in charges for 10 common blood tests performed at California hospitals in 2011, as well as the hospital and market-level factors that could explain such variation. Using these common, simple and standard tests as a vehicle, institutional differences in charges could be isolated by eliminating possible patient-specific variation. Further, as a common element of almost any hospital visit, these blood tests provide a relevant and meaningful example of the variation patients may face in the bills from their healthcare use.
Methods
Study design and data sources
We conducted a cross-sectional study of hospital charges for 10 common outpatient blood tests performed at California hospitals in 2011. Since 2006, all non-federal hospitals in California have been required by law to annually submit their average charges for 25 common outpatient procedures to the California Office of Statewide Health Planning and Development (OSHPD).8 While the choice of which 25 procedures to report are at the discretion of each hospital, OSHPD provides a sample list of common procedures to aid in the reporting process. That suggested form includes 10 common blood tests; basic metabolic panel, complete blood cell count with differential white cell count, comprehensive metabolic panel, lipid panel, complete blood cell count (automated), thyroid-stimulating hormone assay, creatine kinase assay, troponin assay, prothrombin time and thromboplastin time (partial). By 2007, over 85% of hospitals used this form. Thus, we selected these 10 commonly reported blood tests for our analysis. The 10 blood tests, their current procedural terminology (CPT) codes, and their frequency of reporting by hospitals in our sample are reported in online supplementary table S1.
Hospital characteristics were captured by linking OSHPD's hospital utilisation files for 2011 with the charge data using each hospital's OSHPD ID. We also used the 2009 Area Health Resources File,9 the most currently available year, to obtain county-level area percent of uninsurance and poverty, and the 2011 Impact Files from the Centers for Medicare and Medicaid Services (CMS),10 to obtain hospital wage and case-mix indices.
Our study was exempted from review by the Committee on Human Research at the University of California, San Francisco, as it did not involve any human subjects.
Sample selection
We only analysed charges from general acute care, medical/surgical hospitals. We also excluded any hospitals from the individual test analyses that did not report charges for that specific blood test to OSHPD as one of their 25 common outpatient procedures. Of the 307 hospitals reporting charges to OSHPD, between 166 and 189 hospitals reported charges for each individual blood test.
Outcome
Our outcome of interest was the average charge at each hospital for the blood test of interest, which represents the total dollar amount billed by the hospital to the patient or to their insurance provider. The charges reflect the hospital’s full rates before pre-payments or contractual adjustments.
Covariates
To determine which characteristics explain the observed variation in charges for common blood tests, we examined hospital and market-level factors that have been shown to have relationships with broad hospital-price indices in the previous literature.4 ,11 ,12 Hospital-level factors included ownership (not-for-profit, for-profit, government), urban/rural location, teaching status, patient payer mix (proportion Medicare, Medicaid), capacity (number of licensed beds), case-mix index and wage index. Market-level factors included percent uninsured in the county, percent below the poverty line in the county as well as the system-wide Herfindahl-Hirschman Index (HHI).
The HHI is defined as the sum of the squares of the market shares, and is a widely used economic measure of market concentration. HHI can range from 0 to 10 000 (using whole percentages). A monopoly market has an HHI of 10 000 and a market that has a large number of firms has HHI that approaches 0. We calculated a hospital's share of patients in its market directly from the OSHPD hospital utilisation data. Our HHI calculation accounts for membership in a hospital system, which has been shown to influence hospital charges.4 To parameterise HHI in our regression, we divided it into terciles.
Statistical analyses
We first conducted a descriptive analysis of average charges for each blood test, including minima and maxima, 5th and 95th percentile of charges, IQR and coefficient of variation, to examine the variation across California hospitals. The coefficient of variation is determined by dividing the SD of a distribution by the mean to create a normalised measure of variation that can be used to compare groups with different means.
We then used a linear regression model to determine if hospital or market-level characteristics described above influenced hospital charges for these common blood tests. We also determined the R2 value for each model, which expresses how much of the variation in charges is explained by the hospital and market characteristics.
Results
We analysed charges for between 166 and 189 hospitals, depending on the blood test, as not all blood tests were included in each hospital's 25 reported outpatient procedures (table 1). The majority of hospitals were not-for-profit, urban, non-teaching hospitals. Their patient populations were on average 25% Medicaid and 41% Medicare, and they averaged 269 beds. Most markets had medium levels of competition (HHI: 1500–2500). Hospitals’ counties averaged 19% uninsurance rates and 13% of the population living below the federal poverty line.
Hospital and market characteristics in study sample
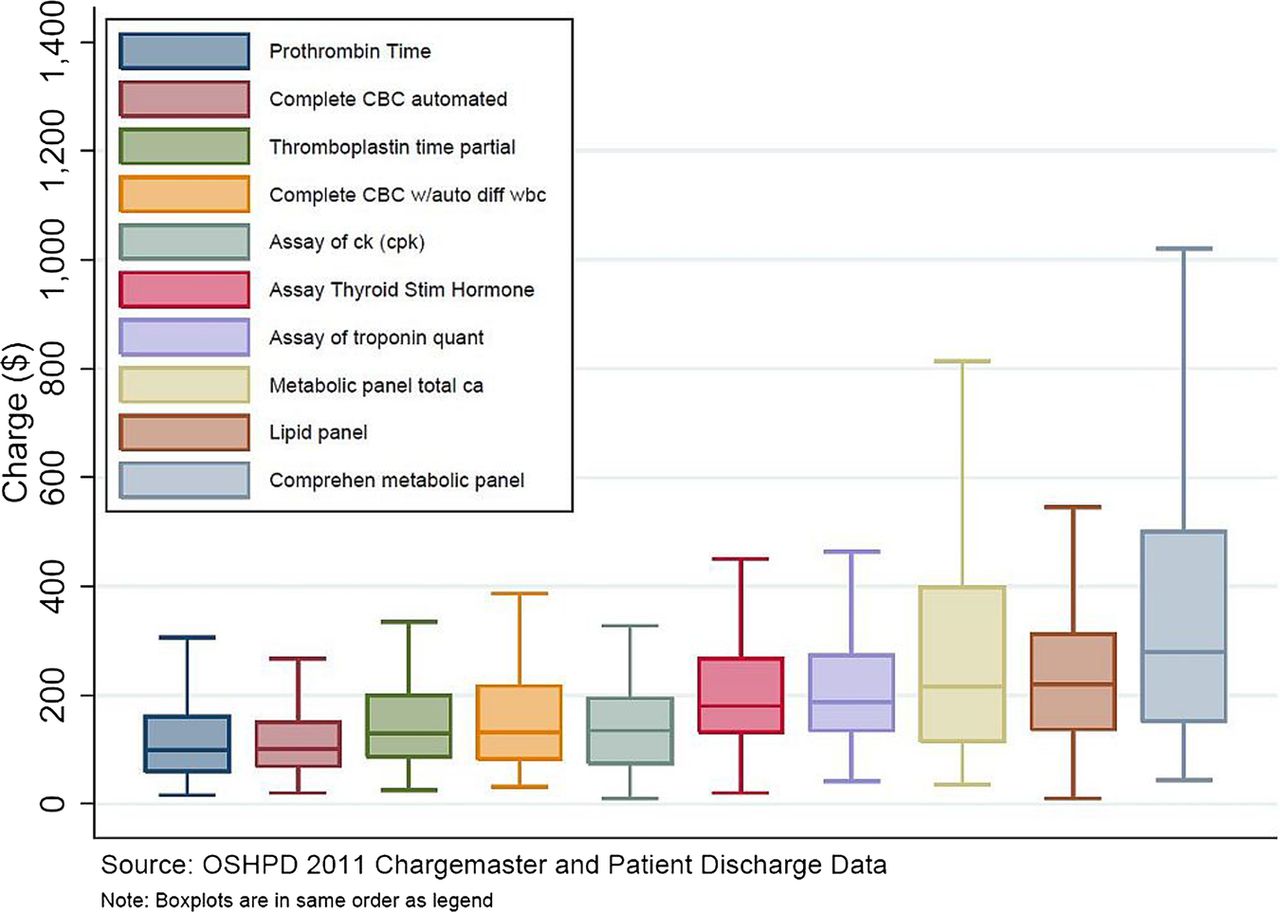
We found significant variation in charges for 10 common outpatient blood tests performed at California hospitals (figure 1: tabular results in additional file 1). For example, hospitals charged a median of US$214 for a basic metabolic panel, but the charges ranged from US$35 to US$7303. A lipid panel generated a median charge of US$220 at California hospitals, but the maximum charge of US$10 169 was over a thousand times the minimum charge of US$10.
Variation in charges for 10 common blood tests in California (CBC, complete blood cell count; ck, creatine kinase; WCC, white cell count). Central lines represent median charges, boxes represent the IQR of charges, and whiskers show the 5th and 95th centile of charges for each of the 10 common blood tests.
To exclude extreme cases, we further examined variation in charges from the 5th to 95th percentile, finding that a comprehensive metabolic panel had the largest range at US$869 (US$79–US$948), and charges for an automated complete blood count had the smallest range at US$241 (US$37–US$278). When examining IQR, a more conservative measure of variation, we found that IQRs varied from US$83 for an automated complete blood count to US$354 for a comprehensive metabolic panel.
Finally, the coefficient of variation for each blood test ranged from 67% for assays of creatine kinase to 422% for prothrombin time. Eight of the 10 blood test charges had coefficients of variation greater than 200%.
We found that multiple hospital-level factors were associated with individual blood test charges (table 2). For 7 of the 10 blood tests, receiving the test at a teaching hospital was associated with a significantly lower charge. For instance, the charge for a troponin assay at a teaching hospital was 65% lower than at a non-teaching hospital (95% CI −25% to −104%). Five of 10 blood tests had lower charges at government hospitals than non-profits, while 2 of 10 tests had significantly higher charges at for-profit hospitals than non-profits. For lipid panels, each percentage increase in the share of Medicaid patients was associated with a 0.95% increase (95% CI 0.09% to 1.80%), meaning that if a hospital had a 10% higher share of Medicaid patients in their payer mix, the charges in that hospital for the lipid panel would be 9.5% higher. However, for each blood test, only two or fewer hospital characteristics and no market predictors showed any significant association with charges. At most, our models predicted 21% of the variation in charges between hospitals.
Regression of hospital charges on hospital and market characteristics for 10 common blood tests performed in California hospitals
Discussion
Our findings demonstrate the wide variability in charges for 10 common blood tests performed at California hospitals in 2011, as well as the hospital-level factors that explain some of that variation. We found that a patient could be charged as little as US$10 or as much as US$10 169 for a lipid panel, depending only on which hospital they visited. Eight of the 10 blood tests had coefficients of variation greater than 200%. For comparison, prices for consumer electronic goods have an average coefficient of variation of 12.5%.13
The between-hospital variation we observed in some of these blood tests was partially explained by a few hospital-level factors including ownership, teaching status and in the case of lipid panels, the proportion of a hospital's patients covered by Medicaid. However, it is notable how few characteristics were significant predictors of the charges patients faced. For instance, our results indicate that a hospital's case mix and labour costs (wage index) do not affect charges for these common procedures. Market level characteristics, including competitiveness of the hospital market, percent uninsured in the hospital's county and county poverty rate, also showed no significant effects on charges for any of the 10 blood tests. The significant variation left unexplained in our models could be due to our inability to capture all relevant factors that could affect charge setting for these tests, or to pure noise.
Though we attempted to investigate a range of hospital and market characteristics from previous literature on charge variation in aggregate inpatient indices and surgical procedures,4 ,7 ,11 ,14 there are numerous factors that could explain hospital variation in charges for blood tests that we were unable to include in our regression. For example, many hospitals may choose to invest in higher quality facilities, supplementary services and social services than others. The costs of these differences, while of value to patients, are not easy to measure and may not be captured by variables in our regression, such as wage index. However, they likely do trickle down into charges for all basic services, including blood tests. Additional neighbourhood factors in the hospital's catchment area such as education, home prices, age distribution and race/ethnicity breakdown may influence charges, but were not included in our regression due to absence from previous literature on potential explanatory factors in charge setting,4 ,7 ,11 ,14 on which we based our decisions of which variables to include. Thus, it is possible that some portion of the variation left unexplained by our model could be explained by additional characteristics of the hospital or market not included in our regression.
However, given past literature suggesting that system-wide factors incentivise nearly random charge setting, we believe that the majority of the variation in blood test charges between hospitals that remains unexplained by our model is not based on cost or observable market characteristics. For instance, previous literature shows that prospective payments from purchasers are often set independently of costs or value, eliminating the typical free-market constraints by which variation in charge and price would be limited.15 Rather, as payments by private insurers are often negotiated based on charges, hospitals use proprietary formulas to raise their charges in order to secure sufficient funding from third party payers to cover overall costs.16–18 This often results in some services subsidising others, with their increased charges generally unrelated to their value.15 Furthermore, baseline charges are often set using historical prices calculated before the costs of a service could be calculated accurately.18 As a result, charges do not reflect costs for individual services, and significant variation in distribution of charges for those services ensues as different hospitals choose to set their chargemasters using unique formulas and strategies. The variation we find in charges for common blood tests, therefore, demonstrates that even for essentially identical line-item procedures, there appears to be no clear or predictable method for setting charges.
Limitations
This study evaluated the charges for blood tests, rather than the negotiated prices paid by most insurers. Although charges have evoked significant controversy in the popular press,19 ,20 they are currently billed directly to the 48.6 million uninsured21 as well as privately insured patients seeking care out of network. In addition, charges still have a major impact on healthcare pricing for all Americans. They often serve as the starting point in fees for service reimbursement negotiations with many third party payers,15 ,22 as a baseline in cost-to-charge ratio analysis for Diagnosis-related group weighing and outlier payment reimbursement by Medicare,23–25 and as the benchmark that most hospitals use to calculate uncompensated care, which affects their tax-exempt non-profit status.26 Further, as most direct price information is unavailable to the public, charges represent one avenue to evaluate the institutional influences on healthcare price beyond a patient's control. Therefore, we believe charges are worth studying and provide insight on the price variation and opacity seen in healthcare.
Second, a number of hospitals did not report charges for each blood test to OSHPD. As there are no incentives or penalties surrounding the charges reported to OSHPD, we have no reason to believe that the charges differed significantly between reporting and non-reporting hospitals. However, there is the possibility of bias if the charges systematically differed between reporters and non-reporters, which could affect our regression results.
In addition, the analysis only applies to California, which is a large and diverse state but does not represent the entire US population. Therefore, the results of this study cannot be generalised to the national level, but can provide a good case study of charge variation.
Finally, the charge data is self-reported to OSHPD by California hospitals. Therefore, the data is only as accurate as the hospitals reporting. However, we suspect any error rates are low given that chargemasters are public records, and any misreporting would probably understate the charges and likely decrease the variation we documented.
Conclusions
Charges for 10 common blood tests performed at California hospitals vary widely across hospitals, with charges for a lipid panel, for example, ranging from US$10 to US$10 169. Though hospital ownership and teaching status were correlated with charges for many blood tests, few other hospital or market-level predictors significantly predicted blood test charges. At most our models predicted 21% of the variation in charges for these identical services. These findings highlight the lack of predictability facing Americans paying full charges for healthcare, limiting their ability to act as rational consumers.
Acknowledgments
The authors thank Joy Lin, BS, for her technical assistance.
Supplementary materials
Supplementary Data
This web only file has been produced by the BMJ Publishing Group from an electronic file supplied by the author(s) and has not been edited for content.
Files in this Data Supplement:
- Data supplement 1 - Online supplement
Footnotes
-
Contributors RYH conceived, designed, supervised and also funded the study, and interpreted the data analysis. RYH and YAA revised the manuscript for intellectually important content and approved the final manuscript. YAA designed the study and ran the data analysis. JPN assisted with the data analysis, interpreted the data, wrote the first draft of the manuscript, revised and approved the final version of the manuscript.
-
Funding UCSF Center for Healthcare Value.
-
Competing interests This work was supported by the National Center for Advancing Translational Sciences, National Institutes of Health, through UCSF-CTSI Grant Number KL2 TR000143 (RYH), the Robert Wood Johnson Foundation Physician Faculty Scholars Program (RYH), and a UCSF Center for Healthcare Value grant.
-
Provenance and peer review Not commissioned; externally peer reviewed.
-
Data sharing statement The data used in this study are publicly available through the California Office of Statewide Health Planning and Development (OSHPD). To request the data, call (916) 326-3802 or e-mail hircweb@oshpd.ca.gov.
Linked Articles
- Correction