Article Text

Abstract
Objective To evaluate whether accredited hospitals maintain quality and patient safety standards over the accreditation cycle by testing a life cycle explanation of accreditation on quality measures. Four distinct phases of the accreditation life cycle were defined based on the Joint Commission International process. Predictions concerning the time series trend of compliance during each phase were specified and tested.
Design Interrupted time series (ITS) regression analysis of 23 quality and accreditation compliance measures.
Setting A 150-bed multispecialty hospital in Abu Dhabi, UAE.
Participants Each month (over 48 months) a simple random sample of 24% of patient records was audited, resulting in 276 000 observations collected from 12 000 patient records, drawn from a population of 50 000.
Intervention(s) The impact of hospital accreditation on the 23 quality measures was observed for 48 months, 1 year preaccreditation (2009) and 3-year postaccreditation (2010–2012).
Main outcome measure(s) The Life Cycle Model was evaluated by aggregating the data for 23 quality measures to produce a composite score (YC) and fitting an ITS regression equation to the unweighted monthly mean of the series.
Results The four phases of the life cycle are as follows: the initiation phase, the presurvey phase, the postaccreditation slump phase and the stagnation phase. The Life Cycle Model explains 87% of the variation in quality compliance measures (R2=0.87). The ITS model not only contains three significant variables (β1, β2 and β3) (p≤0.001), but also the size of the coefficients indicates that the effects of these variables are substantial (β1=2.19, β2=−3.95 (95% CI −6.39 to −1.51) and β3=−2.16 (95% CI −2.52 to −1.80).
Conclusions Although there was a reduction in compliance immediately after the accreditation survey, the lack of subsequent fading in quality performance should be a reassurance to researchers, managers, clinicians and accreditors.
- AUDIT
- HEALTH SERVICES ADMINISTRATION & MANAGEMENT
This is an Open Access article distributed in accordance with the Creative Commons Attribution Non Commercial (CC BY-NC 4.0) license, which permits others to distribute, remix, adapt, build upon this work non-commercially, and license their derivative works on different terms, provided the original work is properly cited and the use is non-commercial. See: http://creativecommons.org/licenses/by-nc/4.0/
Statistics from Altmetric.com
Strengths and limitations of this study
-
The study uses interrupted time series analysis as an alternative to the randomised control trial, which is recognised as the gold standard by which effectiveness is measured in clinical disciplines.
-
This is the first interrupted time series analysis of hospital accreditation.
-
This is also the first study on hospital accreditation in the UAE.
-
This is the first study to develop and test the Life Cycle Model on hospital accreditation.
-
The study is limited to one hospital; more studies are needed to test the validity of this life cycle framework in different national and cultural settings.
-
The selection and validity of the quality measures were dependent on the accuracy of documentation in the patient record.
Introduction
Hospital accreditation is frequently selected by healthcare leaders as a method to improve quality and is an integral part of healthcare systems in more than 70 countries.1 The growth of hospital accreditation can be attributed in part to the growing public awareness of medical errors and patient safety gaps in healthcare.2 Highlighting the costs of accreditation, Øvretveit and Gustafson3 state that evaluations should be used effectively because they consume time and money that can be utilised in other activities of organisations. As cost containment continues to be a concern in many hospitals, organisations need to evaluate the value of accreditation as a long-term investment.4 However, the literature shows mixed and inconsistent results over the impact and effectiveness of hospital accreditation.5–10 Studies using a perceived benefits approach have argued that hospital accreditation sustains improvements in quality and organisational performance.11–14 Although accreditation is a framework for achieving and sustaining quality, empirical studies that evaluate whether accredited organisations sustain compliance with quality and patient safety standards over the accreditation cycle are lacking. Most studies have used cross-sectional designs and/or comparative static analysis of data at two points in time.8 ,13 ,15 ,16 To draw causal inferences about the direct influence of accreditation on patients’ health outcomes and clinical quality, a dynamic analysis that focuses on the effects of accreditation over time is needed.3 This research directly addresses this issue by adopting a time series framework. In addition, this is the first study to answer the important question of whether accredited organisations maintain quality and patient safety standards over the accreditation cycle by developing and testing a life cycle explanation.
The accreditation life cycle defines the complex stages and dynamics of accreditation as a quality intervention. We shall test the validity of the Life Cycle Model against monthly data, for a series of quality measures recorded by a single hospital over 4 years (between January 2009 and December 2012). This period incorporates an accreditation survey in December 2009.
Joint Commission International (JCI) has published an accreditation preparation strategy that suggests most hospitals will pass through various phases during the process of accreditation.17 Based on the JCI process, we hypothesise four distinct phases of the accreditation cycle and derive predictions concerning the time series trend of compliance during each phase. The predictions are the building blocks of the life cycle framework. We then test the validity of the Life Cycle Model by calibrating interrupted time series regression equations for 23 key quality compliance measures.
The life cycle of accreditation
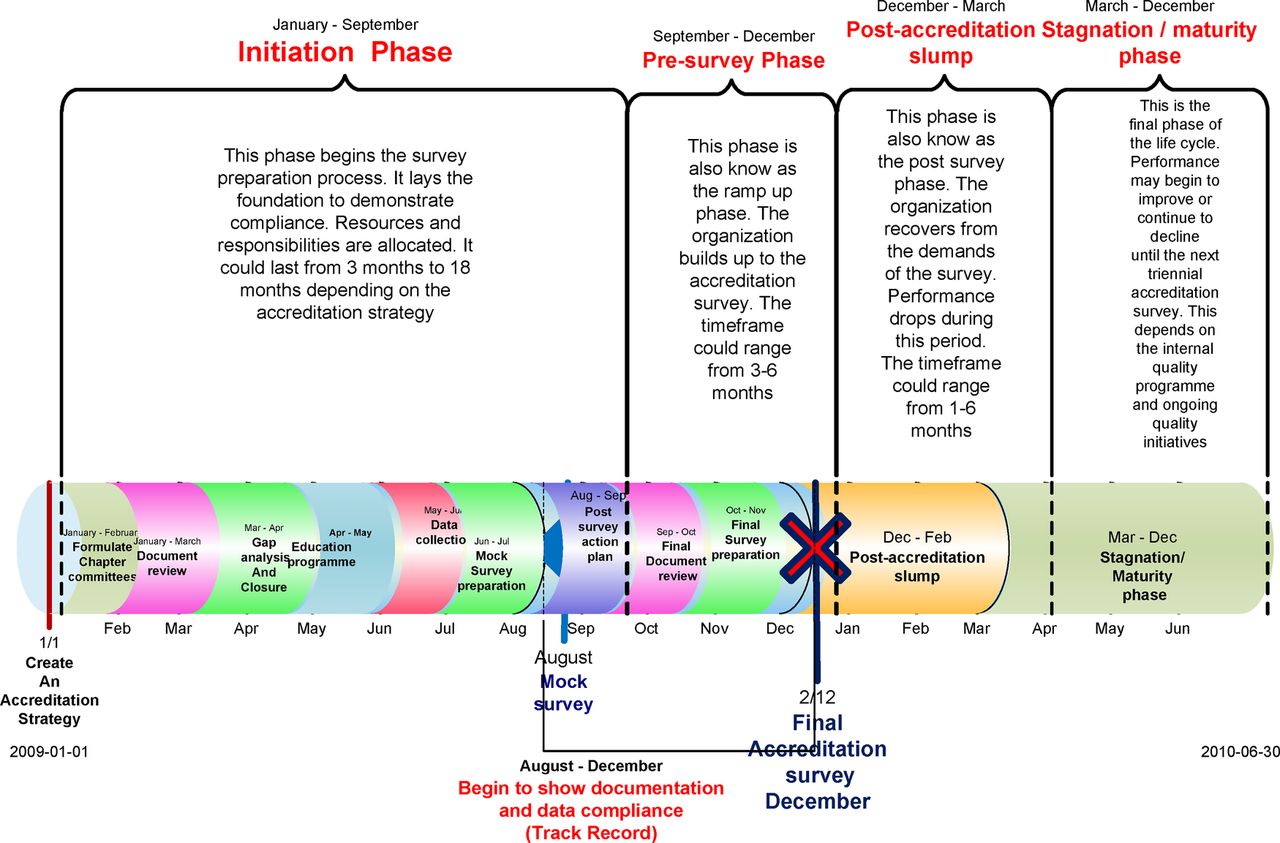
The initiation phase
This involves laying the foundation for achieving compliance with the JCI quality standards. We describe two subphases: adoption and revitalisation (figure 1). The adoption subphase is characterised by the implementation of new standards. JCI recommends developing an internal structure, composed of teams and leaders, to facilitate coordination of all the activities needed to prepare for accreditation.17 A steering committee of team leaders coordinates the preparation. As JCI requires a number of mandatory policies and procedures, a document review is initiated. The revitalisation subphase is characterised by further improvement in compliance stimulated by a gap analysis. JCI recommends that a Baseline Assessment/Gap analysis is carried out in order to compare current processes and compliance with the expectations of the standards.17 This identifies the actions necessary to eliminate the gaps between an organisation's current performance and that necessary to achieve accreditation. Additionally, the collection and analysis of baseline quality data are initiated and compared with the requirements of the quality monitoring standards.17 The process includes: (1) analysing compliance with the JCI standards; (2) developing an action plan to address deficiencies; (3) implementation of new processes and data collection targeting compliance to standards; (4) conducting an organisation-wide training programme and (5) allocation of required resources. We predict that the initiation phase as a whole will be characterised by a gradual improvement in the degree of compliance to standards, that is, a positive change in slope. Since it is also a period of change, sporadic improvements in performance may be expected as organisations pilot documents and alter practices.

The accreditation life cycle: phases and timeline.
The presurvey phase
The presurvey phase occurs within 3–6 months of the accreditation survey (figure 1). It follows a mock survey, recommended by JCI, where the findings lead to a review of existing gaps and the staff work on closing these within the short time frame.17 A marked improvement (ramp up) in compliance is expected to occur during the presurvey phase because the staff are aware of the proximity of the survey and because the organisation invests resources in preparation. Furthermore, JCI accreditation requires submission of a 4-month record of compliance measures prior to the accreditation survey, thus providing a further stimulus to improvement. It is hypothesised, therefore, that the peak level of compliance performance will occur during this phase.
The postaccreditation slump
The quality performance of most hospitals tends to fall back towards preaccreditation levels immediately on receiving accredited status (figure 1). The staff no longer feel the pressure to perform optimally and may focus on activities that were neglected or shelved during the presurvey phase. This phase may be prolonged if there is a lack of leadership, no incentive to improve, competing demands, organisational changes or lack of continuous monitoring of performance. The loss of the quality manager, who is responsible for maintaining quality by measures such as periodic self-audit and continuous education, is potentially serious. If the goal was survey compliance rather than quality improvement, standards may not be embedded in practice and performance will not be sustained. We hypothesise that a sharp drop in levels of compliance will occur immediately following the accreditation survey followed by a negative change in slope over time.
The stagnation/maturation phase
This phase follows the postaccreditation slump and occurs a few months after the accreditation survey. Since the hospital is in compliance with the JCI standards, as validated by the survey, there are no new initiatives to drive further improvements, which are predicted to lead to stagnation in compliance performance. If there is no ongoing performance management system, a decline may set in which may last until the next initiation phase in preparation for reaccreditation. Generally, the accreditation process includes a periodic (snapshot), as opposed to continuous assessment, which leads to a more reactive rather than forward-looking focus and can be a factor in persistent quality deficiencies.18 During this stagnation phase, we hypothesise that there will be an undulating plateau of compliance characterised by sporadic changes but at an overall level above the preaccreditation values.
Methods
Study population
The study was conducted in the private 150-bed, multispecialty, acute-care hospital in Abu Dhabi, UAE. The annual inpatient census is approximately 15 000. The hospital treats approximately half a million ambulatory care patients per year. The scope of healthcare services is provided to all patient age groups, nationalities and payment types.
Data
To test the Life Cycle Model, a total of 23 quality measures were recorded each month at the hospital over a 4-year period, including a JCI accreditation survey (table 1). The quality measures were selected by a panel of experts consisting of clinical auditors, doctors, quality and patient safety leaders based on: (1) interpretability, enabling clear conclusions to be drawn on the level of compliance with JCI standards and thus accreditation impact; (2) consistency in terms of high values indicating better quality; (3) direct correlation with a specific JCI standard and relation to an important dimension of quality and (4) applicability, as all measures should apply to all patients in the hospital irrespective of disease condition or specialty. These measures were observed for 48 months, 1 year prior to accreditation (2009) to capture the preparation period, and for 3-year postaccreditation (2010, 2011 and 2012) to capture the 3-year accreditation cycle. The monthly time interval was based on the most disaggregated level of the data collection and the organisation's reporting frequency for the quality measures. The principal data source for the measures was a random sample of 12 000 patient records drawn from a population of 50 000 during the study period (January 2009 to December 2012). Slovin's formula was used to calculate the sample size per month based on a 95% CI from an average monthly inpatient census of 1500 patients. Each month during the entire study period, a simple random sample of 24% of patient records was selected from the population of discharged patients and manually audited by physicians. The auditors were unaware of the objectives of the study. The data were abstracted from the patient record 1 month postdischarge, resulting in a total of 276 000 observations. Quality measures that displayed an inverse relationship to percentage measures were transformed, for example, ‘percentage of surgical site infections’ was converted to the ‘percentage of infection-free surgeries’, thus equating higher values to good quality while, conversely, high rates of, for example, surgical site infection indicate poor quality. The sources and methods of data collection were the same before and after the intervention, thus eliminating any detection bias. The measures reflect important dimensions of quality, including patient assessment, surgical procedures, anaesthesia and sedation use, medication errors, infection control and patient safety. Furthermore, the measures represent 10 (71.4%) of the 14 chapters in the JCI 3rd Edition Standards manual. Since the 10 chapters have a direct impact on clinical quality, the measures signify survey tracer indicators of standards compliance (table 1).
Quality measure descriptions for the Al Noor Hospital time series analysis
Research design
Measuring the effects of policy interventions is difficult since there is no unexposed control group available as policies are normally targeted towards the whole population simultaneously. Interrupted time series analysis is a statistical method for analysing temporally ordered measurements to determine if an intervention (eg, accreditation), or even an experimental manipulation, has produced a significant change in the measurements.19–21 Linear segmented regression analysis is a partly controlled design where the trend before the accreditation intervention is used as a control period. The superiority of this method over a simple before-and-after study is due to the repeated monthly measures of variables while controlling for seasonality, secular trends and changes in the environment.22 Interrupted time series analysis distinguishes the effects of time from those of intervention and is the most powerful, quasi-experimental design to evaluate longitudinal effects of time-limited interventions. The interruption splits the time series into preintervention and postintervention (accreditation) segments so that segmented regression analysis of interrupted time series data permits the researcher to statistically evaluate the impact of accreditation on the 23 quality measures, both immediately and in the long term, and the extent to which factors other than accreditation explain the change.
The set of observations of hospital performance making up the time-series data is conceptualised as the realisation of a process. Each segment of the time series exhibits a level and a trend. A change in level, for example, an increase or decrease in a quality measure after accreditation, constitutes an abrupt intervention effect. Conversely, the change in trend of a variable is an increase or decrease in the slope of the segment after accreditation compared with the segment preceding the accreditation. Shifts in level (intercept) or slope, with p<0.01, were defined as statistically significant. Segmented regression models fit a least squares regression line to each segment of the independent variable, time and thus assume a linear relationship between time and the outcome within each segment.21
The following linear regression equation is specified to estimate the level and trend in the dependent variable before accreditation and the changes in the level and trend after accreditation: 1where Yt is the outcome, for example, the mean number of physicians complying with site marking per month; timet indicates time in months at timet from the start of the observation period to the last time point in the series; intervention is a measure for timet designated as a dummy variable taking the values 0 before the intervention and 1 after the intervention, which was implemented at month 12 in the series. Time after intervention is a continuous variable recording the number of months after the intervention at timet, coded 0 before the intervention (accreditation) and (time −36) after the intervention. In this model β0 is the baseline level of the outcome at the beginning of the series; β1 the slope prior to accreditation, that is, the baseline trend; β2 the change in level immediately after accreditation; β3 the change in the slope from preaccreditation to postaccreditation and represents the monthly mean of the outcome variable; and et the random error term.
If using equation 1 to estimate level and trend changes associated with an intervention, such as accreditation, we control for the baseline level and trend, a major strength of segmented regression analysis.
Statistical analysis
First, a plot of the observations against time was constructed in order to reveal important features of the data such as trend, seasonality, outliers, turning points and/or sudden discontinuities, which are vital in analysing the data and calibrating a model. Second, segmented regression models were fitted using the ordinary least squares regression analysis. The results of segmented regression modelling were reported as level and trend changes. Third, the Durbin-Watson statistic was used to test for the presence of autocorrelation. Two distinct types of autocorrelation are identified: (1) autoregressive process and (2) moving average process. If the statistic was significant, the model was adjusted by estimating the autocorrelation parameter and including it in the segmented regression model. If no autocorrelation is present, then the intervention model was deemed appropriate for the analysis. Fourth, the Dickey-Fuller statistic was used to test for stationarity and seasonality. If the series displayed seasonality or some other non-stationary pattern, the solution was to take the difference of the series from one period to the next and then analyse this differenced series. Sometimes, a series may need to be differenced more than once or at lags greater than one period. Since seasonality induces autoregressive and moving average processes, the detection and inclusion of a seasonal component was implemented in the time series analysis methods using ARIMA, ARMA and dynamic regression. Fifth, the impact of external or internal events was reviewed. When assessing the impact of an intervention on a time series, it is imperative that any observed changes in a series can be attributed to the effect of that intervention only and not to other interventions or events which have had an effect on the series at the same time. There were no major organisational changes in the hospital structure or management during the period of study. Furthermore, there was no monitoring by JCI during the 3 years after the first survey including self-reporting of quality measures or additional organisation-wide site visits. Therefore, the data were not influenced by secular changes and only impacted by the intervention during the study period. Finally, goodness-of-fit tests were undertaken using F-statistics to test for significance of the overall model. Parameter estimation was computed to identify significant individual regressors in the model. Analysis was conducted using EViews 7 and SAS V.9.3. Next, in order to test whether the accreditation process exhibits the life cycle effect, the following statistical predictions were specified for the 23 measures, which are consistent with the hypotheses previously formulated concerning levels of compliance during the four phases of the Life Cycle Model:
-
The Initiation Phase is the baseline level of the outcome at the beginning of the series.
-
The measures should exhibit a positive change in slope in the preaccreditation period, the baseline trend. The peak level of compliance should occur during the 3 months prior to the accreditation survey (the Pre-Survey Phase).
-
The measures should record a negative change in level post the accreditation survey (the Post-Accreditation Slump).
-
The measures should exhibit a negative change of slope post the accreditation survey (The Stagnation Phase).
The ultimate confirmatory test of the proposed Life Cycle model is to aggregate the data for all 23 quality compliance measures to produce a composite score (YC) and to fit an interrupted time series regression equation to the unweighted mean monthly value of the series.
Results
Table 2 outlines the interrupted time series equations for the 23 quality compliance measures, together with the diagnostic test results for autocorrelation and seasonality/stationarity. First, in the case of 19 of the 23 measures, the β1 coefficient (the slope prior to accreditation) is positive, as hypothesised, and in 10 measures the coefficient is significant. Second, for 14 of the 23 equations, the β2 coefficient (the change in level following accreditation) is negative, as postulated, and for seven measures the parameter is significant (table 2). Third, for 20 of the 23 time series models, the β3 coefficient (the slope postaccreditation) is negative, as predicted, and 11 of the coefficients are significant. Several of the interrupted time series equations, as indicated in table 2, display autocorrelation, in which cases the autoregressive (AR) or moving average (MA) variable was included to correct for it, while Y10 and Y20 displayed seasonality and were adjusted for non-stationarity using differencing.
Interrupted time series models for the 23 quality measures
The results of the confirmatory test, using a composite score (YC) of the 23 quality measures, provide proof of the Life Cycle Model (figure 2). The slope prior to accreditation (β1) is positive and highly significant, as hypothesised. The change in level following the accreditation survey (β2) signals a significant decline in compliance, as predicted; and, as postulated, the postaccreditation slope (β3) is also negative and statistically significant (table 3). Furthermore, the R2 indicates that over 87% of the variation in quality compliance outcomes is explained by the three variables in the Life Cycle Model (table 3). The best fit interrupted time series model not only contains three significant variables, but also the size of the coefficients indicates that the effects of these variables are substantial. The preintervention slope (β1) implies an increase in compliance by 2.19 percentage points per month prior to the accreditation survey. This Initiation Phase is characterised by a period of steep increases in compliance followed by sporadic declines. The β2 coefficient suggests that the mean level of compliance for the 23 quality measures decreased by 3.95 percentage points immediately following the accreditation survey. The β3 coefficient indicates a decrease in compliance of 2.16 percentage points per month postaccreditation. The postaccreditation slump is followed by a long period of stagnation characterised by an undulating plateau of compliance but, importantly, at a level of 20 percentage points higher than the preaccreditation survey levels (figure 2).
Interrupted Time Series for Composite Quality Measures (YC)

Phases of the accreditation life cycle: empirical evidence.
Discussion
While there are many questions about the benefits of hospital accreditation, empirical evidence to support its effectiveness is still lacking. According to Greenfield and Braithwaite,1 this creates a serious legitimacy problem for policymakers and hospital managements. Is achieving and maintaining accreditation worth the time, effort and cost if there is uncertainty about whether it results in quantifiable improvements in healthcare delivery and outcomes23? Shaw5 has argued that many countries are embarking on accreditation programmes without any evidence that they are the best use of resources for improving quality. While proof of the value of accreditation is so far indeterminate, there is also no conclusive evidence that no benefits arise or that resources are being wasted.9 The literature prompts a rethink of how accreditation contributes to clinical and organisational performance.24 Therefore, without an empirically grounded evidence base for accreditation, the debate about the effects of accreditation—positive and negative—will remain anecdotal, influenced by political ideology and driven by such biases.25
This is the first study of accreditation to use interrupted time series analysis. Furthermore, this paper has outlined a new conceptual framework of hospital accreditation—the Life Cycle Model—and presented statistical evidence to support it. This is also the first study to use interrupted time series regression analysis over a 4-year period to test for the impact of accreditation on quality compliance measures in healthcare.
The study results have answered the key question: do hospitals maintain quality and patient safety standards over the accreditation cycle? The results demonstrate that, although performance falls after the accreditation survey, the tangible impact of accreditation should be appreciated for its capacity to sustain improvements over the accreditation cycle. This phenomenon is supported by other researchers who state that those institutions which invest in the accreditation surveys reap the most benefits from accreditors’ diagnosis, sharing of leading practices and the ensuing changes.26 ,27 Organisational efforts (eg, creating a functional committee structure) to meet the accreditation programme’ requirements could orchestrate the circumstances for prolonged improvements in hospitals.28 At a microlevel, the findings of this research demonstrate that a private hospital can use accreditation to improve quality. At a macrolevel, regulatory bodies can ascertain that investment in accreditation is appropriate as a quality improvement strategy. Acceptance of the accreditation life cycle framework offers a blueprint for improving strategy on quality of healthcare. A major benefit of the concept is that stagnation and declining outcomes can be avoided by monitoring the life cycle and taking proactive initiatives at appropriate times in order to sustain performance. The Life Cycle Model also justifies the need for a continuous survey readiness programme throughout the organisation.
Continuous readiness has been described as being ‘ready for the next patient, not just the next survey’.29 Continuous survey readiness strategies may create a heightened awareness of the level of compliance and standards. The literature supports regular self-assessments, intracycle mock surveys and benchmarking of quality measures to a data library30 ,31 for sustaining quality improvement, which may also be used to mitigate the stagnation phase. A paradigm shift, from the scheduled accreditation survey to an unannounced survey, is recommended to prompt a change from a survey preparation mindset to that of continual readiness. A triennial snapshot is no substitute for ongoing monitoring and continual improvement. Continuous survey readiness may ameliorate the life cycle effect of accreditation provided the organisation is required to implement such a resource intensive programme by the accreditation body. Although this study is conceived of as being novel for its unique evaluation methodology and the Life Cycle Model, the following limitations should be recognised. First, the study evaluates accreditation in a single hospital. Second, the accuracy of measures is dependent on the quality of documentation in the patient record. Third, the choice of quality measures was also defined by the availability of evidence in patient records; thus, a proportion of standards for operational systems and facilities management was excluded. More studies are needed to test the validity of this life cycle framework in different national and cultural settings. Further use of interrupted time series analysis is encouraged when evaluating quality interventions such as accreditation.
Acknowledgments
The authors are grateful to Randy Arcangel for his assistance with running the statistical analysis. This paper is based upon the research from Dr. Devkaran's PhD thesis completed under the supervision of Professor O'Farrell at the Edinburgh Business School, Heriot-Watt University.
References
Footnotes
-
Contributors SD conceived and designed the experiment and analysed the data. SD and PNO'F interpreted the data and wrote the manuscript; they jointly developed the model and arguments for the paper and also revisited the article for important intellectual content. Both authors reviewed and approved the final manuscript.
-
Funding This research received no funding from any agency in the public, commercial or not-for-profit sectors.
-
Competing interests None.
-
Provenance and peer review Not commissioned; externally peer reviewed.
-
Data sharing statement No additional data are available.