Article Text

Abstract
Objectives To determine whether temporal patterns of hypoglycaemia exist in inpatients with diabetes ‘at risk’ of hypoglycaemia (those on insulin and/or sulfonylureas), and if so whether patterns differ between hospitals and between these treatments.
Setting Retrospective multicentre audit of inpatients with diabetes involving 11 acute UK National Health Service (NHS) trusts.
Participants Capillary blood glucose readings of 3.9 mmol/L or less (hypoglycaemia) for all adult (≥18 years) inpatients with diabetes ‘at risk’ of hypoglycaemia were extracted from the Abbott PrecisionWeb Point-of-Care Data Management System over a 4-week period. Overall, 2521 readings of 3.9 mmol/L or less (hypoglycaemia) occurring in 866 participants between 1 June 2013 and 29 June 2013 were analysed.
Results The majority (65%) occurred between 21:00 and 08:59, a pattern common to all Trusts. This was more frequent in sulfonylurea-treated than insulin-treated participants (75.3% vs 59.3%, p=0.0001). Furthermore, hypoglycaemic readings were more frequent between 5:00 and 7:59 in sulfonylurea-treated than insulin-treated participants (46.7% vs 22.7% of readings for respective treatments, p=0.0001). Sulfonylureas accounted for 31.8% of all hypoglycaemic readings. As a group, sulfonylurea-treated participants were older (median age 78 vs 73 years, p=0.0001) and had lower glycated haemoglobin (median 56 (7.3%) vs 69 mmol/mol (8.5%), p=0.0001). Hypoglycaemic readings per participant were as frequent for sulfonylurea-treated participants as for insulin-treated participants (median=2 for both) as were the proportions in each group with ≥5 hypoglycaemic readings (17.3% vs 17.7%).
Conclusions In all Trusts, hypoglycaemic readings were more frequent between 21:00 and 08:59 in ‘at risk’ inpatients with diabetes, with a greater frequency in the early morning period (5:00–7:59) in sulfonylurea-treated inpatients. This may have implications for the continuing use of sulfonylureas in the inpatient setting.
- DIABETES & ENDOCRINOLOGY
- INTERNAL MEDICINE
This is an Open Access article distributed in accordance with the Creative Commons Attribution Non Commercial (CC BY-NC 4.0) license, which permits others to distribute, remix, adapt, build upon this work non-commercially, and license their derivative works on different terms, provided the original work is properly cited and the use is non-commercial. See: http://creativecommons.org/licenses/by-nc/4.0/
Statistics from Altmetric.com
Strengths and limitations of this study
-
This study reports the burden of sulfonylurea-related inpatient hypoglycaemia in National Health Service (NHS) Trusts which has not been previously documented.
-
This study reports that the risk of hypoglycaemia appears to be greater in sulfonylurea-treated inpatients than insulin-treated inpatients in early morning hours.
-
This study confirms a previous single-centre report that hypoglycaemia occurs more commonly at night-time/early morning in NHS Trusts participating in this study.
-
One of the limitations of this study was the inability to obtain the total number of inpatients with diabetes, type of diabetes and proportion of inpatients treated with insulin and sulfonylureas who did not experience hypoglycaemia.
-
Another limitation was that the detection of hypoglycaemic readings was strongly influenced by the glucose monitoring frequency which was predetermined.
Introduction
Until recently, tight glycaemic control in inpatients has been considered to be important in reducing morbidity and mortality as previous studies have shown that inpatient hyperglycaemia is associated with poorer outcomes.1 ,2 However, its advantages are offset by the risk of hypoglycaemia. Although the available data do not conclusively suggest that inpatient hypoglycaemia is an independent risk factor for mortality per se, there is increasing evidence that it is associated with increased mortality, morbidity and length of stay.3–5 In the Normoglycemia in Intensive Care Evaluation–Survival Using Glucose Algorithm Regulation (NICE-SUGAR) multinational randomised control trial, severe hypoglycaemia was 13 times more frequent in the intensively treated group (6.8% vs 0.5%, p<0.001) in which there was found to be a significantly higher 90-day mortality compared with the conventional group.6 Subsequently, a meta-analysis that included the NICE-SUGAR data concluded that tight glycaemic control (with insulin therapy) increased the risk of hypoglycaemia with no overall mortality benefit.7 Indeed, some have suggested that hypoglycaemia should now be considered as a new factor for cardiovascular risk.8
The burden of inpatient hypoglycaemia in NHS hospitals has been well highlighted by the annual National Diabetes Inpatient Audit (NaDIA), the largest 1 week snapshot audit covering >95% of all acute NHS Trusts in England and Wales. In 2012, NaDIA reported that in England alone, 22.4% of inpatients experienced at least one hypoglycaemic episode (capillary blood glucose (CBG) ≤3.9 mmol/L) and 2.2% had at least one hypoglycaemic episode that required rescue injectable therapy.9 Hypoglycaemia was significantly higher in those on insulin therapy; 45.3% of patients with type 1 diabetes and 31.8% of patients with type 2 diabetes treated with insulin had at least one episode of hypoglycaemia.9
The American Diabetes Association (ADA) recommendation that insulin therapy in the form of a basal bolus regimen should be used as the preferred method of achieving and maintaining glycaemic control for all inpatients with diabetes has been widely adopted in the USA.10 In the UK, there is no national consensus on the type of therapy that should be used for managing inpatients with diabetes who had not previously been on insulin, that is, whether oral agents be continued or there be a temporary switch to insulin therapy. Reluctance to adopt the ADA recommendation is supported by the frequency of drug errors and hypoglycaemia associated with insulin use from NaDIA data.9 However, until now, the extent of inpatient hypoglycaemia in the UK from the use of oral agents that can precipitate hypoglycaemia, namely sulfonylurea therapy, is unknown.
In a recent study of inpatient hypoglycaemia in one NHS hospital, we found that more than two-thirds of all hypoglycaemic readings occurred between 21:00 and 8:59.11 The current study was designed to determine whether similar or other temporal patterns of hypoglycaemia exist in other NHS hospitals and, if so, to consider the possible reasons for any observed differences and potential preventative strategies. Additionally, in the previous study, there appeared to be more hypoglycaemic readings in those on sulfonylurea therapy than anticipated, but that study was not specifically designed to examine this.11 As a result of this anecdotal observation and in view of the ADA's abandonment of sulfonylurea therapy in the inpatient setting, the current study was also designed to compare hypoglycaemic rates and patterns in sulfonylurea and insulin-treated inpatients.
Methods
The Joint British Diabetes Society (JBDS) recommends that all adults with blood glucose ≤3.9 mmol/L in hospitals be treated whether or not they are symptomatic.12 We therefore defined hypoglycaemia in our inpatient cohort as CBG ≤3.9 mmol/L irrespective of the presence or absence of symptoms. Severe hypoglycaemia is usually defined as an episode of hypoglycaemia requiring third party assistance. This definition is not applicable to inpatients as most patients will not have direct access to carbohydrates and therefore require third party assistance from a healthcare professional even if the event was mild. We therefore used NaDIA 2012's biochemical classification of hypoglycaemia in which mild hypoglycaemia is defined as a CBG 3–3.9 mmol/L and severe hypoglycaemia as a CBG ≤2.9 mmol/L, irrespective of symptoms and the necessity for third party assistance.9 Although not strictly correct, for the purpose of this study, we defined night-time hypoglycaemia as that between 21:00 and 8:59 and daytime hypoglycaemia as that between 9:00 and 20:59.
The study was a 4-week retrospective multicentre audit, undertaken between 1 June 2013 and 29 June 2013 in 11 NHS Trusts. All Trusts used Precision Xceed Pro as the only CBG monitoring system across the entire hospital. All CBG readings were relayed remotely to the Precision Web Point-of-Care Data Management System (Abbott Diabetes Care Inc, Alameda, CA 94502, USA). From this database, all CBG readings of ≤3.9 mmol/L were extracted at each NHS site including patients’ unique identifiers, ward location, date and time of measurement. Each CBG reading of ≤3.9 mmol/L was considered as an episode but recurrent readings of ≤3.9 mmol/L within 2 h of a previously documented hypoglycaemic episode were automatically excluded as they could reflect retesting for the same event.
We included adult (≥18 years) inpatients with diabetes ‘at risk’ of hypoglycaemia, that is, those treated with insulin and/or sulfonylureas. Data from accident and emergency departments, as well as from paediatric and day case areas, were excluded. Age, length of stay until 15 July 2013, type of therapy and glycated haemoglobin (HbA1c; within the preceding 3 months) data were collected from a retrospective review of case records. Hospital bed numbers (excluding maternity and the previously mentioned areas) and factors that could influence institutional hypoglycaemia rates such as average weekly hours spent by diabetes specialist staff on inpatient diabetes care, meal timings, bedtime snack availability and frequency of CBG monitoring were obtained.
Statistics
After completion of data collection, unique patient identifiers were removed and results were analysed using Microsoft Excel 2007, GraphPad and IBM SPSS Statistics V.20. Descriptive statistics were used to evaluate characteristics of study participants. Unpaired t test was used to compare means in parametric continuous data and Wilcoxon–Mann–Whitney test to compare non-parametric continuous data. Fisher's exact test was used to compare categorical data. Pearson correlation was used to evaluate linear correlation. All p values are two tailed and <0.05 was considered statistically significant.
Results
Overall, 2521 hypoglycaemic readings in 866 participants from 11 NHS Trusts were analysed (tables 1 and 2). Hypoglycaemia was exclusively attributable to sulfonylureas in 32.7% of all participants who had recorded hypoglycaemia and accounted for 31.8% of all hypoglycaemic readings. In participants exclusively treated with sulfonylurea therapy, 22.5% of readings were severe as opposed to 35.9% in insulin-treated participants. There was no difference in the percentage of participants experiencing ≥5 hypoglycaemic readings between those treated with sulfonylureas and those on insulin therapy (17.3% vs 17.7%, p=0.923). Additionally, the number of hypoglycaemic readings per participant was the same for sulfonylurea-treated and insulin-treated participants (median = 2 for both, p=0.888). Length of stay was similar between the two groups (median 11 vs 10 days, p=0.098). Participants on sulfonylureas were significantly older (median age 78 vs 73 years, p=0.0001) and had lower HbA1c (median 56 (7.3%) vs 69 mmol/mol (8.5%), p=0.0001). Length of stay correlated significantly with the number of hypoglycaemic readings per participant for insulin-treated (r=0.286, p=0.0001) and sulfonylurea-treated (r=0.167, p=0.005) participants but did not correlate with age and HbA1c.
Individual data from the 11 NHS Trusts
Combined data from all Trusts for participants on insulin, sulfonylureas or both forms of therapy
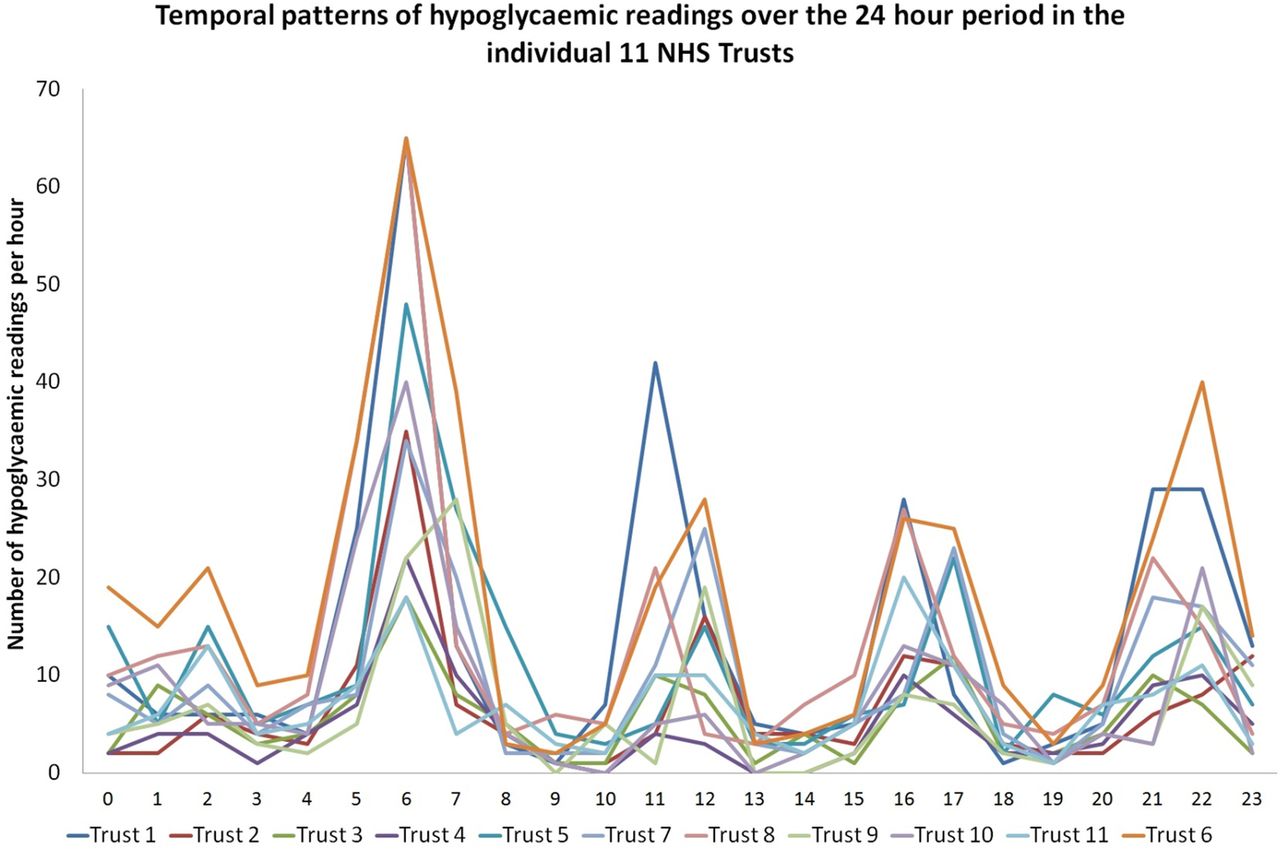
Temporal pattern analysis showed that hypoglycaemic readings were most frequent between 5:00 and 7:59. Not surprisingly, the other frequent times coincided with glucose monitoring times, that is, before lunch, the evening meal and bedtime. Interestingly, a significant number of hypoglycaemic readings occurred between 2:00 and 2:59 in all Trusts (even though routine 3:00 glucose monitoring was performed only by Trust 2). The observed patterns were similar in all Trusts (figure 1). The relative frequency of hypoglycaemic readings between 5:00 and 7:59 in sulfonylurea-treated participants was twice that of the insulin-treated participants (46.7% vs 22.7%, p=0.0001), despite the similar glucose monitoring frequency for both therapies (figure 2). Overall, 65% of all hypoglycaemic readings occurred at night-time, ranging from 54.1% to 72.2% across the 11 Trusts. This was significantly greater in sulfonylurea-treated participants compared with insulin-treated participants (75.3% vs 59.3%, p=0.0001). There was a positive correlation between the proportion of night-time to daytime hypoglycaemic readings and the proportion of hypoglycaemic readings attributable to sulfonylureas for each Trust (r=0.787, p=0.004). There was no significant difference in the number of hypoglycaemic readings per day between weekdays and weekends (mean (SD) 88.15±16.95 vs 84.22±12.16, p=0.538). There was no relationship between the time reported to be spent by diabetes specialist nurses on inpatient care and hypoglycaemic readings per 100 bed ratio (r=−0.342, p=0.303).

Temporal patterns of hypoglycaemic readings over the 24 h period in the individual 11 National Health Service (NHS) Trusts. The x axis represents the time period, for example, 0 represents the time period between 00:00 and 00:59, 1 represents the time period between 01:00 and 01:59, etc. The y axis represents the number of hypoglycaemic readings occurring in that time period. The figure demonstrates very similar temporal patterns for all Trusts.

Temporal patterns of hypoglycaemic readings over the 24 h period in all participants on insulin, sulfonylureas and both. The x axis represents the time period, for example, 0 represents the time period between 00:00 and 00:59, 1 represents the time period between 01:00 and 01:59, etc. The y axis represents the number of hypoglycaemic readings occurring in that time period. The figure demonstrates that the highest frequency occurs between 05:00 and 07:59 for both insulin and sulfonylurea therapies.
Discussion
Expecting to find variations in temporal patterns of hypoglycaemic readings related to differing clinical practices, we found that all Trusts demonstrated the same pattern of hypoglycaemia as seen in the index hospital.11 We had previously postulated prolonged fasting (14 hours) between the evening meal and breakfast as well as the lack of bedtime carbohydrate snacks in the index hospital as important contributory factors. It is therefore of interest that all Trusts in this study reported similar prolonged fasting (13.5–15.5 hours) after the evening meal and that none guaranteed the provision of bedtime carbohydrate snacks. This feeding practice appears to be common in UK hospitals as reported in our previous online survey of NHS Trusts.11 We believe that addressing these meal timings and provision of bedtime carbohydrate snacks could reduce the frequency of hypoglycaemia in UK hospitals.
The second important finding was the extent of inpatient hypoglycaemia related to the use of sulfonylurea therapy. While the burden of sulfonylurea-related hypoglycaemia needing emergency medical assistance is increasingly recognised in the community setting,13–15 its contribution to inpatient hypoglycaemia appears not to have been fully appreciated. In this study, we found that one-third of hypoglycaemic readings were related to sulfonylurea therapy, and indeed the frequency of inpatients experiencing markedly recurrent hypoglycaemia (≥5 hypoglycaemic readings) was the same as those receiving insulin. In a recent single-centre report from one of the few US hospitals where oral agents continue to be used in the management of inpatient diabetes, one in five patients treated with sulfonylureas experienced at least one hypoglycaemic episode during their inpatient stay.16 In our study, it was not possible to determine this as the initial source data were hypoglycaemic readings recorded in the PrecisionWeb Point-of-Care Data Management System, and therefore the total number of inpatients with diabetes was not known. In addition, for the same reason, it was not possible to determine whether those with low estimated glomerular filtration rate (eGFR) had more hypoglycaemia, nor whether different insulin regimes were associated with greater risk.
There are a number of factors that may contribute to frequent hypoglycaemia in inpatients on sulfonylurea therapy. Healthcare professionals have greater concern for insulin-treated inpatients than those on tablets who are often considered to have less severe diabetes and therefore perceived as less likely to suffer hypoglycaemia. Physicians, nurses and even the small subgroup of patients who self-manage their diabetes in hospital are less inclined to adjust doses of oral hypoglycaemic agents than insulin even during periods of varying meal intake. This is reflected in the Trainees Own Perception of Delivery of Care (TOPDOC) study of UK trainee-doctors who, when given an example of a patient with poor control, were less likely to alter the dose of oral agents compared with insulin (65% vs 79%).17 Finally, the pharmacokinetic profile of sulfonylureas is less predictable compared with insulin, especially in the complex inpatient setting with changing nutritional status, renal function, etc.
In the USA, insulin therapy is the preferred treatment for all inpatients with diabetes.10 The basal-bolus system, utilising well-tested insulin regimens such as the RABBIT medical and surgical protocols, is extensively used and has been shown to be associated with low frequencies of inpatient hypoglycaemia.18 ,19 It is unlikely that such regimens will be adopted in the UK in the near future as this would require transferring up to one in six inpatients with diabetes to basal-bolus insulin therapy, when at present the expertise for initiating and monitoring inpatients on insulin therapy is very limited. Thus, NaDIA 2012 found that 32.2% of NHS England Trusts did not have a dedicated diabetes inpatient specialist nurse.9 Second, very serious concerns have been raised on the safe use of insulin in inpatients in UK.20–22 The National Patient Safety Agency identified 16 600 reported incidents involving insulin between November 2003 and November 2009, the majority occurring in inpatients; 24% caused harm to the patient and there were 18 individual incidences associated with fatal or severe outcomes.22 Importantly, these figures represent the tip of the iceberg as it is recognised that such errors are grossly under-reported in the UK. Thus, in contrast, NaDIA 2012 found that in England 21.8% of inpatients with diabetes treated with insulin therapy in the week of the audit had one or more insulin errors, summating to 150 000 errors each year.9 Furthermore, in a recent retrospective survey of diabetes inpatient teams, at least 12 episodes of serious harm related to inpatient hypoglycaemia (including death, cardiac arrest and irreversible brain injury) were reported to have occurred in the 41 UK Trusts who participated in the survey covering a 12-month period. Insulin therapy was implicated in at least 10 of these events.23 It is hoped that in the future electronic prescribing and clinical decision support systems will help to minimise these errors while recognising that such systems are not infallible and will not prevent errors either in insulin administration or in management decisions.24 ,25
Finally, one of the aims of this multisite study was to identify and learn from differences between Trusts. Trust 2 had the lowest frequency of mild and severe hypoglycaemia per 100 beds and the lowest number of recurrent hypoglycaemic readings. It may be relevant that this Trust introduced a number of changes in practice to reduce their institutional hypoglycaemia rates following a fatal adverse event related to inpatient hypoglycaemia. These included intentionally relaxing inpatient glycaemic targets to 7–11 mmol/L in comparison with the recommended acceptable range of 4–12 mmol/L,26 introducing an aggressive capillary glucose monitoring regimen including 3:00 glucose testing (the only trust to do so) and implementing intensive education programmes for nursing and medical staff achieved by increasing the number of inpatient diabetes specialist nurses and their time devoted to inpatient care (table 1). Whether replicating these practices in other Trusts would lead to reductions in their institutional hypoglycaemia rates can only be speculated on.
We recognise several limitations to our study. The source data were the PrecisionWeb Point-of-Care Data Management System. As a result, we were unable to obtain the total number of inpatients with diabetes, a breakdown by type of diabetes and the proportions treated with insulin and sulfonylureas who did not experience hypoglycaemia. Therefore, we were unable to calculate the exact risk with each therapy per se. The detection of hypoglycaemic readings was strongly influenced by the glucose monitoring frequency, which was predetermined and similar in all hospitals, occurring at mealtimes and bedtime. Continuous glucose monitoring would almost certainly reveal an even greater frequency of hypoglycaemic readings, especially at night-time when patients are not routinely monitored. As previously mentioned, while hospital mealtimes may be a major contributory factor for the frequency of night-time and early morning hypoglycaemia, we acknowledge that we did not consider other important factors for hypoglycaemia in hospitalised patients such as sepsis, renal and liver disease, overall nutritional status and changing drug therapies such as tapering of steroid therapy. Despite these limitations, we believe that this study provides important information on institutional patterns of inpatient hypoglycaemia in the ‘at risk’ inpatients and the impact of sulfonylurea therapies.
In summary in UK hospitals, hypoglycaemia is detected more frequently during the period between 21:00 and 8:59 (night-time), and sulfonylurea therapy appears to present a greater risk than insulin particularly between 5:00 and 7:59 (early morning). Institutional feeding patterns appear to be contributory but further work is required to determine whether a change in mealtimes would reduce institutional hypoglycaemia rates. Importantly, our findings may have implications for the continued use of sulfonylureas in the UK in the inpatient setting.
References
Footnotes
-
Collaborators All other members of the MaGIC study group designed the audit, assisted in data collection and revised the draft paper. The following are members of the MaGIC (Managing Glycaemia using Innovations in Care) study group (UK): Gerry Rayman (Group lead, The Ipswich Hospital NHS Trust), Rajesh Rajendran (The Ipswich Hospital NHS Trust), Christopher Kerry (The Ipswich Hospital NHS Trust), Ainslie Lang (Royal United Hospital Bath NHS Trust), James Young (Worcestershire Acute Hospitals NHS Trust), Lisa Smith (Worcestershire Acute Hospitals NHS Trust), Jane Wilson (Worcestershire Acute Hospitals NHS Trust), Erwin Castro (East Essex Healthcare NHS Trust), Valerie Edwards (East Essex Healthcare NHS Trust), Fathi Abourawi (Northern Lincolnshire and Goole Hospitals NHS Foundation Trust), Caroline Andrews (Northern Lincolnshire and Goole Hospitals NHS Foundation Trust), Francesca Swords (Norfolk and Norwich University Hospitals NHS Foundation Trust), Michelle Nation (The Royal Bournemouth and Christchurch Hospitals NHS Foundation Trust), Beverley Eaglesfield (Derby Hospitals NHS Foundation Trust), Anne Lee (Derby Hospitals NHS Foundation Trust), Kim Heathcote (NHS Dumfries and Galloway), Fiona Green (NHS Dumfries and Galloway), Louise Clark (NHS Dumfries and Galloway), Jenny Tringham (Frimley Park Hospital NHS Foundation Trust), Laura Dinning (Harrogate and District NHS Foundation Trust) and Peter Hammond (Harrogate and District NHS Foundation Trust).
-
Contributors RR designed the data collection tools, monitored the data collection, cleaned and analysed the data, and drafted and revised the paper. He is the guarantor. CK assisted in data collection and revised the draft paper. GR initiated the audit, monitored the data collection, drafted and revised the paper and was the lead for the audit.
-
Funding This research received no specific grant from any funding agency in the public, commercial or not-for-profit sectors.
-
Competing interests The authors declare that the MaGIC study group meetings were sponsored by Abbott, UK who assisted in extraction of data from Precision Web Point-of-Care Data Management System but was not involved in the design or origin of the study, nor in funding or influencing the analysis, nor in interpretation or reporting of the data nor in the preparation of this manuscript. The authors declare no financial relationships with any organisation that might have an interest in the submitted work in the previous three years; no other relationships or activities that could appear to have influenced the submitted work.
-
Ethics approval Institutional approval was obtained from the audit department of each individual NHS Trust.
-
Provenance and peer review Not commissioned; externally peer reviewed.
-
Data sharing statement No additional data are available.