Article Text

Abstract
Objectives To explore the association between weather conditions and hospital admissions for pneumonia in Shanghai.
Design A time-series analysis was performed for a period of 4 years (January 2008–December 2011). A generalised additive model was used to calculate the relative risks.
Setting Shanghai, China.
Participants All daily hospital admissions for pneumonia were obtained from the Shanghai health insurance system between 1 January 2008 and 31 December 2011 (n=99 403).
Results The relationship between the mean temperature and pneumonia hospital admissions followed a V-shaped curve, with an optimum temperature (OT) at 13°C. When the mean temperature was below the OT, a 1°C decrease corresponded to a 4.88% (95% CI 2.71% to 7.09%) and 5.34% (95% CI 2.04% to 8.74%) increase in pneumonia hospital admissions in lag 4 using a single-day lag structure and lag 0–7 using a multiday lag structure. When the mean temperature ≥OT, no adverse effects from the temperature on pneumonia hospital admissions were found. The magnitude of the effects of temperature varied across gender and age groups. Hospitalisations for pneumonia increased by 15.99% (95% CI 0.06% to 34.46%) in the cold period.
Conclusions Cold temperature may be one of the important risk factors for pneumonia hospitalisations. Prevention programmes are needed to reduce the impact of cold temperature on pneumonia hospitalisations such as developing a weather warning system within a wide public health context.
- pneumonia
- temperature
- time-series
- generalized additive model
This is an Open Access article distributed in accordance with the Creative Commons Attribution Non Commercial (CC BY-NC 3.0) license, which permits others to distribute, remix, adapt, build upon this work non-commercially, and license their derivative works on different terms, provided the original work is properly cited and the use is non-commercial. See: http://creativecommons.org/licenses/by-nc/3.0/
Statistics from Altmetric.com
Strengths and limitations of this study
-
Generalised additive models and two different lag structures were developed to explore the possible interaction between meteorological factors and hospital admissions for pneumonia.
-
We used the available outdoor monitoring data of ambient meteorological factors derived from a monitoring station rather than measures of personal exposure. This is expected to result in exposure misclassification.
Background
Despite the availability of safe and effective antibiotics and vaccines for treatment and prevention, pneumonia is still a leading cause of death worldwide.1 ,2 Pneumonia, in general lower respiratory tract infections, accounts for 6.6% of all deaths globally.3 In adults, the incidences varied between 1.6 and 11/1000 adults in different countries, with hospitalisation proportions ranging from 40% to 60%.4 China is estimated to have 2.5 million pneumonia cases annually, of which 5% die from pneumonia-related diseases.5 ,6
Climate change is potentially the largest global threat to human health.7 In recent years, the association between meteorological factors and respiratory diseases has been observed extensively. Temperature has been reported to lead not only to direct deaths and illnesses and also to the aggravation of respiratory diseases.8 ,9 Several studies have emphasised the relationships between temperature and daily respiratory deaths.10 ,11 Generally, the curves between temperature and daily respiratory deaths were V-shaped or J-shaped.12 ,13 In addition, time-series studies on respiratory mortality have suggested that temperature has lag effects up to 3 weeks after exposure.14 As one of the major respiratory diseases, pneumonia has been reported to be influenced by meteorological factors.11 ,15–17 However, the relationships varied across areas with different weather patterns and latitudes. In Japan, for example, the case numbers of Mycoplasma pneumoniae pneumonia increased with increased average temperature and relative humidity.18 Contrarily, neither hot nor cold temperatures had much effect on pneumonia deaths in hot cities in the USA.11
Although pneumonia is recognised to result in substantial morbidity and mortality in some developed countries, the potential patterns of associations in other countries remain unclear, whereas the populations of source limited countries may be more sensitive to changes in weather conditions because of their poorer public health infrastructure and vulnerability of the populations. We therefore performed a time-series analysis to estimate the acute effects and time pattern of meteorological factors on hospital admissions for pneumonia. A better understanding of the possible interaction will provide relevant information for developing public health plans and risk assessments in an ambient environment.
Materials and methods
Data collection
Shanghai is the most populous city in China, located at the eastern tip of the Yangtze River Delta, at latitude 31°14′N and longitude 121°29′E. The city comprises 19 urban/suburban districts and counties, with a total area of 6341 km2, and had a population of over 23 million people by the end of 2010, of which 14 million are registered residents. The city features a moderate subtropical climate, with four distinct seasons and abundant rainfall.
For this analysis, the target population included all registered population living in Shanghai with urban residents’ basic medical insurance (hereafter population 1) and urban workers’ basic medical insurance (hereafter population 2). Population 1 included children, students and non-employed adults and excluded those with new rural cooperative medical insurance. Population 2 included employees, retirees and other insuranced participants. Daily hospital admissions for pneumonia incurred by the two populations of Shanghai from 1 January 2008 to 31 December 2011 were collected from the Shanghai Municipal Medical Insurance System. All forms of pneumonia coded J12–J18 according to the International Classification of Diseases, the tenth version (ICD-10) were included for the analysis. Daily meteorological data (including mean temperature, relative humidity, precipitation and wind speed) were obtained from the Shanghai Center for Urban Environmental Meteorology. The weather data were measured at a fixed meteorological station located in the Xuhui District of Shanghai. Owing to the probable confounding effects that air pollution and suspended particles may have on temperature and pneumonia, air pollution data (sulfur dioxide (SO2), nitrogen dioxide (NO2) and particulate matter with particle size below 10 μ (PM10)) were also obtained from the Shanghai Center for Urban Environmental Meteorology.
Patient records/information was de-identified prior to analysis; daily aggregated counts for hospitalisations were calculated and used to implement the final analysis. The authors did not have access to individual patient information prior to data anonymisation and aggregation, and therefore there was no individual interaction with patients in this study.
Statistical methods
The hospital admissions for pneumonia and meteorological factors were linked by the date and therefore can be analysed with a time-series model.19 As the number of daily hospital admissions is a type of low-probability event and follows a Poisson distribution,20 a Poisson generalised additive model (GAM) approach was used to explore the association between meteorological factors and hospital admissions for pneumonia.
In order to examine the effect of meteorological factors on hospital admissions for pneumonia, we controlled the potential confounders such as long-term trend, the day of the week (DOW) and air pollutants. We first fitted non-parametric smoothing terms for the trend on days and a dummy variable for DOW. Thereafter, four meteorological factors were introduced into the model to explore the relationship between meteorological factors and hospital admissions for pneumonia. The independent model is described below: where E(Yt) denotes the estimated daily hospital admissions for pneumonia counted on day t; α is the intercept; s() denotes a regression spline function for non-linear variables21; time is the number of calendar days on day t; Zt indicates the pollutant concentrations on day t; df is the degrees of freedom. The partial autocorrelation function (PACF)22 was used to select the degrees of freedom of time trends until the absolute values of the sum of PACF for lags up to 30 reached a minimum. Sensitivity analyses were performed to check whether the results were robust to the specification of parameters in the model. We found that the effects were stable when using 4 or 5 degrees of freedom per year for time. In addition, we modified degrees of freedom of the smoothing spline (4–5 df) for the meteorological factors, and the estimates were not changed substantially. These sensitivity analyses resulted in the selection of 4 df per year to control for time trend and 4 df for meteorological factors. For meteorological factors, the selection of degrees of freedom was based on minimising Akaike's information criterion (AIC).23
Additionally, we fitted linear terms for the mean temperature in the GAM to explore the log risk of daily hospital admissions for pneumonia associated with a unit increase of mean temperature. On examination of the lag effects of meteorological factors on hospital admissions for pneumonia, we developed two different lag structures: single-day lag and multiday average starting from lag 0. For example, lag 0–1 stands for the 2-day moving average of current and previous day values. Relative risk (RR) refers to the ratio of the probability of an event occurring, while excess risk (ER) is the change in risk of a given activity. We used ER to evaluate the association between daily hospital admissions for pneumonia and a unit change of mean temperature. The value of ER is equal to the value of RR minus one.
We defined ‘cold period’ as a period of at least five consecutive days with a daily mean temperature below the 25th centile (9.2°C) and ‘hot spot’ for admissions as the days with daily pneumonia hospital admissions larger than the 75th centile (85).
Data preparation and analysis were carried out using EXCEL 2010, whereas regression models were fitted using the statistical software R V.3.0.1 by using the mgcv package.
Results
Data description
Table 1 summarises the basic statistics for our study. During the study period, totalling 1461 days, 99 403 hospital admissions for pneumonia were recorded in Shanghai with a mean of 68 (range, 9–195) per day. During the same time period, the mean daily temperature was 17.3°C (range, −3.4 to 35.7°C), reflecting the subtropical climate in Shanghai. A correlation matrix table for the meteorological and air pollution variables was provided in the online supplementary table S2.
Summary statistics of daily hospital admissions for pneumonia and meteorological factors in Shanghai, 2008–2011
Daily hospital admissions and meteorological factors
Figure 1 shows the exposure–response (E–R) relationships between daily hospital admissions for pneumonia and mean temperature, relative humidity, precipitation and wind speed, after adjusting for long-term trend, DOW and the air pollutants in the GAM. The relationship between mean temperature and pneumonia hospital admissions followed a V-shape (p<0.001; figure 1A). The optimum temperature (OT), corresponding to the lowest point in the E–R curve, was about 13°C. Below the OT, as temperatures increased, the risk of hospital admissions for pneumonia decreased and then reversed the trend above the OT. In addition, relative humidity, precipitation and wind speed had no effects on pneumonia hospital admissions.

Smoothing plots of meteorological factors against hospital admissions for pneumonia. (A) mean temperature at lag 4; (B) relative humidity at lag 0; (C) precipitation at lag 0; and (D) wind speed at lag 0. The solid lines indicate the estimated mean percentage of change in pneumonia hospital admissions, the dotted lines represent 95% CI and log-risk represents log (RR).
Lag effects of temperature on daily hospital admissions
As there was a V-shaped relationship between mean temperature and hospital admissions for pneumonia, we stratified the data by temperature above (‘hot temperature’) or below (‘cold temperature’) the OT. Then linear terms for the daily mean temperature were fitted in GAMs (table 2). In single-day lag structures, associations (p < 0.01) between cold temperature and hospital admissions for pneumonia were found at lag 2–5. The effect from cold temperature appears to be larger than that from hot temperature. The multiday metrics of mean temperature exposure also showed a larger effect of cold temperature than that of hot temperature. The effects by cold temperature peaked at lag 0–6. At lag 0–6, a 1°C decrease in the 7-day moving average of mean temperature corresponded to a 5.34% (95% CI 2.04% to 8.74%) increase in hospital admissions for pneumonia. However, no adverse effects of hot temperature were found either in single-day or multiday lag structures.
Per cent change in daily hospital admissions for pneumonia and 95% CI per 1°C change in mean temperature using alternative lags
Effects of cold temperature on different types of people
Since no adverse effects of hot temperature in hospital admissions for pneumonia were found, we focused further analysis on the association between cold temperature and hospital admissions for pneumonia. The association between hot temperature and hospital admissions for pneumonia was showed in online supplementary table S3. Table 3 shows the different single-day lag effects of cold temperature on different subpopulations. We found the adverse effects of cold temperature in men and women. The effects increased from lag 0, with peaks in lag 3 for men and in lag 4 for women, and then declined. In age-specific analysis, cold temperature was positively associated with pneumonia hospital admissions and had adverse effects in the categories over age 45. The OT for people who were aged above 65 was 18°C, which was larger than that for those younger than 65.
Per cent change in daily hospital admissions for pneumonia and 95% CI per 1°C decrease in cold temperature stratified by gender and age
Figure 2 shows the single-day lag effects of cold temperature on different subpopulations. The effects reached a maximum in lag 3 on population 1 while in lag 4 on population 2. A 1°C decrease in cold temperature corresponded to a 4.87% (95% CI 2.67% to 7.12%) increase in hospital admissions for pneumonia on population 2 in lag 4 while it was 4.13% (95% CI 0.77% to 7.60%) on population 1 in lag 3. The effects on population 2 appear to be larger and more persistent than those on population 1.
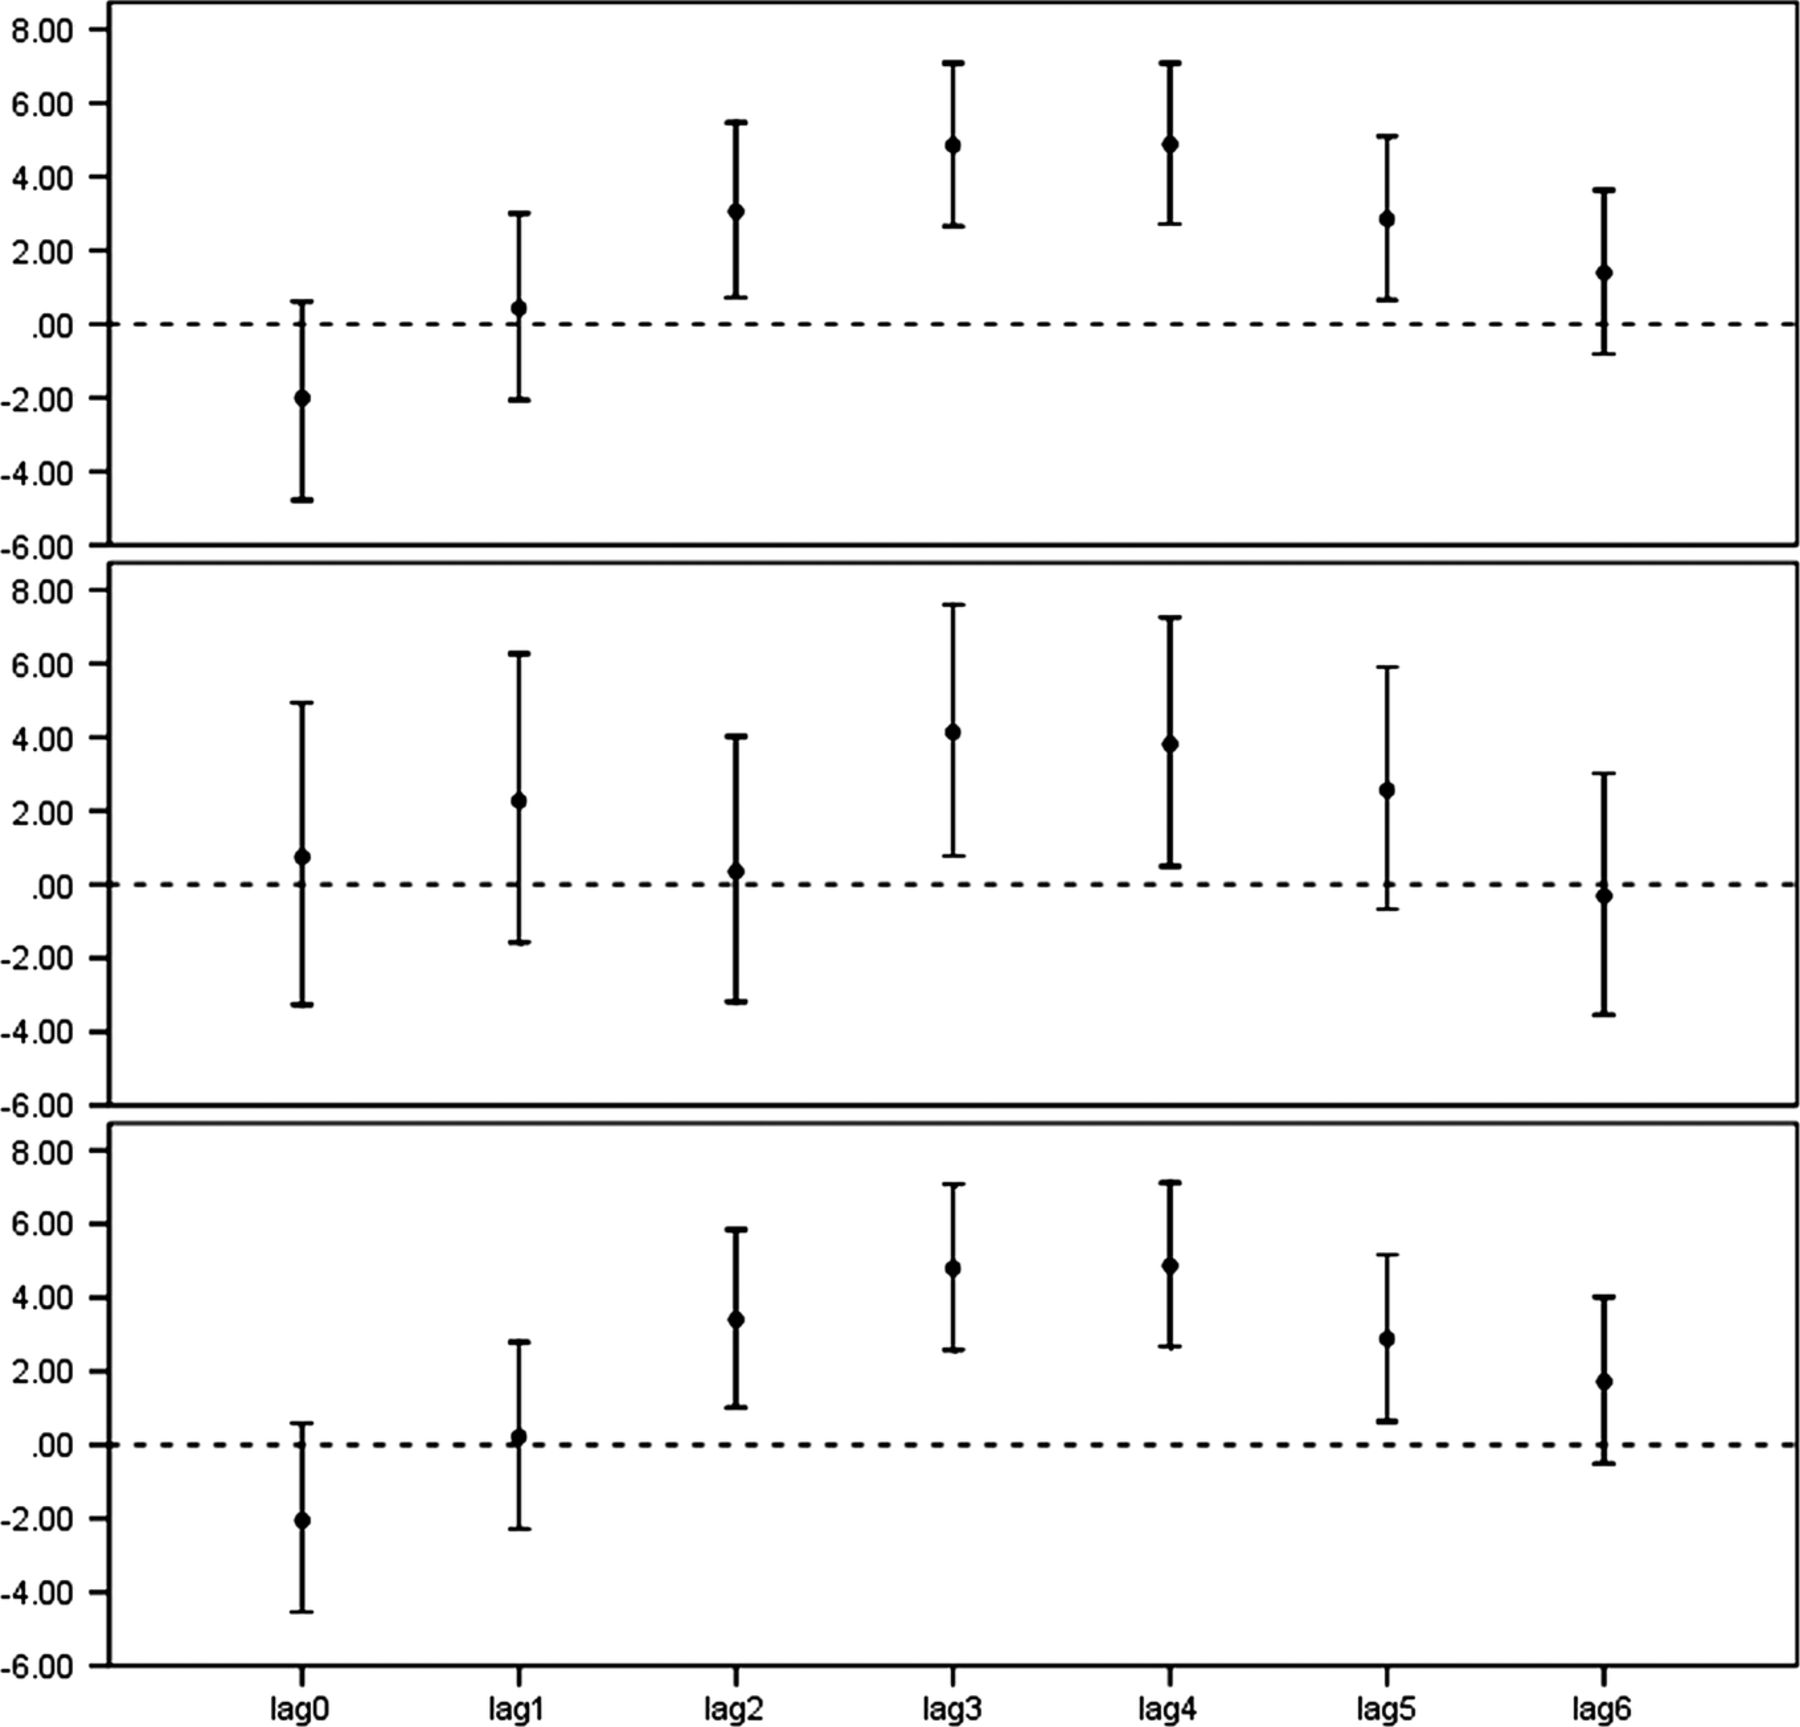
Per cent change in daily hospital admissions for pneumonia and 95% CIs per 1°C decrease in cold temperature using a single-day lag structure by a different subpopulation.
Effects of cold period on pneumonia hospital admissions
Since cold temperature had large and persistent effects on pneumonia hospital admissions, we conducted a further analysis of cold temperature effects.
Figure 3 shows that pneumonia hospital admissions varied with the daily mean temperature, while the cold period is related to hot spots for pneumonia hospital admissions. A 2 × 2 table to show the association between cold period and hot spots was provided in online supplementary table S1. We used the cold period as a binary classification variable and fitted it in the GAM. The result showed that hospital admissions for pneumonia increased by 15.99% (95% CI 0.06% to 34.46%) in the cold period.

Daily mean temperature and daily pneumonia hospital admissions. Cold period means a period of at least five consecutive days with a daily mean temperature below the 25th centile (9.2°C); ‘hot spot’ for admissions means the day with daily pneumonia hospital admissions larger than the 75th centile (85).
Discussion
This time-series analysis showed that ambient temperature was associated with hospital admissions for pneumonia, while relative humidity, precipitation and wind speed did not show the same. To the best of our knowledge, this is the first to report the effects of meteorological factors on hospital admissions for pneumonia in China.
Generally, temperature appears as V-shaped, U-shaped or J-shaped variations with mortality or morbidity, with OT corresponding to the lowest point in the temperature mortality curve.8 ,24 The present study showed a V-shaped curve in the relationship between mean temperature and hospital admissions for pneumonia. Although the observation is consistent with the reported studies, we observed a different OT (13°C) in Shanghai, in comparison with 20°C in St Paul,25 16.5°C in the Netherlands and 19°C in London.26 We found that, similar to the Beijing study,27 cold temperature presented larger effects. Other studies report that the peaks of the respiratory syncytial virus and invasive pneumococcal disease were inversely correlated with temperature28 ,29 and that the cold temperature was favourable to the spread of the influenza virus,30 which might partly explain the association between cold temperature and hospital admissions for pneumonia.
We developed two different lag structures to examine the health effects of temperature. Adverse effects were observed in single-day and multiday lag effects models for cold temperature, while neither single-day nor multiday lag effects were found from hot temperature. These findings were slightly different from other studies on morbidity. For example, Braga et al11 described that the effect of cold temperatures persisted for days, whereas the effect of high temperatures was restricted to the day or the day before. Yu et al31 demonstrated that cold temperature had a lag time of 21 days, while hot temperature appears to exhibit acute effects in the short term.
Given the established importance of seasonal variation in mortality and morbidity excesses of respiratory diseases,32 several research studies have reported particularly on the relationship between extremely cold climatic episodes and mortality and morbidity, noting that the tendency for a winter mortality increased after the occurrence of cold spells.33 However, there is neither a uniform and agreed definition of a cold spell34 nor a precise definition of the period for which such events should be studied. Our criterion for identifying a cold period was to combine time and temperature thresholds, which is similar to that of other studies.35 ,36 We found that there was a 15.99% increase in pneumonia hospital admissions in the cold period. Further studies are needed to explore if the cold temperature effects on pneumonia are due to the cold temperature itself or a result of other factors.
The effects of cold temperature on different populations were observed. The effect of cold temperature on population 2 was found to be larger and more persistent than that on population 1. Adverse effects of pneumonia hospitalisations on population 2 were larger (ER increased by 0.67% and 1.06% in lag 3 and lag 4, respectively) than those on population 1. Population 2 included employees and retirees while population 1 was mostly made up of non-employed adults and students. Employees have more work pressure and have fewer opportunities to exercise, which might weaken their immunity; the elderly people are usually more susceptible to heat-related or cold-related health risks.37 ,38 The magnitude of the effects of temperature varied with gender and age. The OT for ≥65 age groups was higher than that for <65 age groups, indicating that the elderly people had increased vulnerability to cold weather for pneumonia. Cold temperature only showed its effect on people older than 45. For residents in this age group, the ability to regulate body temperatures is reduced, and sweating thresholds are generally elevated in comparison with younger people.39
Influenza epidemics, which generally occur in the cold weather, have been accounted for as confounders in some studies.40 Owing to the lack of reliable data, we did not include the influenza epidemics as a control factor. However, the smooth function of time should have eliminated most of such residual secular effects and there is no reason to expect an association of influenza with temperature (after controlling for the time trend). In addition, many other studies have not included influenza as a confounder.8 ,12
Our study has several limitations. First, we used the available outdoor monitoring data of ambient meteorological factors derived from a monitoring station rather than measures of personal exposure. This was expected to result in exposure misclassification. Second, our study only contained hospitalisations for pneumonia, but excluded less severe cases. Therefore, the effects of the meteorological factors on hospital admissions of pneumonia that we observed may not be applicable to the effects on the overall situation of pneumonia. Third, the findings of this study should be treated cautiously when generalised to other locations, particularly in places with different climates. In addition, the influence of ozone was not controlled for, because the data of ozone were not available.
Conclusion
We observed associations between meteorological factors and daily pneumonia hospital admissions in Shanghai. Cold temperature presented larger and more persistent effects and the magnitude of these effects of temperature varied with gender and age. Cold period had adverse effects on pneumonia hospital admissions. Prevention programmes may be needed to reduce the impact of cold temperature such as developing a weather warning system within a wide public health context.
References
Supplementary materials
Supplementary Data
This web only file has been produced by the BMJ Publishing Group from an electronic file supplied by the author(s) and has not been edited for content.
Files in this Data Supplement:
- Data supplement 1 - Online supplement
Footnotes
-
Contributors JX, LP and XY provided and organised the data; YL, YZ and RC conducted the study and performed the data analysis, and LY drafted the manuscript; WW, HK and DR reviewed and edited the manuscript, and WW conceived the study and contributed to the study design. All authors read and approved the final manuscript.
-
Funding This study was funded by the Global Environment Change Research in Fudan University (Grant No. EZH1829007/003), the Chinese Meteorological Administration (Grant No. GYHY201206027), the Scientific Innovation Action Plan by the Science and Technology Commission of Shanghai Municipality (Grant No. 13511504906) and the programme of Key Discipline Development of Public Health of Shanghai (Grant No. 12GWZX0101).
-
Competing interests None.
-
Provenance and peer review Not commissioned; externally peer reviewed.
-
Data sharing statement No additional data are available.