Article Text

Abstract
Objectives Suboptimal health status (SHS) is considered to be an intermediate status between disease and health, and is characterised by a decline in vitality, in physiological function and in the capacity for adaptation. Although the incidence of SHS is high, the underlying causes remain unclear. Lifestyle is one of the most important factors affecting health status; however, the relationship between SHS and lifestyle has not been elucidated.
Design Cross-sectional survey.
Setting A questionnaire, based on ‘Health Promoting Lifestyle Profile-II (HPLP-II)’ and ‘Sub-Health Measurement Scale V1.0 (SHMS V1.0)’, was sent to four colleges in four districts (Guangzhou, Foshan, Zhanjiang and Shaoguan) of China between May and July 2013.
Participants A total of 12 429 questionnaires were distributed during the study period, and 11 144 completed responses were received.
Results The prevalence rates for the ‘healthy’, ‘SHS’ and ‘disease’ groups of respondents (students) were 22.81% (2542), 55.9% (6234) and 21.25% (2368), respectively. Most of the students reported a ‘moderate’ or ‘good’ lifestyle. There were significant differences in lifestyle and health status between the two genders. It was notable that health status was significantly positively correlated with lifestyle (r=0.563). For every dimension of the HPLP-II model, the mean values were lower for those participants who reported as ‘SHS’ or ‘disease’ than for those who reported that they were ‘healthy’. The individual dimensions of the HPLP-II model, including ‘spiritual growth’, ‘health responsibility’, ‘physical activity’, ‘interpersonal relations’ and ‘stress management’ were all related to SHS.
Conclusions Health status is significantly positively correlated with lifestyle. Poor lifestyle is a risk factor for SHS. Conversely, adopting a healthier lifestyle can improve SHS.
Trial registration number ChiCTR-OCH-12002317.
- PUBLIC HEALTH
- EPIDEMIOLOGY
- SOCIAL MEDICINE
This is an Open Access article distributed in accordance with the Creative Commons Attribution Non Commercial (CC BY-NC 4.0) license, which permits others to distribute, remix, adapt, build upon this work non-commercially, and license their derivative works on different terms, provided the original work is properly cited and the use is non-commercial. See: http://creativecommons.org/licenses/by-nc/4.0/
Statistics from Altmetric.com
Strengths and limitations of this study
-
The prevalence rate of suboptimal health status (SHS) is 55.9% in Chinese students by a cross-sectional study.
-
Health status is significantly positively correlated with lifestyle.
-
Poor lifestyle is a risk factor for SHS; conversely, adopting a healthier lifestyle can improve SHS.
Introduction
Suboptimal health status (SHS) is considered to be an intermediate status between disease and health. In the traditional Chinese medicine guidelines released by the China Association of Chinese Medicine (CACM), it is characterised by a decline in vitality, in physiological function and in the capacity for adaptation.1–3 Over the years, the concept of SHS has been widely accepted in many other countries, including Japan,4 Canada and Australia.5 ,6 According to a survey of civil servants undertaken by ourselves, SHS was applicable to 65.1% of the total survey population7; although the incidence of SHS is high, the causes remain unclear.
Lifestyle is one of the most important factors affecting health.8–11 To achieve the goal of a healthy population worldwide requires action in disease prevention as well as health promotion. Health-promoting lifestyles are a “multidimensional pattern of self-initialed actions and perceptions that serve to maintain or enhance the level of wellness, self-actualization, and fulfillment of the individual.”12 Working on this basis, Walker et al12 developed the Health Promoting Lifestyle Profile (HPLP) to describe an individual's health promotion lifestyle. HPLP has since been translated into several languages, and it is used widely to study lifestyle and health status.13–18
A number of previous studies have proposed that SHS may be related to poor lifestyle habits, such as going to bed late, work-related and study-related stress, physical inactivity and poor diet pattern.1 ,7 ,19–22 In the work reported here, we have studied the relationship between SHS and lifestyle factors using the Chinese version of HPLP-II (translated by Yen).15
Methods
Survey instruments
A cross-sectional study was conducted among four colleges in four areas of China (Guangzhou, Foshan, Zhanjiang and Shaoguan). Data were collected between May and July 2013. A questionnaire, which sought information on sociodemographic indicators and which included ‘HPLP-II’ and ‘Sub-Health Measurement Scale V1.0 (SHMS V1.0)’, was used to assess the respondents’ health status and lifestyle. The questionnaire was completed by each volunteer within 30 min. Verbal consents were deemed to be sufficient because the students had volunteered for the study and could refuse to take part if they wished. The objective of the survey was to study the students’ health status rather than to intervene. All student data were kept strictly confidential. The ethics committee also approved the consent procedure.
SHS evaluation
The evaluation of SHS was performed according to the clinical guidelines for SHS published by the CACM.2 Participants completed the SHMS V1.0, which is a multidimensional, self-report symptom inventory that has been developed by our research group in China.23 SHMS V1.0 consists of 39 items in total, 35 of which are divided among three symptom dimensions (physiological, psychological and social and 10 factors, as indicated in table 1. Thus, the physiological dimension comprises the following factors: physical condition (three items), organ function (six items), body movement function (three items) and vigour (two items); the psychological dimension comprises: positive emotion (four items), psychological symptoms (six items) and cognitive function (two items); and the society dimension comprises: social adjustment (four items), social resources (three items) and social support (two items). A final dimension, healthy evaluation, comprises four further items. For each item, there are five response categories (defined as ‘none’, ‘occasionally’, ‘sometimes’, ‘constantly’ and ‘always’) corresponding, respectively, to the frequency of occurrence of each symptom. In the data analysis, ‘none’ was assigned a score of 1, ‘occasionally’ 2, ‘sometimes’ 3, ‘constantly’ 4 and ‘always’ 5. Participants were asked about uncomfortable symptoms that they had experienced during the previous month. The total scores were then calculated. A low total score represents a low estimate of SHS (ie, poor health).
Theoretical framework of Sub-Health Measurement Scale V1.0 (SHMS V1.0)
Before the survey, the students had attended an annual school health examination in hospital. The health examination included medical history, a physical examination, blood haematology and biochemistry analyses, rest ECG and chest radiography. After excluding any participants who were diagnosed with clinical disease in the health examination, the threshold values for SHS in the physiological, psychological and society dimensions of SHMS V1.0 were 68, 67 and 67, respectively. If participants were not in SHS with respect to any of these three dimensions (physiological, psychological and society), they were considered healthy. The threshold values were determined by the SHS Branch of the CACM in Guangdong. The validity and reliability of SHMS V1.0 has been confirmed, with a Cronbach α and split-half reliability coefficients of 0.917 and 0.831, respectively.23
Lifestyle evaluation
The Chinese version of HPLP-II is a translation from the English undertaken by Yen15; it is a revised 52-item instrument that includes six dimensions: ‘health responsibility’ (nine items), ‘physical activity’ (eight items), ‘nutrition’ (nine items), ‘spiritual growth’ (nine items), ‘interpersonal relations’ (nine items) and ‘stress management’ (eight items). The names of three of the six original dimensions have been altered (thus, ‘self-actualisation’ has been altered to ‘spiritual growth’, ‘interpersonal support’ to ‘interpersonal relations’ and ‘exercise’ to ‘physical activity’).15 Respondents were asked to report their behaviours on a four-point Likert scale (1=never, 2=sometimes, 3=often and 4=routinely). Following the recommendations of the original authors of the scale, the overall HPLP-II score was obtained by calculating the mean of the responses to all 52 items. HPLP-II scores therefore ranged between 52 and 208. The health-promoting lifestyle scores were divided into four levels: 52–90 designated ‘poor’, 91–129 ‘moderate’, 130–168 ‘good’ and 169–208 ‘excellent’. Higher scores indicated a greater frequency of health-promoting behaviours.
Statistical analyses
Data are reported as the mean ±SD for continuous variables, or as frequencies in the case of categorical variables. Descriptive statistics and univariate analyses were carried out using SPSS V13.0 (SPSS Inc, Chicago, Illinois, USA). Pearson χ2 tests and independent-sample t tests were used to compare the independent variables versus dependent variables, and the corresponding 95% CIs were calculated. p Value <0.05 was considered to be significant for all tests.
Results
A total of 12 429 questionnaires (including requests for sociodemographic information, and the documents HPLP-II and SHMS V1.0) were distributed during the study period, and 11 144 completed responses were received (a response rate of 89.66%).
Lifestyle condition by gender
A total of 11 144 students aged 18–26 years (mean age 20.70 years, SD=1.58) were analysed. There were 4780 men and 6363 women. Table 2 shows the Student' t test results of different levels of HPLP-II by gender. The numbers of students at the ‘poor’, ‘moderate’, ‘good’ and ‘excellent’ levels were 309, 5814, 4587 and 434, respectively. Most students reported ‘moderate’ or ‘good’ lifestyles. There were significant differences between men and women at the ‘poor’, ‘moderate’ and ‘good’ levels, but no significant difference at the ‘excellent’ level. The mean scores for women at the ‘poor’ and ‘moderate’ levels were higher than the corresponding scores for men, and the mean scores for women at the ‘good’ and ‘excellent’ levels were lower than those calculated for men (p=0.000).
Lifestyle condition by gender
Overall student health status
A total of 11 144 students were evaluated, and the numbers of students in the ‘healthy’, ‘SHS’ and ‘disease’ groups were 2542, 6234 and 2368, respectively. The prevalence rate of SHS was 55.9% (6234). The major diseases that were reported affected the respiratory and digestive systems, such as chronic rhinitis (1074), chronic gastritis (320), chronic pharyngitis (317), piles (109), chronic bronchitis (76) and gastroduodenal ulcer (75). The mean scores and SD values for the individual dimensions of SHMS V1.0, and for the SHMS V1.0 data overall, are shown in table 3. There were significant differences between the ‘healthy’, ‘SHS’ and ‘disease’ groups with respect to the physiological, psychological and society dimensions (p=0.000). The mean scores of the participants in the ‘healthy’ group were significantly higher than those of the participants in the ‘SHS’ and ‘disease’ groups (p=0.000).
SHMS V1.0 scores by health status
The number of men in the ‘healthy’, ‘SHS’ and ‘disease’ groups were 1169, 2698 and 913, whereas the number of women were 1373, 3536 and 1454, respectively. The mean scores for the individual dimensions of SHMS V1.0 were higher in men than in women (table 3); and there were statistically significant differences between men and women (p=0.000). The results suggest that the health status of female students is poorer than that of their male counterparts.
The health status of students by HPLP-II level
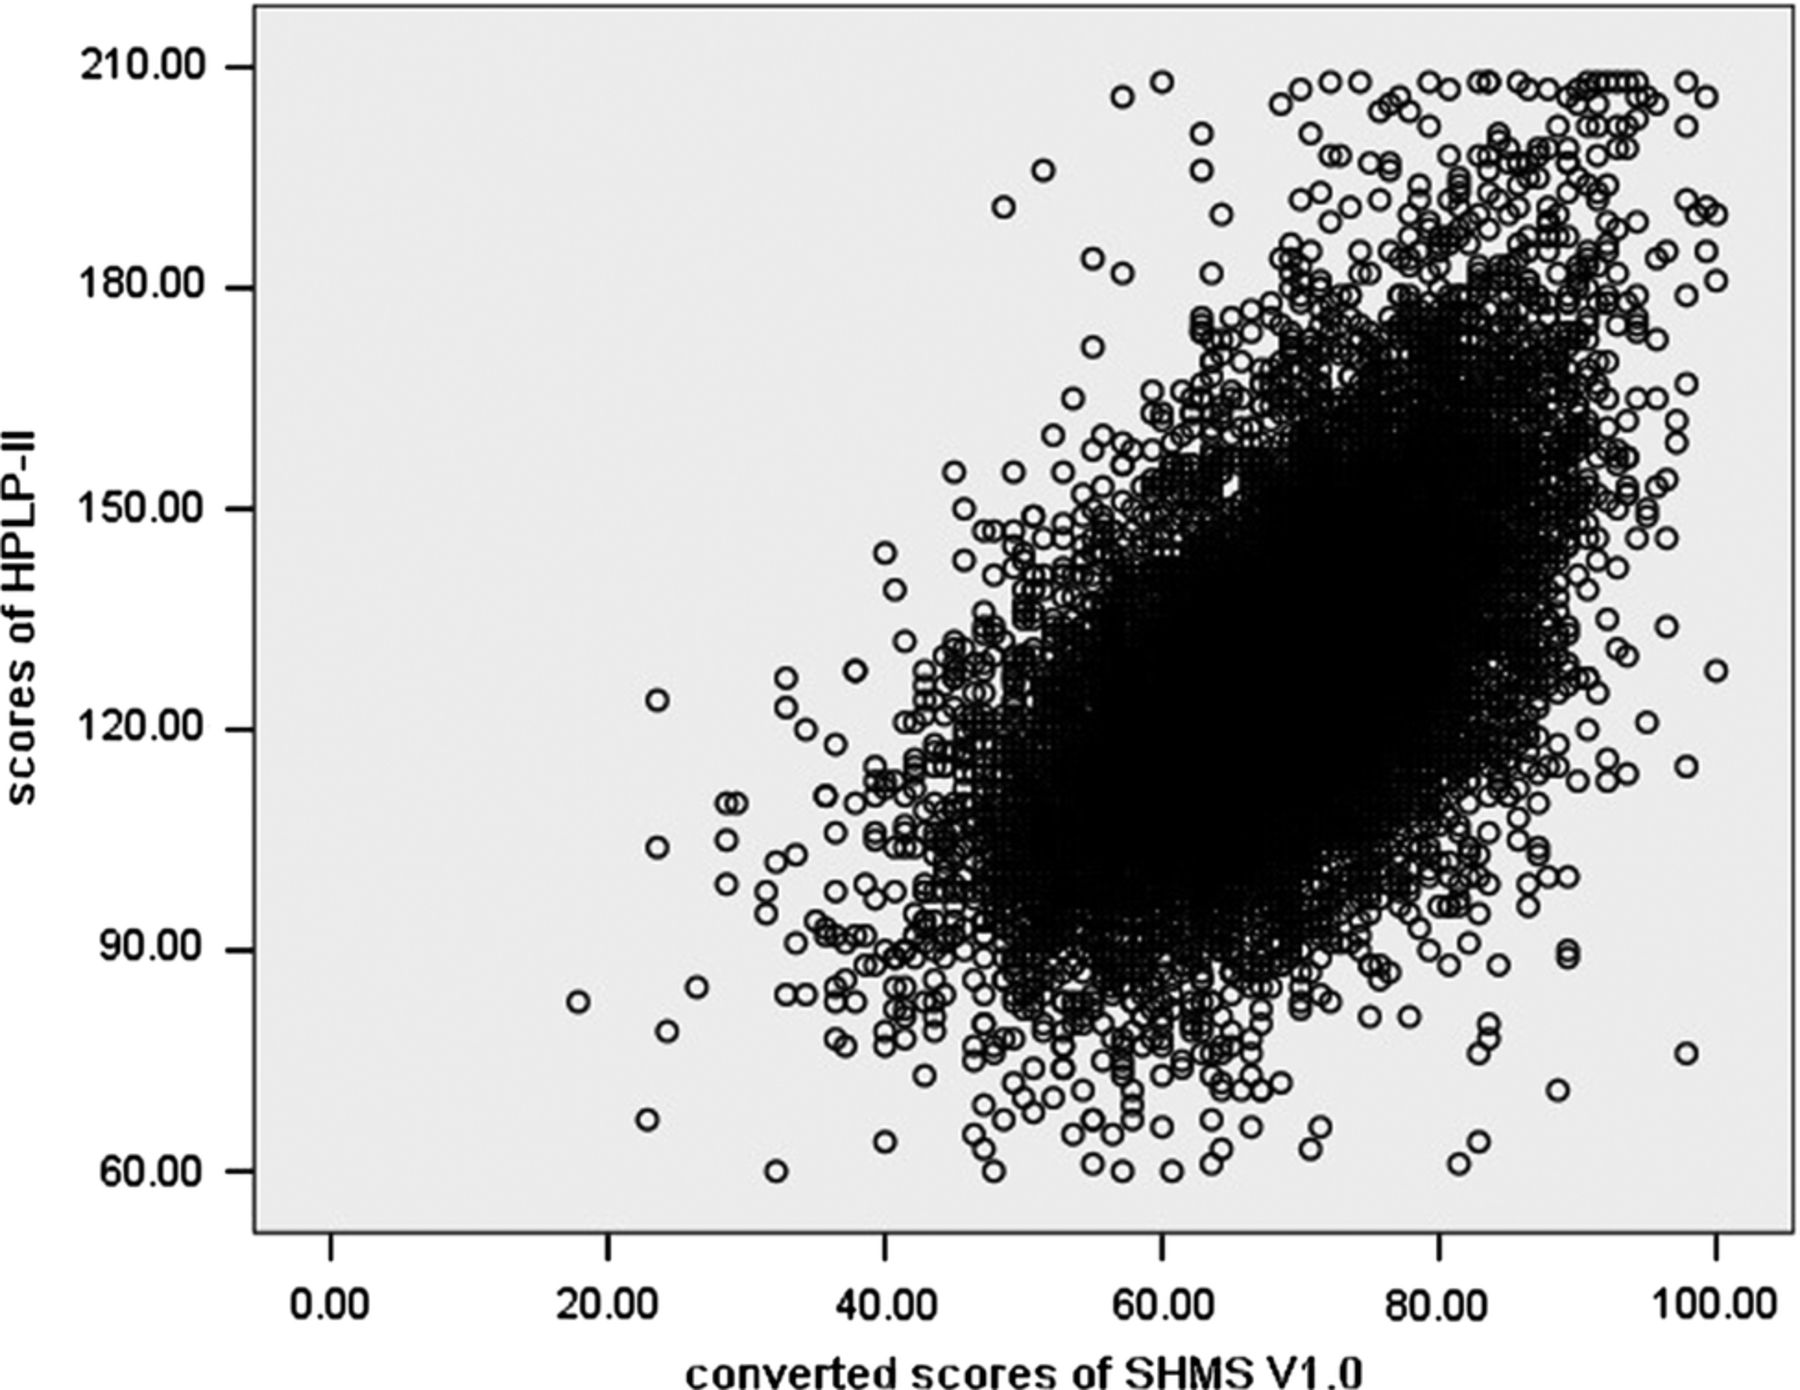
As shown in table 4, the mean scores as determined using SHMS V1.0 increased in line with the transition from the ‘poor’ level to the ‘excellent’ level according to HPLP-II; they were significantly positively correlated (Spearman's r=0.563, p=0.000; figure 1). The statistics in table 5 show that most students at the ‘good’ HPLP-II level were ‘healthy’ students, while those at the ‘moderate’ HPLP-II level were in the ‘SHS’ and ‘disease’ categories, and this difference was statistically significant (χ2=1640.444, p=0.000).
SHMS V1.0 scores for each HPLP-II level
Frequencies of health status categories, for each HPLP-II level

Scatter plot of Sub-Health Measurement Scale (SHMS) V1.0 scores and Health Promoting Lifestyle Profile (HPLP)-II scores.
Comparative analysis of HPLP-II scores by health status
Table 6 shows the mean score and SD for each HPLP-II dimension. There were statistically significant differences between the ‘healthy’, ‘SHS’ and ‘disease’ groups (p=0.000). For each of the HPLP-II dimensions, the mean scores for the ‘SHS’ and ‘disease’ groups were lower than those for the ‘healthy’ group, indicating that students in the two former groups had poorer lifestyles.
Scores for each HPLP-II dimension, according to health status
Logistic regression analysis of SHS and lifestyle
Table 7 shows the regression analysis parameter estimates and SEs for lifestyle and health and SHS. For HPLP-II, five of the dimensions (‘spiritual growth’, ‘health responsibility’, ‘physical activity’, ‘interpersonal relations’ and ‘stress management’) were entered into the stepwise regression equation.
Stepwise regression variables
Discussion
The aim of this study was to examine the relationship between health status and lifestyles so as to obtain a more complete profile of the well-being of students and to identify more effective intervention measures. We found that the prevalence rate of SHS was 55.9% (6234/11 494). This result is similar to other reports from China.24 ,25 Most students reported a ‘moderate’ lifestyle. Notably, health status was significantly positively correlated with lifestyle (r=0.563). The mean values for the ‘SHS’ and ‘disease’ groups were lower than those for the ‘healthy’ group for every dimension of the HPLP-II model. Our findings also revealed that ‘physical activity’, ‘health responsibility’, ‘spiritual growth’, ‘interpersonal relations’ and ‘stress management’ are all related to SHS.
In 1946, the WHO defined health in its broader sense as “a state of complete physical, mental, and social well-being and not merely the absence of disease or infirmity.”26 With greater understanding of health, the definition has deepened to take account of SHS, which is an intermediate state between disease and health, as proposed by Wang.1 ,3 ,27 Prevention and intervention strategies aimed at SHS are similar to the concept of preventive, predictive and personalised medicine, which is an effective approach to the improvement of health, the prevention of disease and the treatment of early-stage illness.1 ,3 The results presented in this study revealed that the prevalence rate of SHS was high (55.9%). Although the prevalence of suboptimal health is high, there has been a lack of objective clinical diagnostics for SHS. A number of SHS questionnaires have been established and evaluated in China, such as Suboptimal Health Status Questionnaire (SHSQ)-25 and Multidimensional Sub-health Questionnaire of Adolescents (MSQA)20 ,28; however, Suboptimal Health Status Questionnaire (SHSQ)-25 is targeted at physiological and psychological SHS and MSQA is aimed at adolescents. SHMS V1.0, on the other hand, is a multidimensional questionnaire that includes physiological, psychological and social dimensions.23 As they enter young adulthood, a number of students appear with physical, psychological and social problems; hence, SHMS V1.0 is very suitable for the assessment of the health status of students.
Unhealthy behaviours and lifestyles are two important factors that are associated with 10 major causes of death.8–11 Lifestyle is reportedly associated with increased risks of gastroduodenal ulcer,29 chronic rhinitis,30 obesity,31 neck cancer,32 breast cancer33 and coronary heart disease,34 and ‘lifestyle diseases’ are an increasing threat to health. Comprehensive lifestyle changes may have therapeutic potential in early cancers,35 diabetes36 and stroke.37 The findings of the present study suggested that students affected by disease had poor lifestyles. The types of diseases in question largely affected the respiratory and digestive systems, which are closely related to lifestyle.30 ,31 There are therefore opportunities for individuals to make changes to poor lifestyle factors and to improve their health status as a result.
Previous studies have proposed that SHS may be related to poor lifestyle factors, such as going to bed late, work-related and study-related stress, physical inactivity and poor diet.1 ,7 ,19–22 ,38 This study was designed to assess the relationship between lifestyle and health status. The statistical analysis revealed that health status was significantly positively correlated with lifestyle. SHS and disease students reported poor lifestyles. Lifestyle factors affect a range of aspects of health status—physiological, psychological and social. Within the framework of HPLP-II, ‘physical activity’ and ‘nutrition’ may affect physiological health, ‘spiritual growth’ and ‘stress management’ influence psychological health and interpersonal relations impact on social health. In addition, our results (tables 3 and 6) indicated that the SHMS V1.0 and HPLP-II scores for the ‘SHS group’ were generally lower than those for the other two groups (‘healthy’ and ‘disease’). Students affected by diseases may worry about their health status and do their best to improve the symptoms and physical signs. They may change their lifestyle, exercise more and actively treat the disease, which can improve their health status. SHS students, on the other hand, do not pay increased attention to their lifestyle, which as a result continues to harm their health. Most generally, due to heavy study loads and anxiety, most students do not eat regularly, get sufficient sleep or exercise adequately; and as a result, they may suffer from headaches, insomnia, fatigue and forgetfulness. It is therefore important to focus attention on SHS and lifestyle factors that threaten the health of young people.
Our study also revealed that men and women show significant differences in lifestyle as well as health status. Men and women have different morphological, physiological, metabolic and genetic characteristics. It is reported that women are more prone to depression, anxiety and other neuropsychiatric disorders.39 ,40 This may be because women are more influenced by pressure, and by their surroundings and experiences, which might make them more prone to SHS.
Poor lifestyle is detrimental to personal health. The current health status of today's students may provide an insight into their likely performance as professional workers in the future. Therefore, an understanding of the variables that can affect the health profiles of students warrants serious attention.⇓

Sub -Health Measurement Scale V1.0
Conclusion
Health status is significantly positively correlated with lifestyle. Poor lifestyle is a risk factor for SHS. Conversely, adopting a healthier lifestyle can improve SHS.
Limitations
Some limitations should be noted. First, this was a cross-sectional design, which did not allow us to assess causality or the directionality of relationships. Second, all information was obtained from self-reported questionnaires, which could result in potential information bias. Multiple assessments and informants may provide a richer and more thorough understanding of SHS.
Acknowledgments
The Charlesworth Author Services Team edited the manuscript. The authors thank for their English editing and polishing services.
References
Footnotes
JB and YH contributed equally to this work.
-
Contributors RL and XZ were involved in study concept and design, critical revision of the manuscript for important intellectual content and study supervision. JB, YH, YX, JC, FL, TW, JC, LW and YL were involved in acquisition of data. JB and YH were involved in analysis and interpretation of data and drafting of the manuscript. All authors were involved in the formulation of the research questions.
-
Funding This work was supported by the NSFC-Guangdong joint fund (No. U1132001), the National Science Foundation of China (Nos. 81173146 and 81373707), the Natural Science Foundation of Guangdong Province, China (Nos. S2012010009177 and S2011010002941), the Guangdong Provincial Department of Science and Technology and Guangdong Provincial Academy of Traditional Chinese Medicine joint fund (Nos. 2011B032200004 and 2012A032500004), the Guangdong Provincial Department of Science and Technology fund (Nos. 2011B031700018) and the Science and Technical Plan of Guangzhou, Guangdong, China (No. 2011J4300108).
-
Competing interests None.
-
Patient consent Obtained.
-
Ethics approval Ethics Committee of Nanfang Hospital in Guangzhou, China (2012) LunShenZi (No. 035).
-
Provenance and peer review Not commissioned; externally peer reviewed.
-
Data sharing statement No additional data are available.