Article Text

Abstract
Objectives We developed an outcome indicator based on the finding that complications often prolong the patient's hospital stay. A higher percentage of patients with an unexpectedly long length of stay (UL-LOS) compared to the national average may indicate shortcomings in patient safety. We explored the utility of the UL-LOS indicator.
Setting We used data of 61 Dutch hospitals. In total these hospitals had 1 400 000 clinical discharges in 2011.
Participants The indicator is based on the percentage of patients with a prolonged length of stay of more than 50% of the expected length of stay and calculated among survivors.
Interventions No interventions were made.
Outcome measures The outcome measures were the variability of the indicator across hospitals, the stability over time, the correlation between the UL-LOS and standardised mortality and the influence on the indicator of hospitals that did have problems discharging their patients to other health services such as nursing homes.
Results In order to compare hospitals properly the expected length of stay was computed based on comparison with benchmark populations. The standardisation was based on patients’ age, primary diagnosis and main procedure. The UL-LOS indicator showed considerable variability between the Dutch hospitals: from 8.6% to 20.1% in 2011. The outcomes had relatively small CIs since they were based on large numbers of patients. The stability of the indicator over time was quite high. The indicator had a significant positive correlation with the standardised mortality (r=0.44 (p<0.001)), and no significant correlation with the percentage of patients that was discharged to other facilities than other hospitals and home (r=−0.15 (p>0.05)).
Conclusions The UL-LOS indicator is a useful addition to other patient safety indicators by revealing variation between hospitals and areas of possible patient safety improvement.
This is an Open Access article distributed in accordance with the Creative Commons Attribution Non Commercial (CC BY-NC 3.0) license, which permits others to distribute, remix, adapt, build upon this work non-commercially, and license their derivative works on different terms, provided the original work is properly cited and the use is non-commercial. See: http://creativecommons.org/licenses/by-nc/3.0/
Statistics from Altmetric.com
Strengths and limitations of this study
-
This study provides a hospital-wide indicator that can be used in addition to mortality and readmission rates in order to identify potential safety risks.
-
The current indicator adjusts for differences in age, principal diagnosis and procedures. But there are probably more variables involved in a prolonged hospital stay.
-
The indicator currently ‘counts’ all patients from whom the actual length of stay exceeds the expected duration by 50% or more. It needs to be studied whether this cut-off point can be set separately for each patient group.
Background
For about 10 years, improving quality of care based on outcome indicators is seen as an essential component in optimising safety in healthcare. In the Netherlands, like in many other countries, a large number of indicators have been developed and introduced to monitor the quality and safety of hospital care.1–3 Many of these indicators concern a specific patient group. There are also some general quality indicators that concern the whole hospital. The most important ones are: unexpectedly long length of stay (UL-LOS); unplanned readmissions and higher than expected mortality (measured by the Hospital Standardised Mortality Rate, HSMR).
According to the Dutch Healthcare Inspectorate (IGZ) these are especially of interest for identifying general patient safety risks in hospital care. It is important to measure all three indicators since a degree of substitution—or competition—between them is possible. For example, if a hospital tries to discharge patients too quickly, this policy could result in a higher percentage of unplanned readmissions. The indicator for unplanned readmissions, already used in several countries such as the UK and the USA,4–7 is not yet available in the Netherlands. The HSMR has already been available in Dutch hospitals since 2006.8
The UL-LOS did not exist until some years ago the IGZ was looking for more general patient safety indicators. Research shows that hospital adverse events often result in a longer length of stay.9–22 In several other studies on adverse events, a long length of stay was used as an important trigger for selecting medical records.23–25 So, if complications often prolong the patient's hospital stay, could an outcome indicator be developed such as the percentage of patients with a UL-LOS compared to the national average? Such an outcome may indicate shortcomings in the quality or safety of care delivered by the hospital.
As far back as 1999, Silber et al26 had already published research about an indicator called ‘conditional length of stay’. This was based on length of stay data and took into account the fact that patient stays tend to become prolonged after complications. They developed this indicator by testing if length of stay distributions display an ‘extended’ pattern of decreasing hazards after a transition point. This would suggest that ‘the longer a patient has stayed in the hospital, the longer a patient will likely stay in the hospital’. Or, alternatively, there is the possibility that ‘the longer a patient has stayed in the hospital, the faster a patient will likely be discharged from the hospital’.
On the basis of these former ideas, the IGZ decided to introduce such an indicator of prolonged length of stay. In the current paper we explore the utility of this indicator by measuring the variability of the indicator across hospitals and the stability over time. We also examine the correlation between the two existing indicators of the model: the UL-LOS and the HSMR, as they are both supposed to be an indicator of risk of unsafe care. The HSMR focuses by definition on adverse events leading to hospital mortality. The UL-LOS is calculated among survivors and involves a much wider range of adverse events. It includes all adverse events leading to a substantial prolonged length of stay. We expected a positive relationship between the two indicators, as reduced quality of care leads to more adverse events, and more adverse events lead to more patients with prolonged hospitalisation as well as to more deaths.
Methods
Data
To calculate the UL-LOS we used data that were routinely registered for administrative purposes. Using an existing registration minimalises extra registration burden. These databases can be used to predict risks with similar discrimination to clinical databases.27 The National Medical Registration (LMR) has already been existing for 50 years in the Netherlands and contains data of hospital admissions including medical data such as diagnosis and surgical procedures as well as patient-specific data such as age and hospital stay.28 For the UL-LOS we especially used the variable ‘expected length of stay’, which is generated by indirect standardisation based on the following three patient characteristics, which are the most important characteristics for standardisation of length of stay data29:
-
Age: divided into five categories: 0, 1–14, 15–44, 45–64, 65+ years.
-
Primary diagnosis: this is the main diagnosis that led to the admission; it includes about 1000 diagnoses classified by the ICD9 in three digits.
-
Morbidity group: morbidity groups mainly divide patients with or without procedures. For patients with procedures the morbidity groups are made by unique combinations of a diagnosis and one or more procedures. On average it includes five procedure groups. Procedures are classified by the Dutch Classification System of Procedures.
Together these three parameters produced 5×1000×5=25 000 cells. Every year the national mean length of stay of each cell is taken as the expected length of stay for the patients with characteristics that belong to the same cell.
Definition
We used the expected length of stay to define an outcome indicator that suited the purpose of identifying adverse events. We used former research to choose a single cut-off percentage prolonged length of stay across all diagnoses and case mixes to distinguish between ‘normal’ variation in length of stay and variation in hospital stay that might be caused by complications and other patient safety issues.30 In literature we found the use of a threshold of 75%,31 ,32 which in fact was arbitrarily chosen. We formulated the indicator ‘UL-LOS’ as the percentage of clinically admitted patients with an actual hospital stay that was more than 50% longer than expected.2 We excluded from this indicator patients who died in hospital. We excluded these patients because of the interrelationship between length of stay and mortality which makes it difficult to interpret length of stay data if non-survivors are included.33
We used a threshold of 50% for two reasons:
-
We especially wanted to include patients who stayed longer because of complications and adverse events, and not patients who just stayed a little bit longer in hospital because of variations in efficiency (see figure 1). The percentage should not be too small.
-
We analysed for the Netherlands the percentages of patients with a longer than expected length of stay for 10 different threshold groups between 0% and 100%. We found that the percentages after the threshold of 50% seem to dip beneath 2% (see online supplementary annex 1).

Components of length of stay (LOS); UL-LOS, unexpectedly long length of stay.
In combination with our first experiences with case studies that showed that the number of adverse events clearly increased from a longer than expected length of stay of 50% or more,30 we decided to use the threshold of 50% in order not to exclude too many patients with adverse events. In fact the threshold depends on what specificity or what false-positive rates you are willing to accept. With a threshold of 50% we expect to find a higher number of adverse events than with a threshold of 75%, but we expect the proportion of adverse events will be lower. A higher threshold would mean more efficiency in finding adverse events.
Sample
We selected hospitals for which the indicator could be calculated. Hospitals had to participate in the LMR not only by registration of the diagnoses of clinical patients but also the procedures. For our study, we used data from the year 2011 of 61 of all 90 Dutch hospitals:
-
Six hospitals were excluded because they did not participate at all.
-
Five hospitals were excluded because they participated for less than 50% of the year. The group of 79 hospitals after this step consisted of 73 hospitals that participated the whole year, 4 hospitals participating for 50–60% of the year and 2 hospitals participating for 70–80% of the year. All these six hospitals participating for 50–80% coded at least 6 months sequentially.
-
Eighteen hospitals were excluded because they did not register the procedures in the LMR. Among these hospitals were general and tertiary teaching hospitals, and they did not differ in size or region from the hospitals that could be included in the study.
See the flow chart in figure 2.

Flow chart hospitals in correlation study between unexpectedly long length of stay (UL-LOS) and Hospital Standardised Mortality Rate (HSMR) for the year 2011; LMR, National Medical Registration.
To optimise the comparability of hospitals, we stratified the sample into three groups: 32 general hospitals, 21 tertiary teaching hospitals (TTHs) and 8 university medical centres (UMCs). Within these groups, size, degree of specialisation, financing system and complexity of patients are comparable.34–36
Analyses
To explore the utility of the indicator, we measured the variability of the indicator across hospitals and the stability over time. To find out whether the indicator is stable over time, we determined the correlation between the percentages per hospital in ‘2008 and 2009’, ‘2009 and 2010’, ‘2010 and 2011’ and ‘2008 and 2011’.
In order to analyse whether the indicator could identify risks of unsafe care, we correlated the results of the UL-LOS with the HSMRs for the year 2011. Therefore we calculated the Pearson correlations and the two-tailed significance between the UL-LOS and the HSMRs. The HSMR consists of the quotients of observed mortality and expected mortality in 50 diagnostic groups (Clinical Classification System; CCS) in which 80% of all hospital mortality took place. The expected mortality was based on the following characteristics of the patients: age, sex, CCS-subgroup, comorbidity (Charlson index), urgency, social deprivation, source organisation type, month and year.
As with the UL-LOS, the HSMR could only be calculated for hospitals that participated in the LMR. Some additional criteria were used in order to optimise the reliability of the standardisation. To be included in the HSMR, hospitals had to:
-
Avoid the use of vague diagnostic codes (this had to be less than 2% of the admissions);
-
Perform an adequate registration of the urgency of the admission (more than 30% of the admissions had to be marked as urgent);
-
Perform an adequate registration of the comorbidity of patients (the mean number of secondary diagnosis per admission had to be more than 0.5).
In addition, the HSMR had to count for more than 70% of all deaths in hospital, and the hospital had to have more than 50 expected deaths per year. All these additional criteria resulted in 58 hospitals remaining for our correlation study between UL-LOS and HSMR for the year 2011, see the flow chart in figure 2.
We investigated whether the UL-LOS indicator (and the HSMR) might be influenced by hospitals that, for local resource reasons, do not have as much access to nursing home beds, home care support, palliative care or hospices, and thus keep more of these patients in the hospital rather than discharging them to stay or die elsewhere. We addressed this by two different analyses:
-
We calculated the percentage of patients discharged to other facilities than other hospitals and home. This percentage approximately gives the extent to which hospitals are able to discharge patients for long-term or palliative care.
-
We re-ran the analysis restricted to diagnostic categories where most patients are discharged home without a diagnosis for which one might expect a palliative approach. To select this group, we excluded all CCS groups37 with carcinoma.
Results
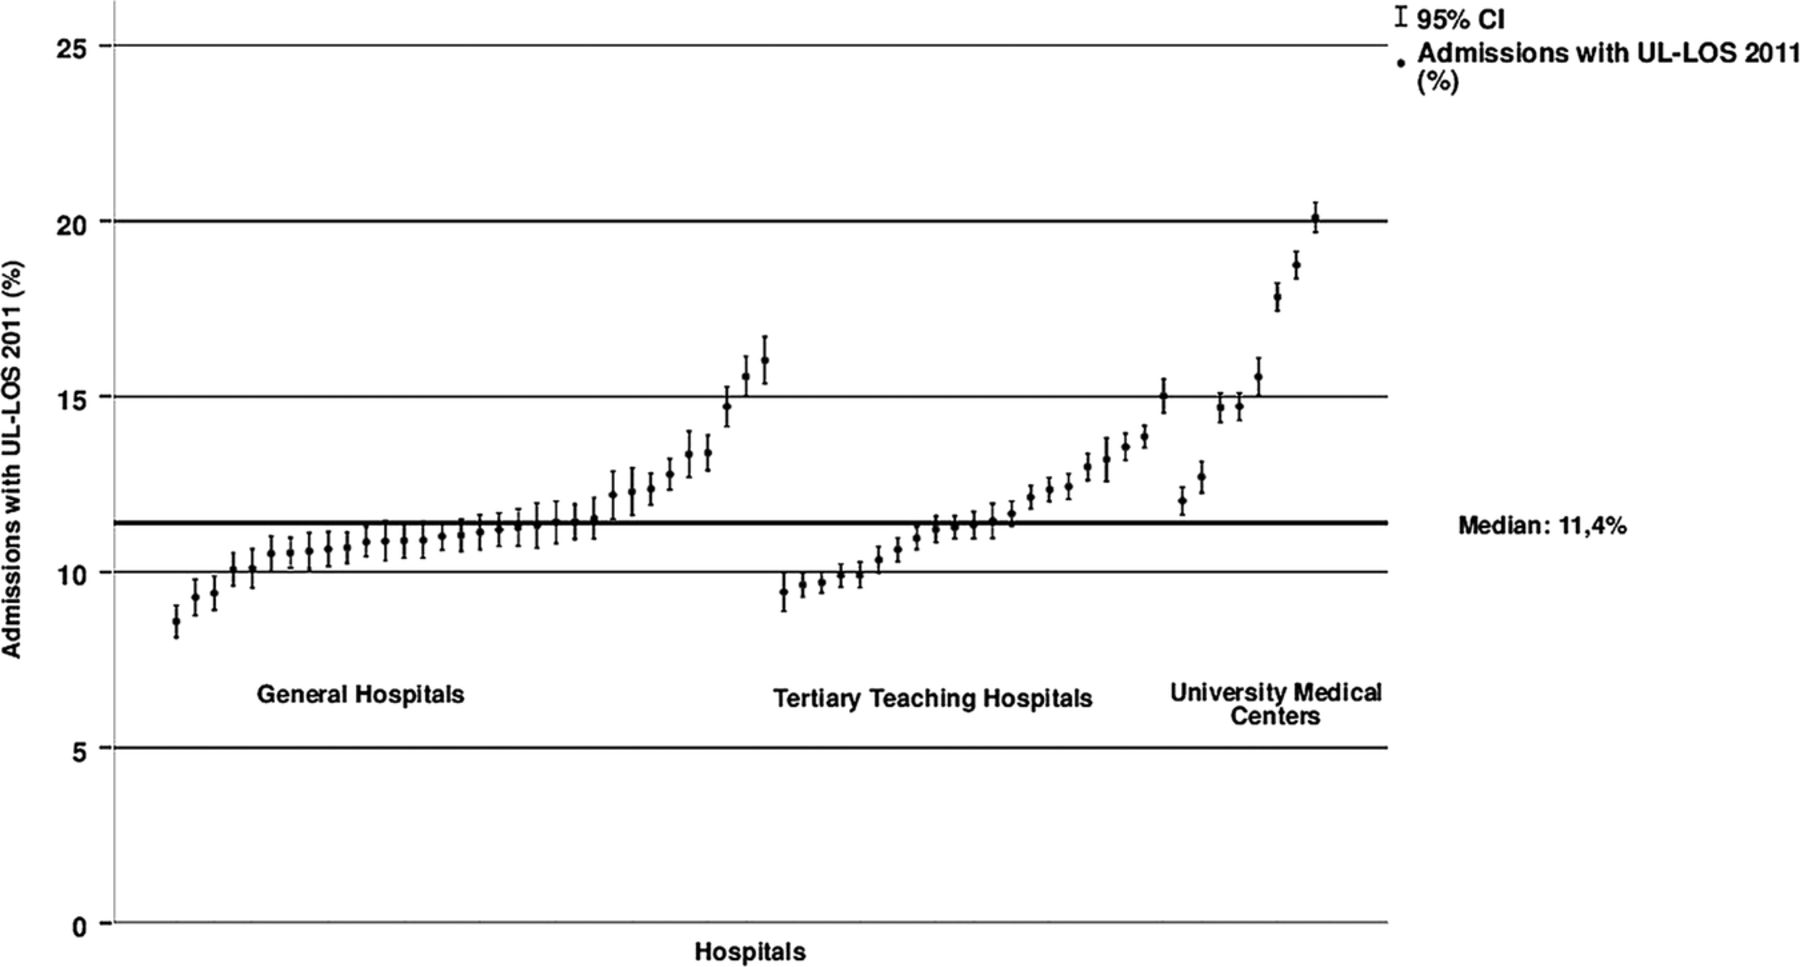
In figure 3 the percentage of UL-LOS is given for the 61 hospitals in our study. The figure also shows the 95% confidence limits. A distinction has been made between general hospitals, TTHs and UMCs. The national median of the percentage of clinical admissions with a UL-LOS was 11.3%. The UMCs had a relatively high score on this indicator compared with the TTHs and general hospitals.

Percentage of admissions with an unexpectedly long length of stay (UL-LOS) for the hospitals in our study, defined by type of hospital: general hospitals (n=32), tertiary teaching hospitals (n=21) and University Medical Centres (n=8); National Medical Registration (LMR) 2011, I=95% CI = admissions with UL-LOS 2011 (%).
For the UMCs the variation of the percentages was between 12% and 20.1%, with a median of 15.1%. The TTHs varied between 9.4% and 15%, with a median of 11.3%. For the general hospitals the variation was between 8.6% and 16%, with a median of 11.1%. With an independent sample t test we found no significant difference between TTHs and general hospitals, t(53)=0.16; p=0.88.
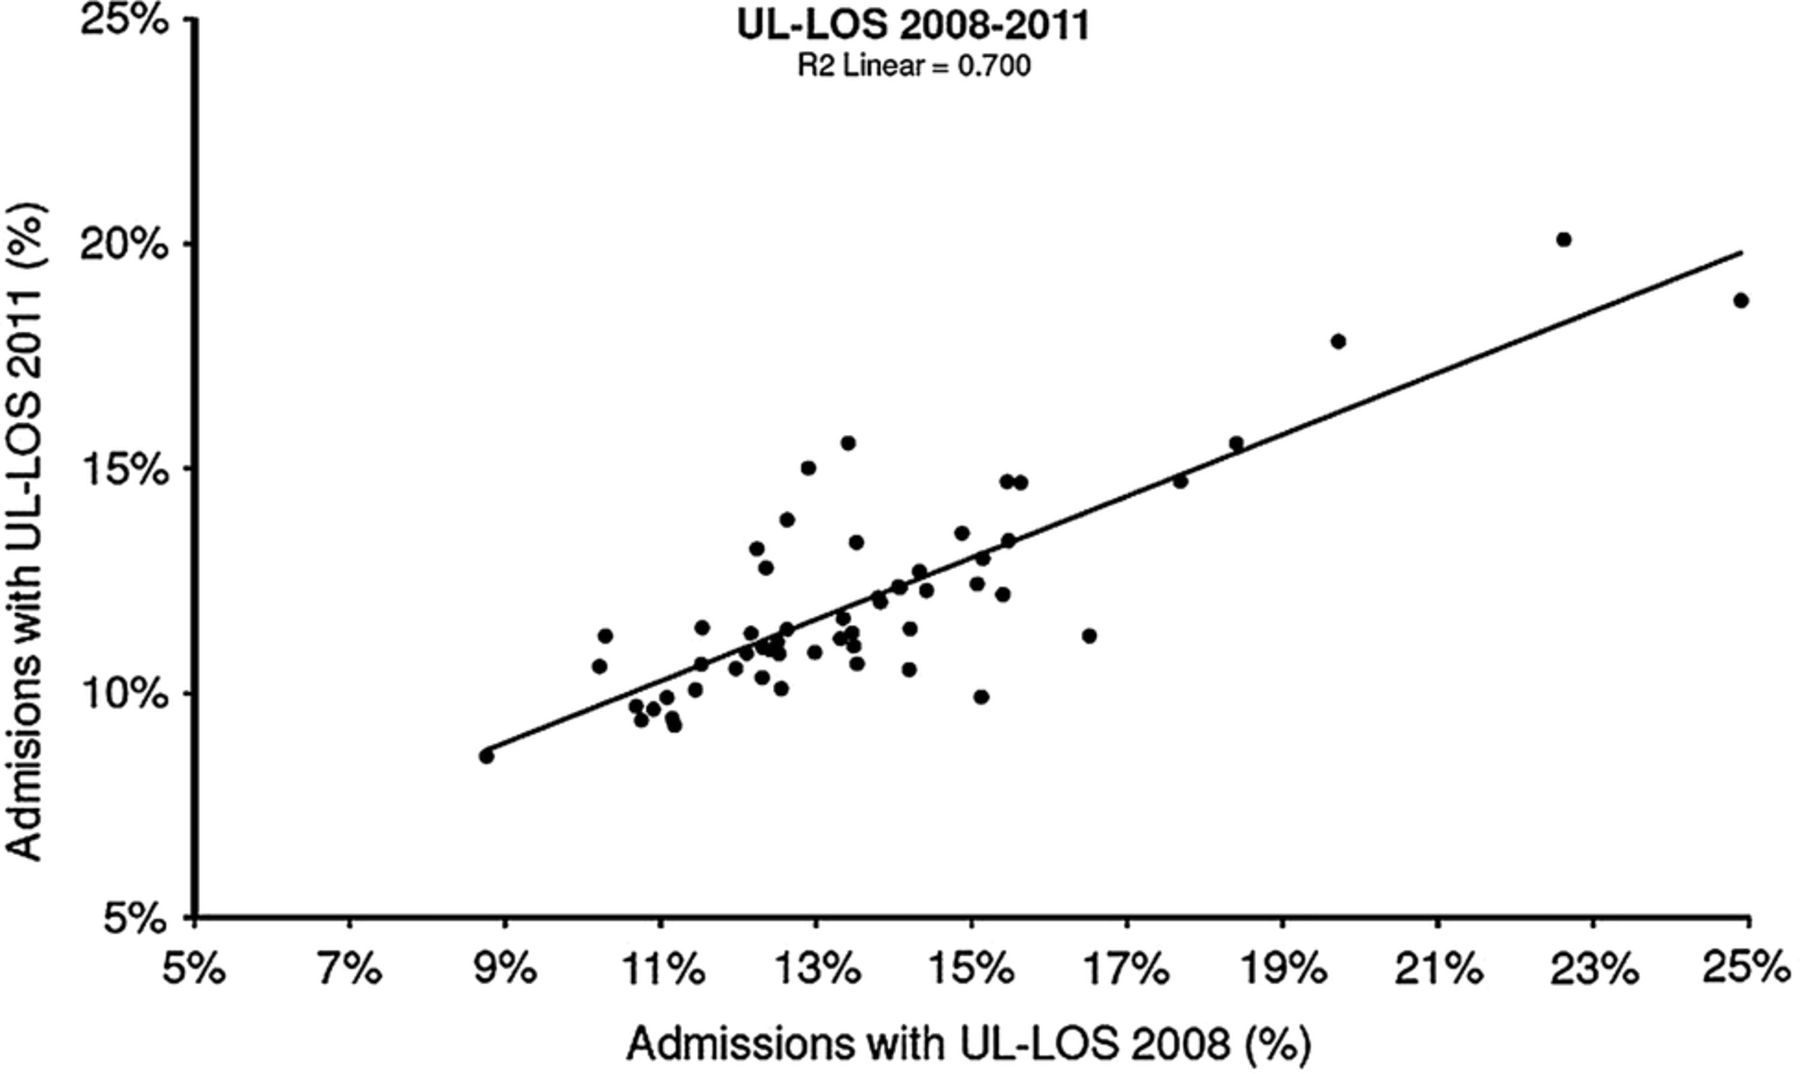
To explore the stability of the indicator, we calculated the correlation of the indicator between two subsequent years. The R2 between 2008 and 2009 was 0.89, between 2009 and 2010 it was 0.86 and between 2010 and 2011 it was 0.90. Figure 4 shows the correlation between 2008 and 2011. The R2 between these years was 0.70.

Correlation between the years 2008 and 2011 for the percentage of admissions with an unexpectedly long length of stay (UL-LOS) per hospital. National Medical Registration (LMR) 2008 and 2011 (n=57).
Table 1 shows for the year 2011 for each hospital the UL-LOS indicator and the HSMR in two ways: with and without patients with carcinoma. This table also shows for each hospital the percentage of patients admitted to other destinations than home or other hospitals. There was no substantial difference in the outcome of the UL-LOS indicator calculated with or without patients with carcinomas. The correlation of the UL-LOS with/without carcinomas was 1.00; correlation of the HSMR with/without carcinomas was 0.96. The Pearson correlation between the UL-LOS indicator and the HSMR with all diagnosis groups was 0.44 (p<0.001) and with carcinoma excluded 0.52 (p<0.001). We found no significant correlation between the UL-LOS indicator and the score on discharging patients. The Pearson correlation between the UL-LOS and discharging palliative patients with all diagnosis groups was −0.15 (p>0.05) and with carcinoma excluded −0.16 (p>0.05).
Sixty-one hospitals with their UL-LOS and HSMR in two ways: with and without patients with carcinoma and the percentage of patients admitted to other destinations than home or other hospital; 2011
Discussion
In this paper, we described the development of a patient safety indicator for Dutch hospitals that, to the best of our knowledge, has not been described in the literature until now. The indicator is defined as the percentage of clinically admitted patients with an actual hospital stay that was more than 50% longer than expected. The indicator showed considerable variability between the Dutch hospitals: from 8.6% to 20.1% in 2011. It also showed serious variation within homogenous groups of hospitals. The stability of the indicator over 3 years was quite high and the indicator had a significant positive correlation with the HSMR. This indicates that the hospitals with more patients with a UL-LOS were also the hospitals with higher standardised mortality. This might support our hypothesis that suboptimal quality of care may both lead to more patients with a UL-LOS as well as to more mortality than expected. More research is needed to determine the validity of the UL-LOS indicator. Especially record reviewing to look for adverse events is needed for a stronger support of our hypothesis. In addition to this an indicator for readmissions should be added to the indicator framework and should be a subject for future research.
The strong correlation between the UL-LOS with and without carcinomas, and the low correlation between UL-LOS and discharging patients, seem to indicate that the UL-LOS is not influenced by differences between hospitals in the ability to admit patients to next care facilities. This might be important for hospitals in realising that high percentages of patients with an UL-LOS will probably not be caused by opportunities of discharging patients.
In terms of evaluation of care it is becoming increasingly common for hospitals to study patient records retrospectively, especially in cases of deceased patients.25 ,26 This indicator might be a good research tool to identify records of patients who were discharged alive. This could lead to opportunities for improvements that are different from those based on patient record-reviewing after death.
The indicator provides insight into the percentage of patients that stayed at least 50% longer than expected. The assumption is that in this group a relatively large number of patients have had to deal with unexpected developments in their disease, resulting in complications that cause a prolonged stay. It could be much more effective for hospitals to review records of hospital admissions selected by this indicator compared to randomly selected patient records. Reviewing records takes considerable time and by using this indicator for selection, time could be saved by reviewing fewer records from which more lessons might be learnt.30
Hospital management might also have financial reasons to be interested in the indicator in addition to the quality and safety aspects of the UL-LOS indicator. Having a longer than expected length of stay, costs money in the present Dutch financing system. Although the indicator is not developed for financial purposes, the use of the indicator may, as a beneficial side effect, also reduce the total amount of hospital days.
There are two main limitations to this study.
-
Some hospitals, especially the UMCs, differed from the national median. The high score for the UMCs could indicate that there is insufficient adjustment for the specific patient categories admitted to the UMCs. The current indicator adjusts for differences in age, principal diagnosis and procedures. But there are probably more variables involved in a prolonged hospital stay. The case mix adjustment is more limited than for example the HSMR. Further research is needed to determine which other patient characteristics, for example, comorbidity, play a significant role in a prolonged length of stay and whether they are of added value in standardising hospital stay next to the present cofounders.
-
We used a threshold of a length of stay of 50% longer than expected for the indicator. This threshold was based on the three aforementioned reasons and especially our first experiences with reviewing hospital records based on length of stay.30 However, there is no evidence that the threshold has to be exactly 50%. A more detailed study is needed to determine the appropriateness of this threshold. Further research is also needed to determine to what extent the proportion of patients which crosses the threshold can vary for each combination of age, main diagnosis and procedure. If the variations between hospitals are large, and the case mix clearly differs, this will present a number of unequal opportunities that will result in crossing the 50% threshold. We might need to vary the threshold for different diagnostic groups.
Conclusion
The IGZ introduced the outcome indicator ‘percentage of patients with a UL-LOS’ for its supervision since 2010. It is based on the assumption that complications often prolong the patient's hospital stay. A higher percentage of patients with a UL-LOS compared to the national average, after a correction is made for case mix variations, may indicate shortcomings in the quality or safety of care delivered by the hospital. The indicator currently ‘counts’ all patients for whom the actual length of stay exceeds the expected duration by 50% or more. It needs to be studied whether this cut-off point can be set separately for each patient group. The indicator varies systematically between hospitals and is rather stable over time. It correlates with other outcome indicators, which could indicate the capacity to identify opportunities for improvement of patient safety.
References
Supplementary materials
Supplementary Data
This web only file has been produced by the BMJ Publishing Group from an electronic file supplied by the author(s) and has not been edited for content.
Files in this Data Supplement:
- Data supplement 1 - Online supplement
Footnotes
-
Contributors IB designed the study, performed the analysis, interpreted the results and drafted the manuscript. KDH and SC contributed to the analysis and the interpretation of the results. RBK, LdO and JV helped to interpret the results and contributed to the discussion. RBK and GPW supervised the study and participated in the formulation of the discussion. All authors reviewed and edited the manuscript for intellectual content. All authors read and approved the final manuscript.
-
Funding This research received no specific grant from any funding agency in the public, commercial or not-for-profit sectors.
-
Competing interests None.
-
Provenance and peer review Not commissioned; externally peer reviewed.
-
Data sharing statement No additional data are available.