Article Text

Abstract
Objective To determine the prevalence of (very) low food security among Dutch food bank recipients, and to identify potential demographic, lifestyle and nutrition-related factors associated with (very) low food security.
Setting 11 of 135 Dutch food banks were selected throughout the Netherlands.
Participants 251 Dutch food bank recipients participated in the study (93 men and 158 women). Inclusion criteria for participation were: (1) at least 18 years of age, (2) sufficiently fluent in Dutch to participate in oral and written interviews, (3) recipient of a Dutch food bank for at least 1 month and (4) collect own food parcel at the food bank. A single member per household was included.
Primary outcome Level of food security.
Results The prevalence of food insecurity was 72.9% (N=183), of which 40.4% (N=74) reported very low food security. Of the very low food secure participants, 56.8% (N=42) reported they were ever hungry but did not eat because they could not afford enough food in the previous 3 months. Adjusted multinomial logistic regression analyses showed that households without children were less likely to experience low food security (OR 0.39 (95% CI 0.18 to 0.88)) and men (OR 0.24 (95% CI 0.11 to 0.51)) were less likely to experience very low food security, while low-educated recipients (OR 5.05 (95% CI 1.37 to 18.61)) were more likely to experience very low food security. Furthermore, recipients with high satisfaction with overall food intake (OR 0.46 (95% CI 0.27 to 0.78)), high perceived healthiness of overall food intake (OR 0.34 (95% CI 0.19 to 0.62)) or high self-efficacy of eating healthy (OR 0.62 (95% CI 0.40 to 0.96)) were less likely to experience very low food security.
Conclusions Our study showed high prevalence rates of food insecurity among Dutch food bank recipients, and identified subgroups at increased risk of food insecurity. More research is urgently needed on the underlying determinants of food insecurity and the effectiveness of food assistance by food banks.
This is an Open Access article distributed in accordance with the Creative Commons Attribution Non Commercial (CC BY-NC 3.0) license, which permits others to distribute, remix, adapt, build upon this work non-commercially, and license their derivative works on different terms, provided the original work is properly cited and the use is non-commercial. See: http://creativecommons.org/licenses/by-nc/3.0/
Statistics from Altmetric.com
Strengths and limitations of this study
-
Our study among 251 Dutch food bank recipients from 11 food banks throughout the Netherlands is the first study addressing food insecurity in the Netherlands.
-
A unique aspect of this study is the identification of demographic, lifestyle and nutrition-related factors associated with food insecurity. In Europe, this has only been studied among low-income persons in the UK so far.
-
A possible limitation of our study is its cross-sectional design which makes it impossible to draw any causal conclusions regarding the factors associated with food insecurity.
-
We were not able to adjust for the number of items, or for the total amount of calories in the food parcel because all food banks and parcels are unique (eg, different options for self-selection and/or the exchange of products).
-
Of the 368 recipients who signed up 251 recipients (68.2%) participated in our study. This and the selection of 11 of 135 food banks may have led to selection bias.
Introduction
Even in high-income Western countries like the Netherlands, there are people who cannot afford sufficient nutritious food to eat. Food insecurity can be defined as the lack of availability of nutritionally adequate and safe foods, or the lack of ability to acquire acceptable foods in socially acceptable ways.1 It has been associated with unfavourable food choices2 and a less healthy diet. Food insecure people have a lower intake of fruit and vegetables2–5 and a lower nutrient intake5–8 which consequently may lead to micronutrient deficiencies and malnutrition.7 ,9 Furthermore, food insecurity was shown to be associated with poorer health including poor oral health,10 overweight, diabetes and heart disease, and consequently is a major public health issue.11–17 Food insecurity is a problem in adults, children and adolescents.18–21 However, this study focused on adults only.
Only a small number of high-income Western countries report prevalence rates of food insecurity, varying between 5% and 25%22–27: 5.2% in Australia,26 5.3% in South Korea,27 7.7% in Canada,22 15% in the USA24 and 15.8% in New Zealand.23 In Europe, food insecurity was only reported for low-income people in the UK, and was 25%.25
Of the more than 7 million Dutch households in 2012, 664 000 households (9.4%) were living below the low-income threshold. These 664 000 households comprise over 1.3 million individuals (8.4% of the Dutch population). Moreover, over 811 000 individuals had an income that was even below the basic needs variant of the low-income threshold. This lowest-needs variant relates to costs incurred by a single person for purchasing goods which are regarded as (virtually) unavoidable in the Netherlands, such as food, clothing, housing and personal care.28
The Dutch Food Bank aims to provide food parcels that supplement the normal diet for 2–3 days. Individuals living alone with a monthly disposable income <€180 qualify for food assistance as do families with a monthly disposable income of <€180 with the additional income allowance of €60 per adult and €50/child (<18 years of age). In 2013, the food banks weekly provided over 35 000 food parcels and thereby supported approximately 85 000 individuals in the Netherlands.29
There are many public and private food assistance programmes operating at national, state and local levels to reduce food security and hunger in high-income countries. Accurate measurement of the existence of food security, understanding the factors related to food insecurity and monitoring food assistance programmes can help public health officials, policymakers, service providers and the public at large to assess the growing needs for food assistance and the effectiveness of existing food assistance programmes. Research can also help to identify subgroups within food bank recipients who are food secure or at higher risk of low or very low food security.30
Limited research has been performed on the prevalence of food insecurity and factors associated with food insecurity in Europe. The present study aims to determine the prevalence of low and very low food security among Dutch food bank recipients, and to identify potential demographic, lifestyle and nutrition-related factors associated with low and very low food security.
Methods
This cross-sectional study was part of the Dutch food bank study, which explores and optimises food choices and food patterns among Dutch food bank recipients.
Food banks
On the basis of a search on the website of the Dutch Food Bank, emails, phone calls and food bank visits 11 of approximately 135 Dutch food banks were selected for the present study, based on factors including size, the frequency of providing food parcels, urbanisation, region and willingness of the food bank to participate. The food banks selected were located in Apeldoorn (N=29), Boxtel (N=11), Breda (N=42), Enschede (N=71), Groningen (N=17), Haarlem (N=6), Hilversum (N=16), Huizen (N=14), Rotterdam (N=28), Wageningen (N=12) and Zeewolde (N=5).
Study population and data collection
The target population consisted of recipients of the 11 selected Dutch food banks. Inclusion criteria for participation were: (1) at least 18 years of age, (2) sufficiently fluent in Dutch to participate in oral and written interviews, (3) recipient of a Dutch food bank for at least 1 month and (4) collect own food parcel at the food bank. A single member per household was included. Recipients were recruited between October 2010 and March 2011 through promotional posters and information letters. They could sign up for the study within 2 or 3 weeks after recruitment with an application form, by telephone or email. Participation was voluntary and confidential. Of the approximately 1200 food bank recipients who received an information letter or might have seen our promotional poster at the food bank, 368 signed up, of which 251 (68.2%) participated in the study. Of the 113 recipients who signed up for participation but ultimately did not participate, we were able to contact 41 by telephone to complete a short non-response questionnaire. Reasons for non-participation were: (1) not enough time (N=17), (2) did not pick up their food parcel (themselves) on the day of measurement (N=7), (3) missed the researchers on the day of measurement (N=5), (4) did not realise the measurements were on that specific day (N=4) and (5) other reasons (N=8). Measurement days were scheduled between October 2010 and April 2011. Participants who completed the study received a gift coupon of €5 and a small incentive for participation.
Food security
To measure the food security status of the participants, trained interviewers used a translated version of the six-item US Department of Agriculture (USDA) Household Food Security Survey Scale.30 The original, validated31 American questionnaire (see online supplementary table S1) was translated and back-translated for this study. Coding was carried out in accordance with the Guide to Measuring Household Food Security.30 Food security status was defined and classified according to the USDA guidelines: score 0 or 1 is food secure; score 2–4 is low food security; and score 5–6 is very low food security.30
Explanatory variables
The selection of explanatory variables was based on common sense and literature. Literature showed that sex,23 ,27 ,32 level of education,27 ,33 ,34 employment status,27 ,33 ,34 ethnicity,23 ,24 ,34–36 household size,7 ,13 ,35 household composition12 ,24 ,34 ,35 and weight status13 ,37–39 were associated with food insecurity and therefore included in this study. Physical activity was included because it may influence the energy balance and consequently food security status. Smoking and money spent on grocery shopping were included because they may influence food purchases and consequently food security status. Furthermore, satisfaction with the food parcel, satisfaction with overall food intake, perceived healthiness of food intake, self-efficacy of eating healthy and the use of products from the food parcel may influence the variety, quality and quantity of food intake and consequently food security status.
Participants completed a self-administered general questionnaire, which consisted of the following domains: sociodemographics, lifestyle factors, grocery shopping, food parcels, food intake and foods from the food parcels beyond the expiration date.
Sociodemographics included date of birth, sex, duration of being recipient of a Dutch food bank, household size, household composition, ethnicity, level of education and paid job. For ethnicity, we created two categories: Dutch and non-Dutch ancestry. A participant had a non-Dutch ancestry if the participant or at least one of the parents was born outside the Netherlands. We created three levels of education: low (finished less than elementary school), medium (elementary school), high (general intermediate, and lower vocational education, university, college, higher vocational, general secondary, and intermediate vocational education).
Lifestyle factors included self-reported height and weight, current smoking and physical activity. Body mass index (BMI) was calculated as self-reported weight (kg) divided by self-reported height (m2). BMI cut-off points of the WHO were used to define weight status.40 Physical activity was established by asking ‘How many days a week are you physically active with moderate intensity for at least 30 min?’. Moderately intense physical activity included sport activities, walking, cycling, gardening and performing heavy housework.
With regard to the domain grocery shopping, we asked ‘How much money do you weekly spend on average on foods and drinks to supplement the food parcel?’. This amount of money was divided by the number of adults plus children in the household to create the variable money spent on groceries per person per week. For statistical analyses two categories were created on the basis of the median; €0–€29.99 /person/week and €30–€50 /person/week.
Questions regarding food parcels included: ‘How satisfied are you usually with the content of the food parcel?’ (categories: not satisfied at all, not satisfied, neutral, satisfied, very satisfied), and ‘Do you usually use all foods from the food parcel?’ (categories: never, sometimes and always).
Food-intake-related questions included: ‘How satisfied are you with your current food intake?’ (categories: not satisfied at all, not satisfied, neutral, satisfied and completely satisfied), and ‘How healthy is your current food intake?’ (not healthy at all, not healthy, neutral, healthy and very healthy). Self-efficacy was measured with the question ‘How certain are you that you can eat healthily?’ (Not certain at all, not certain, neutral, certain and very certain). The aforementioned questions regarding satisfaction with the food parcels, and nutrition-related questions with five answer categories were scored from −2 to +2 and were analysed continuously.
Food parcels provided by the Dutch food banks consist of donated foods only and often include foods which are close to the expiration date. Questions on the use of foods beyond the expiration date therefore included: ‘Do you use perishable foods from the food parcel that are beyond the expiration date?’, and ‘Do you use non-perishable foods from the food parcel that are beyond the expiration date?’ (categories: never, sometimes and always).
Statistical analyses
Statistical analyses were performed using PASW statistics (formerly SPSS statistics) for Windows V.20.0 (IBM Corp, Armonk, New York, USA). Descriptive statistics were used to summarise participants’ characteristics and to examine the level of food insecurity in the study sample. Values in the text are mean±SD, frequency or relative frequency. Sex differences in the prevalence of low and very low food security were tested with χ2 test. Multinomial logistic regression analysis was used to study the association of demographic, lifestyle and nutrition-related characteristics with low and very low food security. The dependent variable level of food security consisted of three categories: food secure, low food secure and very low food secure. For each independent variable the categories low and very low food security were compared with the food secure category—the reference group. Univariate and multivariate analyses were performed. We adjusted for confounding effects by including the variables age, sex and level of education in the model. Crude and adjusted ORs are presented with their 95% CI. The variables age, sex, duration of being recipient, household size, household composition, level of education and money spent on groceries were tested for interaction with age, sex and level of education in multivariate analyses. Two-tailed p values of <0.05 were considered significant.
Results
In total, 251 Dutch food bank recipients participated in the study, of whom 37.1% were men and 62.9% women (table 1). Mean age of the total study sample was 46.3±10.6 years. Most of the participants were recipients of the food bank for >12 months. The majority of participants were of Dutch origin, had a medium level of education and did not currently have a paid job. Furthermore, mean BMI of the population was 27.3±6.3 kg/m2, and 56.8% were either overweight or obese. Smokers were much more prevalent than non-smokers.
Characteristics of 251 Dutch food bank recipients measured in 2010/2011*
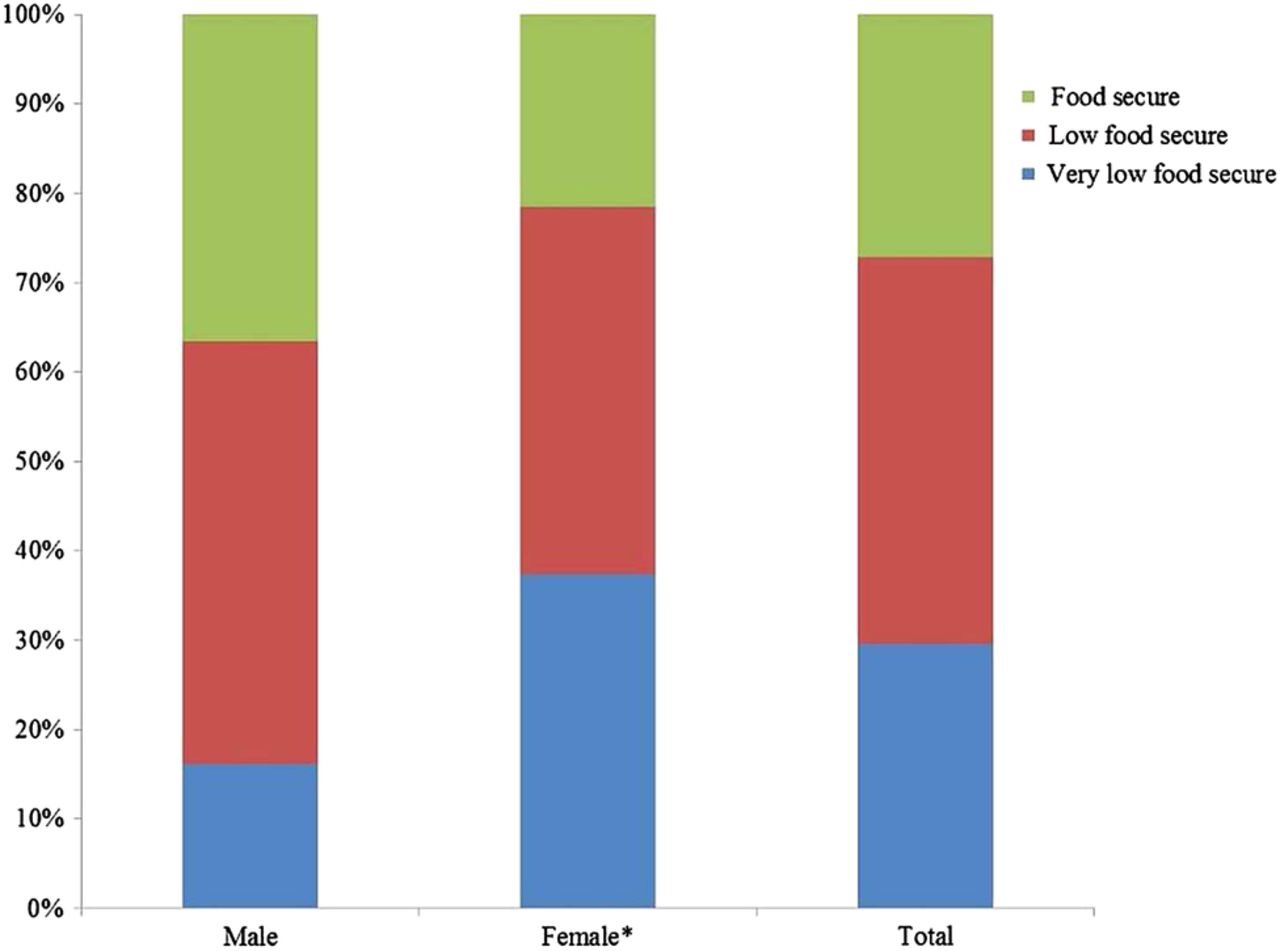
Of the sample, 84.9% (N=213) responded affirmatively to at least one item on our food security scale. Of those, 14% (N=30) affirmed only one item and were therefore classified as marginally food secure. The prevalence of food insecurity was 72.9% (N=183), of which 40.4% (N=74) reported very low food security (figure 1). Very low food security was significantly more prevalent in women than men (37.3% vs 16.1%; p=0.001). Of the very low food secure participants 56.8% (N=42) reported that they were ever hungry but did not eat because they could not afford enough food in the previous 3 months. This was the most extreme category of the survey instrument. This percentage was substantially lower among low food secure participants (3.7%, N=4). Univariate analyses regarding associations of demographic as well as lifestyle characteristics with low or very low food security compared with food security showed that men were less likely than women to experience very low food security (OR 0.25 (95% CI 0.12 to 0.53)). Participants with a low level of education were more likely to experience very low food security as compared with participants with a high level of education (OR 4.23 (95% CI 1.20 to 14.94)). In contrast to household size, household composition was associated with food insecurity. Households without children were less likely to experience low food security as compared with multiple households with children (OR 0.45 (95% CI 0.22 to 0.94)). Duration of being recipient of a Dutch food bank, employment status, ethnicity, BMI, weight status, current smoking status and level of physical activity were not associated with food insecurity.
Prevalence of food insecurity in 251 Dutch food bank recipients, stratified by sex (93 men and 158 women). *Very low food security is different for men, p=0.001 (χ2 test).
Univariate analyses regarding associations of nutrition-related characteristics with food security status showed that participants who were more satisfied with their overall food intake were less likely to experience low food security (OR 0.56 (95% CI 0.35 to 0.90)) or very low food security (OR 0.45 (95% CI 0.27 to 0.74)) compared with their counterparts. Participants who perceived their overall food intake to be more healthy were less likely to experience low food security (OR 0.46 (95% CI 0.27 to 0.78)) or very low food security (OR 0.35 (95% CI 0.20 to 0.62)) compared with participants who perceived their overall food intake to be less healthy. Participants who were more certain of a healthy food intake were less likely to experience very low food security (OR 0.62 (95% CI 0.41 to 0.96)) compared with participants who were less certain of a healthy food intake. Satisfaction with the food parcel was borderline significant; participants who were more satisfied with the food parcel tended to experience less low food security compared with participants who were less satisfied with the food parcel (OR 0.68 (95% CI 0.46 to 1.01)). No associations were found between the total amount of money spent on groceries per person per week, the extent to which products of the food parcel were used, the extent to which the use of perishable and non-perishable foods were used beyond the expiration date and food insecurity.
Tables 2 and 3 show multivariate associations of demographic, lifestyle and nutrition-related characteristics with low or very low food security compared with food security. After adjustment for age, sex and level of education the observed univariate associations remained statistically significant. Furthermore, multivariate analysis showed that participants who were more satisfied with the food parcel were less likely to experience low food security compared with participants who were less satisfied (OR 0.66 (95% CI 0.44 to 0.99)).
Multivariate associations of demographic and lifestyle characteristics with low and very low food security compared with food security in 251 Dutch food bank recipients†
Multivariate associations of nutrition-related characteristics with low and very low food security compared with food security in 251 Dutch food bank recipients†
Significant interaction was present between duration of being recipient and age (p=0.029) in its association with low food security. Older participants who are recipients of the food bank for a shorter period of time seemed to be less likely to experience low food security compared with their counterparts. Furthermore, significant interaction was present between household size and age (p=0.040) in its association with very low food security. Older participants with smaller household sizes seemed to be less likely to experience very low food security compared with participants with larger household sizes.
Discussion
Our study among food bank recipients is the first study addressing food insecurity in the Netherlands and showed that 72.9% of the Dutch food bank recipients are food insecure of which 40.4% are very low food secure. Furthermore, the presence of food insecurity was associated with female sex, low level of education, households with children, low satisfaction with the food parcel, low satisfaction with overall food intake, low perceived healthiness of overall food intake and low self-efficacy of eating healthy.
To indicate the severity of food insecurity in our study sample we compared our prevalence rates with available national prevalence rates and other charitable food assistance populations. The last group consists of people who depend on food assistance programmes regarding their food intake and therefore are not able to choose what they eat. We examined Dutch food bank recipients—a very specific group of low-income people—and one should therefore compare the prevalence rates of food insecurity with other samples with caution. Furthermore, in contrast to the US, in the Netherlands we do not have publicly run entitlement programmes.
The prevalence of food insecurity in our study was much higher than previously reported national prevalence data from other high-income Western but non-European countries.22–24 ,26 ,27 Comparison with the only European figure available shows that the prevalence of food insecurity was almost three times higher in our food bank population (73%) than in a study among low-income persons in the UK (25%).25 Compared with prevalence data of food insecurity from the US and South Korea, based on people who make use of any type of public food assistance, our prevalence was also higher. The reported prevalences in these studies were: 26.1% in food assistance programme users27 and 36.4% in public assistance users.35 Possible explanations for this difference are the differences in time period where the food security question refers to (eg, 3 months, 12 months), the year in which food insecurity was measured and the measurement instruments that were used. Compared with prevalence data of food insecurity from the US among food stamp programme users (66%41 and 71%34) and food pantry users (76%42 and 84%5) our prevalence is comparable. However, the proportion of very low food secure participants who reported that they were hungry but did not eat because they could not afford enough food was somewhat higher in our study than in a comparable study in the US42 (56.8% vs 40.1%).
A unique aspect of this study is the identification of demographic, lifestyle and nutrition-related factors associated with food insecurity. In Europe, this has only been studied among low-income persons in the UK so far. Our observed sex difference in the prevalence of food insecurity is consistent with previous studies,23 ,27 ,32 and could be explained by the fact that women may be the first to compromise their diet in an unhealthy way, to protect their children and partner when the family faces threats to their food supply.32 ,43
Consistent with previous studies conducted outside Europe, we found that food insecurity was associated with a lower level of education.27 ,33 ,34 Unlike previous studies, however, we found no association between food insecurity and employment status,27 ,33 ,34 ethnicity23 ,24 ,34–36 and household size.7 ,13 ,35 Possible explanations for these differences are that only 13.1% of the population had a paid job, and the majority (71.8%) of our population was of Dutch origin. Although we did not find a significant association with household size, we did find a significant association with household composition. As in previous studies12 ,24 ,34 ,35 households with children were more likely to experience low food security than households without children. Adult caregivers may sacrifice their own diet to avoid that their children should experience hunger.44 Previous studies showed that weight is positively associated with food insecurity, but only in women.13 ,37–39 In contrast to previous studies and our expectations, weight status was not associated with food insecurity. In our study, weight status was based on self-reported height and weight and therefore may have been biased. A study by Ver ploeg et al45 reported that overweight women who received food stamp benefits were less likely to recognise they were overweight than eligible non-participants.
Overall, Dutch food bank recipients included in our study had a more unhealthy lifestyle compared with the general Dutch population. The proportion of smokers was more than twice as high, 58% vs 25%,46 as was the prevalence of obesity, 28% vs 13.5%.47
A possible limitation of our study is its cross-sectional design which makes it impossible to draw any causal conclusions regarding the factors associated with food insecurity. Possible reverse associations might have occurred between characteristics associated with food insecurity variables which are not determinants of food insecurity (eg, weight status, smoking status, satisfaction with the food parcel). Therefore, these results should be interpreted with caution. Second, we were not able to adjust for the number of items, or for the total amount of calories in the food parcel because all food banks and parcels are unique (eg, different options for self-selection and/or the exchange of products). Third, of the 368 recipients who signed up 251 recipients (68.2%) participated in our study. This and the selection of 11 of 135 food banks may have led to selection bias. Last, although the USDA Household Food Security Survey Scale is validated for use in low-socioeconomic status persons in general, it has not yet been validated in food bank users. Therefore, we cannot rule out that bias or misclassification might have occurred.
In the US there is a small but growing body of evidence showing that the Supplemental Nutrition Assistance Program reduces the prevalence of food insecurity.48–50 The high levels of household food insecurity among Dutch food bank recipients, and the number of people who qualify for food assistance surpassed the supply, raising the question of whether food banks are able to supply the right quantity or nutritional quality of foods.
In conclusion, this paper shows that the prevalence of food insecurity is high among Dutch food bank recipients and that specific subgroups are more vulnerable for food insecurity. More research is urgently needed on the underlying determinants of food insecurity and on the effectiveness of food assistance by food banks.
Acknowledgments
The authors would like to thank all food banks that participated for their cooperation, all food bank recipients for their participation and all research assistants, MSc and BSc interns for their help in collecting data.
References
Supplementary materials
Supplementary Data
This web only file has been produced by the BMJ Publishing Group from an electronic file supplied by the author(s) and has not been edited for content.
Files in this Data Supplement:
- Data supplement 1 - Online supplement
Footnotes
-
Contributors JEN, IAB and MV designed the study. JEN and SCD conducted the data collection. JEN performed the complete data analyses and drafted the manuscript. SCD, MV and IAB gave significant advice concerning the interpretation of the results and critical review of the manuscript for intellectual content. JEN had primary responsibility for its final content. All the authors were involved in the development of the manuscript and approved the final version.
-
Funding This project was funded by a grant from the Netherlands Organization for Health Research and Development (115100003). The Netherlands Organization for Health Research and Development had no role in the design, analysis or writing of this article.
-
Competing interests None.
-
Ethics approval This study was approved by the Medical Ethical Committee of the VU Medical Center in Amsterdam, The Netherlands, as well as the national board of the Dutch Food Bank.
-
Provenance and peer review Not commissioned; externally peer reviewed.
-
Data sharing statement No additional data are available.