Article Text

Abstract
Objectives To demonstrate the benefit of defining operational management units in nursing homes and computing quality indicators on these units as well as on the whole facility.
Design Calculation of adjusted Resident Assessment Instrument – Minimum Data Set 2.0 (RAI–MDS 2.0) quality indicators for: PRU05 (prevalence of residents with a stage 2–4 pressure ulcer), PAI0X (prevalence of residents with pain) and DRG01 (prevalence of residents receiving an antipsychotic with no diagnosis of psychosis), for quarterly assessments between 2007 and 2011 at unit and facility levels. Comparisons of these risk-adjusted quality indicators using statistical process control (control charts).
Setting A representative sample of 30 urban nursing homes in the three Canadian Prairie Provinces.
Measurements Explicit decision rules were developed and tested to determine whether the control charts demonstrated improving, worsening, unchanging or unclassifiable trends over the time period. Unit and facility performance were compared.
Results In 48.9% of the units studied, unit control chart performance indicated different changes in quality over the reporting period than did the facility chart. Examples are provided to illustrate that these differences lead to quite different quality interventions.
Conclusions Our results demonstrate the necessity of considering facility-level and unit-level measurement when calculating quality indicators derived from the RAI–MDS 2.0 data, and quite probably from any RAI measures.
- Quality of Care
- Performance Measurement
- Unit
- Clinical Microsystem
- Nursing Homes
This is an Open Access article distributed in accordance with the Creative Commons Attribution Non Commercial (CC BY-NC 3.0) license, which permits others to distribute, remix, adapt, build upon this work non-commercially, and license their derivative works on different terms, provided the original work is properly cited and the use is non-commercial. See: http://creativecommons.org/licenses/by-nc/3.0/
Statistics from Altmetric.com
Strengths and limitations of this study
-
This article demonstrates a method for improving quality performance management in nursing homes.
-
The results indicate the necessity of focusing on management units in nursing homes when engaging in quality improvement in nursing homes.
-
The data used came from nursing homes in Canadian Prairie Provinces and so may not apply directly in other jurisdictions.
Introduction
In 2002, Nelson et al1 began to document the importance of clinical microsystems. Informed by the organisational literature, they defined these microsystems as “small, functional, front-line units that provide most healthcare to most people” and “the place where patients and providers meet. The quality and value of care produced by a large health system can be no better than the services generated by the small systems of which it is composed” (ref. 1 p 473). Quality improvement efforts in Great Britain, Sweden, Australia and Canada have focused on clinical microsystems,2–5 with promising early evaluations.6 For example, a leading children's hospital in the USA has embraced this concept by creating ‘microsystem leaders,’ accountable for quality and safety in their own microsystems.7
In this article, we demonstrate that measurement at the microsystem level in nursing homes is feasible, enhances opportunities for quality assurance and improvement and is scientifically sound. The article enhances our previous work that gave a practical and easily applied method for identification of clinical microsystems in nursing homes.8 The results should be useful to those managing and working in the sector as well as to researchers.
Translating Research in Elder Care (TREC) is an ongoing programme of research focused on improving the quality and safety of care delivered to residents of nursing homes. Protocols for the present programme phase have been published elsewhere.9–11 For over 6 years, TREC has closely followed a representative cohort of 30 urban nursing homes in the Canadian Prairie Provinces. These homes range in size from 48 to 446 beds (mean of 132) and have a representative distribution of owner-operator models with eight being publically owned and operated, 14 being run by the voluntary sector and eight being private for profit. TREC has collected data on organisational context in these homes on two occasions12 and has captured Resident Assessment Instrument – Minimum Data Set 2.0 (RAI–MDS 2.0) data from the nursing homes from 2007 onward. The present report focuses on this latter data and their use for our purposes of quality assessment and improvement.
As part of this work, we developed, validated and reported a functional definition of care unit in these homes8: a geographical area in a facility, serving a population of patients while they reside there, with dedicated management, which is characterised by:
-
A regular group of care providers (eg, healthcare aides, licensed practical nurses , registered nurses) who deliver the direct care and who work most of their shifts (typically at least 60%) on one unit.
-
A care manager who is in charge of the whole unit, but whose supervision may stretch across several units, for example, registered nurses on night shift.
-
A nurse who oversees the unit on a shift-by-shift basis, but whose supervision may stretch across several units, for example, registered nurses on night shift.
As part of our validation, we demonstrated that critical elements of organisational context, as reported by frontline workers in the facility, best aggregate to these defined units.8 Furthermore, when we applied our definition to our sample,8 we found that in 28% of nursing homes, a realignment of the unit structures defined by facility management was needed to ‘fit’ our definition. One common reason for realignment was that ‘unit’ had been used to define ‘houses’—living groups—rather than actual management structures. We then checked our realigned unit definitions with facility management; in all cases, they confirmed that we had defined the units correctly from a management point of view. Finally, we mapped our definition of unit onto the definition of clinical microsystems given by Nelson et al1 and achieved a very good fit. We concluded that the units we had defined were indeed the clinical microsystems of nursing homes. Given the recommendations that flow from present microsystem theory and our understanding of quality improvement, these units should be the focus of quality and safety improvement activity in homes.
In this article, we address the question: Can and should quality of care be assessed at the unit level in nursing homes?
Measurement is an essential component of quality improvement and has several key uses in that work13 ,14: identifying areas for improvement, evaluating the success of improvement efforts, assessing sustainability and scale-up of successful local improvements and reporting for accountability. All homes in our sample and the majority of nursing homes in Canada collect and report data quarterly using the RAI–MDS 2.0 system.15 This system has been studied for many years and quality indicators have been developed and validated.16–18 More recently, work was performed to risk adjust many of those indicators to account for the differences in resident populations across facilities.19 In Canada, RAI–MDS 2.0 is the version used in residential long-term care settings, and the Canadian Institute of Health Information has endorsed 35 of these indicators for reporting quality data back to nursing homes.20
In Canada, as in other jurisdictions, RAI–MDS 2.0 measures are reported back to nursing homes and others (eg, governments, funders, etc), with indicator data aggregated to the facility level without distinction by unit within a home. This type of aggregating blends results from multiple units such that detail necessary to manage a clinical microsystem can be lost. Unit-level improvement efforts need unit-level measurement.
In this article, we continue our exploration of clinical microsystems (units) in our representative set of nursing homes in the Prairie Provinces in Canada, with a focus on the role of microsystems in performance measurement. We examine several of the Canadian Institute for Health Information (CIHI) endorsed quality indicators, and demonstrate that homes could benefit substantially in their quality work by computing indicators at the facility and unit levels. We demonstrate:
-
The value in computing RAI–MDS 2.0 indicators at the unit and facility levels (illustrated with examples); and
-
The proportion of homes that benefit from having RAI–MDS 2.0 indicators at both levels.
Methods
In quality improvement work, temporal data such as quarterly RAI–MDS 2.0 indicators are often considered and evaluated using statistical process control (SPC) methods. A major tool for SPC is the control chart, containing two parts: (1) a series of measurements plotted in time order and (2) the control chart template—three horizontal lines called the centre line (typically, the mean), the upper control limit (UCL) and the lower control limit (LCL).21 Readers unfamiliar with SPC can consult several excellent sources on the science and interpretation of control charts.22–25 We computed control charts for three adjusted RAI–MDS 2.0 indicators in a stratified random sample of our study population of nursing homes and their units.
We computed RAI–MDS 2.0 quality indicator values using published methods19 and the standard model parameters employed by the Canadian Institute of Health Information.26–28 We carried out a covariate adjustment of the indicator in each unit or facility to account for the difference of its population from the standard model.
To compare quality indicators across units and facilities, we needed rigorous a priori techniques to determine whether a unit or facility improved over time, stayed the same or got worse. The Manitoba Centre for Health Policy produced the only report found in the literature on such a technique, in 2008.28 Informed by that work we developed an initial set of empirical rules to make decisions about temporal control charts. We then generated several sets of control charts for quality indicators, each of which comprised 20–25 charts. Using the original decision rules and the initial rules, three reviewers independently ranked the charts. After scoring, reviewers held a consensus conference to resolve differences and rules were modified as necessary. Next, with a new set of charts and the modified rules, the process was repeated. We completed two further iterations of this process to arrive at the final rules which are provided in the online supplementary material 2).
Setting and sample
Thirty urban nursing home sites in the TREC cohort have a total of 94 units. The distribution is shown in table 1.
Number of units in nursing homes
Since we were interested in comparison of unit and facility data, we focused on the 25 homes with two or more units. It seemed conceivable that homes with different numbers of units could perform differently, concerning variation in unit and facility behaviours. Hence we stratified the 25 homes into homes with two, three or four or more units and randomly selected two homes from each of these strata.
Measures
In previous work, we involved researchers and decision-makers to determine a set of practice-sensitive RAI–MDS 2.0 indicators.29 In this work, we examined control charts for three indicators: PRU05 (prevalence of residents with a stage 2–4 pressure ulcer), PAI0X (prevalence of residents with pain) and DRG01 (prevalence of residents receiving an antipsychotic with no diagnosis of psychosis). All indicators were risk adjusted. Using SPSS (20.0) we computed control charts for each indicator on each sampled facility and each unit in those facilities.30 One facility (17) was not included in the DRG01 analysis since it had reports from only two time periods. In all other cases, we had 13–18 observations from mid-2007 to the end of 2011. Control charts were graded with the decision rules to decide whether and what kind of change had occurred over the 13–18 quarters (3.25–4.5 years). Change classification was carried out by two of the experienced raters.
Ethics
Ethics and operational approvals were obtained from all participating investigators’ universities and from the participating sites, respectively.
Results
Inter-rater agreement in the development of the decision rules
Table 2 illustrates agreement statistics after each iteration in the development of the decision rules. At the end of the fourth iteration, the rules had stabilised and we declared the rules as the final ones.
Agreement statistics for rule development
We tested these rules further on another series of control charts, using two experienced raters from the previous team and adding two naïve raters. We began with two training sessions, each involving 20 charts, and discussed differences. Then we carried out a formal test on a new set of 20 charts. We achieved an average pairwise agreement of 92% with a Krippendorff's α of 0.804.
The sample of homes
The sample included smaller and larger homes with a variety of owner-operator models (table 3). Facility identifier numbers are anonymised and are called 3, 6, 13, 17, 26 and 28 in this report.
Characteristics of the nursing home sample*
The control charts
Table 4 describes the classifications by the two experienced reviewers of the 45 control charts considered and the final agreed-upon classification of control charts for each facility and its units.
Agreement in classification of control charts
Additional tables S1–3 (online supplementary material 1) demonstrate the results by indicator. Actual classification agreement between the reviewers was in excess of 80% for each indicator. The final decision in cases of disagreement was reached by consensus. Shaded cells are those in which the unit decision differed from the facility decision. Examination of these tables shows that data problems restricted our ability to compute control charts at the unit level in 3 of 60 (5%) cases. Of the 57 computed unit-level control charts, only 12 (21.1%) were deemed to be non-classifiable. Of the remaining 45 charts that were classifiable, 22 (48.9%) indicated different changes in the prevalence of the condition being monitored over the reporting period than did the facility chart.
Three examples of charts with differences
Figure 1 shows the control charts for the indicator PRU05 (stages 2–4 pressure ulcer) for facility 3 and 2 of its units (1 and 4). The facility was rated as having no change in quality over 4.5 years, while unit 1 had worsening quality and unit 4 had improved quality. From mid-2007 to the end of 2011, the facility prevalence of stage 2 or greater pressure ulcers remained constant at around 3%, with some variation. Values ranged from 4% (2008 quarter 1) to 2.5% (2010 quarter 3), but performance was remarkably stable. In unit 1, however, prevalence began at 1% and slowly worsened to almost 5%. On unit 4, prevalence began at 12%, improved to 3.5% within 2 years, and then remained relatively stable at 3.5–4.5%. If those accountable for quality and safety in this facility focused solely on the facility chart, they would miss the astounding improvement on unit 4 and not respond to the potentially serious worsening prevalence rates on unit 1.

Control charts for PRU05 (stages 2–4 pressure ulcers), facility 3 and units 1 and 4. All charts have the same scaling on the y-axis to aid in comparison.
Figure 2 demonstrates performance of the indicator PAI0X (prevalence of residents with pain) in facility 13. RAI data were available for 3.25 years, 2008 quarter 4 to 2011 quarter 4. In this case, the facility measurement showed improvement from a rate of around 20% to close to 10%. Similar improvement is seen in unit 3 of this facility as shown in figure 3. In contrast, unit 4 in this facility had a rate of around 30%, with substantial variation, and showed no indication of improvement. While the facility itself appeared to be dealing better with resident pain, unit 4 had high levels of pain which did not appear to change.
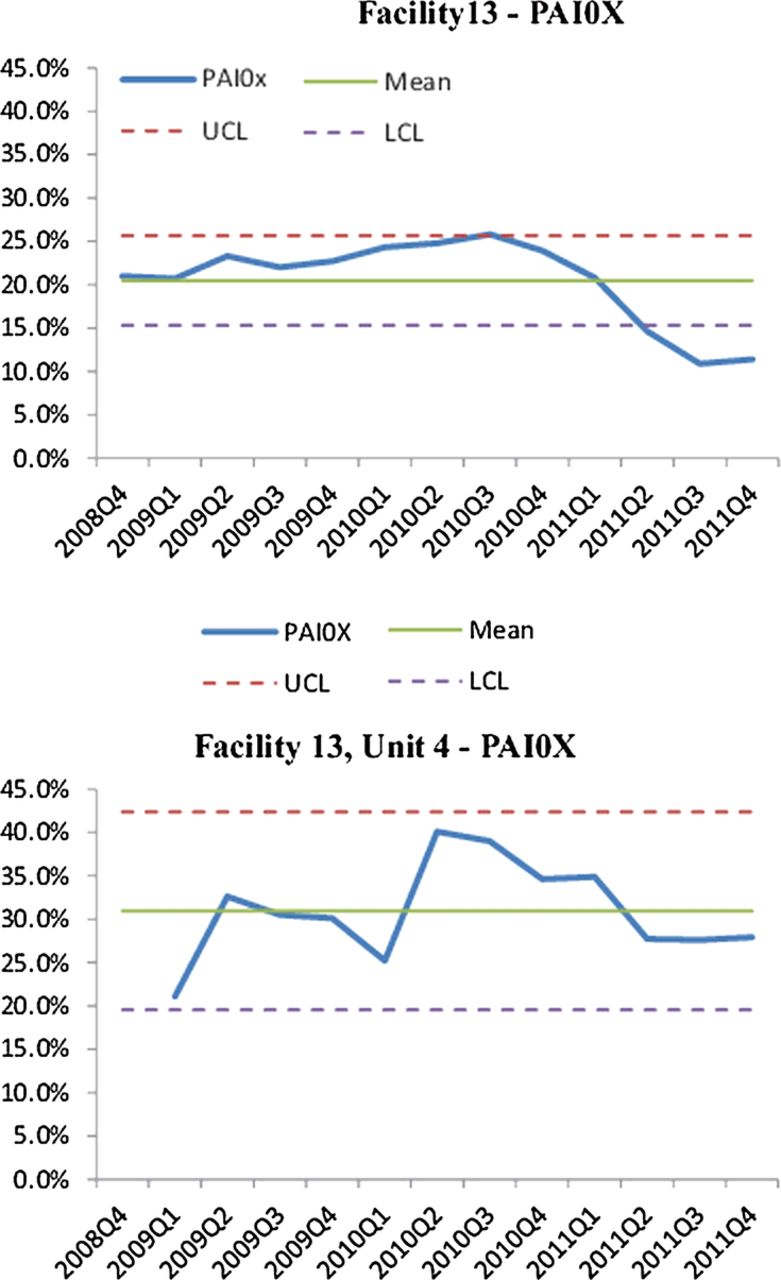
Control charts for PAI0X (pain), facility 13 and unit 4. Both charts have the same scaling on the y-axis to aid in comparison.

Control charts for PAI0X (pain), facility 13 and unit 3.
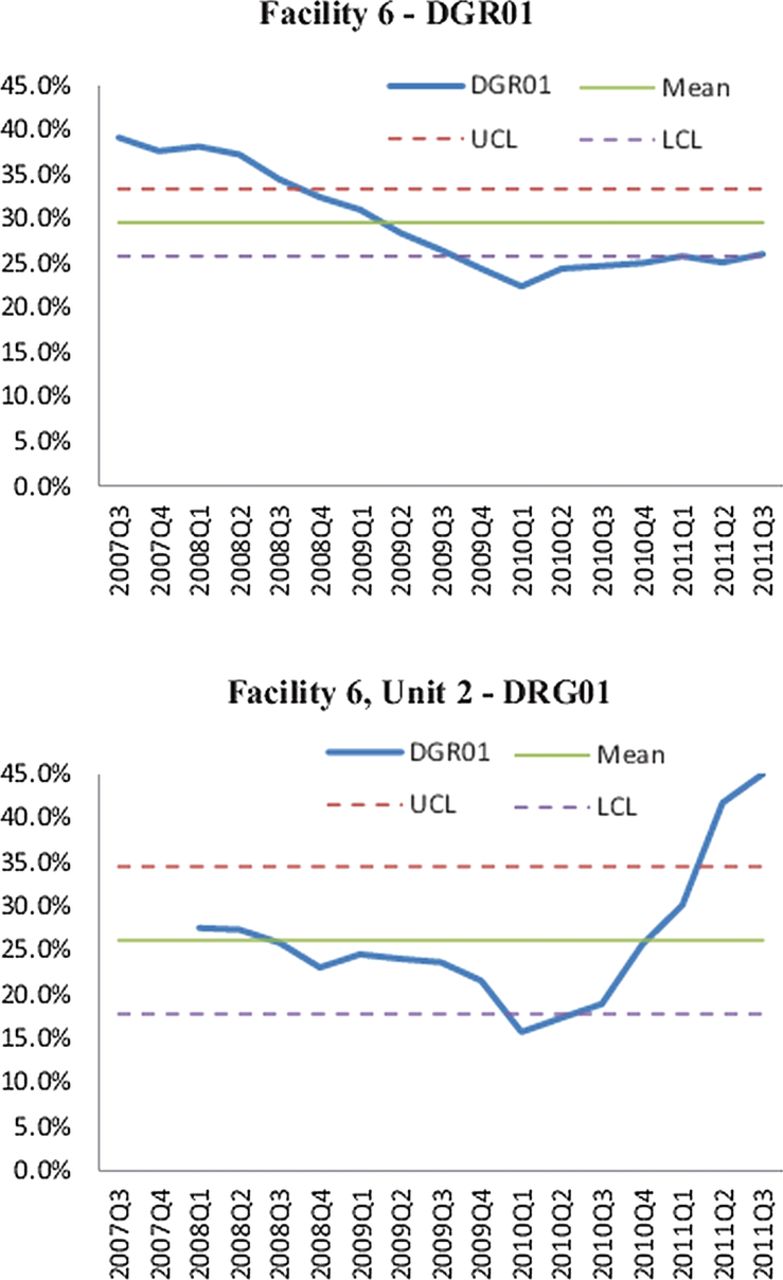
Figure 4 shows the performance in facility 6 on indicator DGR01 (prevalence of residents receiving an antipsychotic with no diagnosis of psychosis). Facility 6 showed marked improvement over 4.25 years, from a rate of 40% of residents on an antipsychotic with no diagnosis of dementia to a rate of 25%. In contrast, unit 2 in this facility started with a rate of 25% but its rate finished at over 45%. If one considered only facility-level data, one might celebrate. However, examination of unit 2 data would warrant at least discussion and probably investigation to understand the rate fluctuations.

Control charts for DRG01 (antipsychotics without psychosis), facility 6 and unit 2. Both charts have the same scaling on the y-axis to aid in comparison.
Discussion
In this article, we have advanced our work on units in nursing homes and demonstrated the use of SPC as a tool for quality improvement in nursing homes. We described development of a series of explicit decision rules which can be used by experienced and naïve reviewers to classify performance in control charts. We demonstrated good inter-rater reliability for these rules and invite others to learn and use them for monitoring quality and safety in nursing homes.
Several points are of note. First, no experimental interventions were carried out in the facilities during the 4.5 years of reporting. Thus, the performance displayed in control charts reflects the natural history of these facilities and units. Second, control charts were computed on adjusted indicators so changing patient populations would have little effect on values reported. Third, in 22 of the 45 cases (48.9%), unit control charts indicated different changes in the prevalence of the condition being monitored over the reporting period than did the facility chart. Fourth, substantive differences in the interpretation of performance appear when unit-level and facility-level data are examined.
Since these indicators come from quarterly RAI–MDS 2.0 data, they are less useful for monitoring actual quality improvement processes. However, they are useful for identifying gaps in quality or safety which might be amenable to quality improvement, for demonstrating sustainability of improvement over time and for accountability purposes. We have demonstrated that, in considering only facility-level data, one may miss substantial opportunities for improvement in some units and overlook important improvements occurring on other units.
We restricted our work to three indicators on a small, but representative, sample of urban nursing homes. In this sample, we showed that unit charts display different quality behaviours than the corresponding facility charts almost 50% of the time. We did not attempt to determine how many times unit results differed from facility results for other indicators or for non-urban homes. This may occur only infrequently, but even an infrequent difference may have an important impact on a facility's improvement and monitoring efforts.
The actual mechanics of creating control charts such as those reported in this article are quite straightforward but some technical challenges do need to be addressed. RAI–MDS 2.0 data must be identified at the unit level and units must be defined to be consistent with the definition of clinical microsystems. Facilities must examine their definition of unit, realign these definitions as needed and ensure that the unit field is consistently completed in RAI–MDS 2.0 assessments.
This work is limited in being carried out on a small but representative sample of urban nursing homes in the Prairie Provinces of Canada. We believe these homes are representative of the Canadian context. In jurisdictions with different organisational structures, variations between unit and facility performance may not be so large. However, evidence indicates that quality improvement may be most effectively carried out in microsystems.6 ,7
Conclusion
Our results demonstrate the necessity of considering facility-level and unit-level measurements when calculating quality indicators derived from RAI–MDS 2.0 data, and quite probably any RAI measures. We urge those accountable for collecting these data to first ensure that ‘units’ in their facility are aligned to clinical microsystems as described above, and second, ensure that unit-level identifiers are included in their datasets so that indicators can be computed at the unit level. These results support our previous work on the alignment of units in nursing homes with organisational-level microsystems. From our examples, it is clear that quality demonstrated by these important practice-sensitive indicators is a unit-level property. We believe that a focus on microsystems in nursing homes is important for system improvement.
Acknowledgments
The authors acknowledge the contributions of the Translating Research in Elder Care (TREC) team at the time of the study: Carole A Estabrooks (Principal Investigator), Investigators: Greta G Cummings, Lesley Degner, Sue Dopson, Heather Laschinger, Kathy McGilton, Verena Menec, Debra Morgan, Peter G Norton, Joanne Profetto-McGrath, Jo Rycroft-Malone, Malcolm Smith, Norma Stewart, Gary F Teare. Decision-makers: Caroline Clarke, Gretta Lynn Ell, Belle Gowriluk, Sue Neville, Corinne Schalm, Donna Stelmachovich, Gina Trinidad, Juanita Tremeer, Luana Whitbread. Collaborators: David Hogan, Chuck Humphrey, Michael Leiter, Charles Mather. Special advisors: Judy Birdsell, Phyllis Hempel (deceased), J Ivan (Jack) Williams, Dorothy Pringle (Chair, Scientific Advisory Committee). They assisted with recruitment of homes and local issues with respect to data acquisition.
Supplementary materials
Supplementary Data
This web only file has been produced by the BMJ Publishing Group from an electronic file supplied by the author(s) and has not been edited for content.
Files in this Data Supplement:
- Data supplement 1 - Online supplement
- Data supplement 2 - Online supplement
Footnotes
-
Contributors CAE, PGN, GGC, GFT and JES contributed the recruitment of the homes, acquisition of their resident assessment instrument data and original development of our unit definition. JWP led the work in computation of unit-level and facility-level RAI quality indicators. PGN, MM, GFT and MBD conceptualised, developed and tested the decision rules for control charts and applied them to the study sample. All authors contributed to the conceptualisation and design of the article, critically reviewed the manuscript for important intellectual content and approved the final submitted version of the manuscript. CAE and PGN secured funding for the study and take responsibility for the integrity of the data and the accuracy of the data analysis.
-
Funding This work was supported by a grant-in-aid from Canadian Institutes of Health Research (MOP #53107).
-
Competing interests None.
-
Ethics approval Health Research Ethics Board, University of Alberta.
-
Provenance and peer review Not commissioned; externally peer reviewed.
-
Data sharing statement The data used in this study are presently unable to be shared due to ethics and privacy restrictions. The TREC team is committed to appropriate open access of their data in the future and continues to work towards this end.